HAL Id: tel-02402620
https://tel.archives-ouvertes.fr/tel-02402620
Submitted on 10 Dec 2019HAL is a multi-disciplinary open access archive for the deposit and dissemination of sci-entific research documents, whether they are pub-lished or not. The documents may come from teaching and research institutions in France or abroad, or from public or private research centers.
L’archive ouverte pluridisciplinaire HAL, est destinée au dépôt et à la diffusion de documents scientifiques de niveau recherche, publiés ou non, émanant des établissements d’enseignement et de recherche français ou étrangers, des laboratoires publics ou privés.
Caractérisation et modélisation des effets de surpression
en champ proche et du chargement au sol du BLEVE
Roland Eyssette
To cite this version:
Roland Eyssette. Caractérisation et modélisation des effets de surpression en champ proche et du chargement au sol du BLEVE. Sciences de la Terre. Université de Lyon; Queen’s University Canada, 2018. Français. �NNT : 2018LYSEM020�. �tel-02402620�
N°d’ordre NNT : 2018LYSEM020
THESE de DOCTORAT DE L’UNIVERSITE DE LYON
opérée au sein de
MINES Saint-Etienne
délivrée en partenariat international avec Queen’s University (Canada)
Ecole Doctorale
N° 488Sciences, Ingénierie, Santé
Spécialité de doctorat
: Sciences et Génie de l’EnvironnementDiscipline
: Science de la terre et de l’univers espaceSoutenue publiquement le 16/10/2018, par :
Roland Eyssette
Caractérisation et modélisation du
champ de surpression proche et du
chargement au sol du BLEVE
Devant le jury composé de :Reynolds, James Professeur Queen’s University Président
Planas, Eulalia Professeur Universitat Politècnica de Catalunya Rapporteur
Ciccarelli, Gaby Professeur Queen’s University Rapporteur
Barz, Dominik Professeur Queen’s University Examinateur
Hoorelbeke, Pol Docteur Total SA Examinateur
Graillot, Didier Professeur Mines Saint-Etienne Examinateur
Heymes, Frédéric HDR IMT Mines Alès Directeur de thèse
Birk, Michael Professeur Queen’s University Co-directeur de thèse Laboureur, Delphine Professeur Assistante Von Karman Institute Invitée
Quiet people have the loudest minds - Stephen Hawking -
iv
Acknowledgements
This PhD project was made possible thanks to a successful cooperation between Mike Birk at Queen’s University in Canada and the research team of Physics of the Phenomena at the Institute of Risk Sciences, IMT Mines Alès in France - namely Frédéric Heymes, Laurent Aprin, Pierre Lauret, Christian Lopez and Pierre Slangen. It would have not been possible to reach this level of sophistication in the experiment and the results obtained without the implication of all parts of this cooperation. The expertise and pragmatism of Mike Birk gave very interesting directions to the research, especially when building the experimental apparatus from scratch. The uncountable time and dedication of Frédéric Heymes in planning the experiment and finding a location to make it possible, supported by the experimental skills of the whole French team brought this apparatus and research work to the next level.
This leads me to thank particularly Mike Birk and Frédéric Heymes as co-directors of this PhD work. The guidance, time, opportunities and help they have both offered me during this project were tremendous. I am very grateful for this.
Thank you to the jury, namely James Reynolds, Dominik Barz, Didier Graillot, Pol Hoorelbeke and Delphine Laboureur for making the defense possible. Special thanks to Gaby Ciccarelli and Eulalia Planas for reviewing the thesis with expert eyes to evaluate my work. Everybody complied well to the constraints of video conference as well as the need to satisfy the protocol of both institution, making the defense a very positive experience overall.
I would like to thank the administrative staff - Gabrielle Whan, Jane Davis and Corrine Vincent - for their help in navigating with me through the administrative hustle that was this cotutelle program. Thank you to Jane Paul in helping me through the proof reading process and improving my scientific English.
Thank you to all the lab mates and coworkers I have been sharing time with in France and in Canada – Maverick, Jimmy, David, Giordano, Mohamed, Clément, Frédéric, Pierre, Zac, Laurent, and the whole ISR lab - both for working through interesting scientific progress together and cracking jokes or sharing a beer to when things got too serious. Special thanks to Clément and Maverick, for daring to share an office with me for over two years each and managing to remain sane through this whole experience. And honorable mention to Frédéric, who shared with me his passion for climbing and the mountains. Ice climbing rocks.
Also a big thank you to all the friends and housemates in both countries that made this experience much more than just a PhD – August, Florie, Kas, Alexis, Dan, Fifou, Perrine, Thibault, to name just a
v
few. The amount of fun times, good talks, life advices, adventures and memories I have shared with all of you through these years is uncountable.
And finally I am grateful to my family – my parents Pascal and Christiane, my siblings and in-law Paul, Delphine and Amandine, and all the others - for supporting my decision to go through this PhD, even though they did not understand much of what I was doing with my explosions, and even if it meant for me to leave for two years 6000 km away from home.
This project was jointly funded by Queen’s University, the Natural Sciences and Engineering Council of Canada (NSERC), and IMT Mines Alès.
vi
Table of Contents
Acknowledgements ... iv
List of Figures ... ix
List of Tables ... xvii
List of Abbreviations ... xviii
Chapter 1 Introduction ... 1
Motivation ... 1
Objectives ... 2
Scope ... 2
Contributions ... 3
Chapter 2 Literature Review ... 4
Definition of BLEVE ... 4
Historical cases of major BLEVEs ... 6
Mechanisms of failure ... 8
Thermodynamics of BLEVE ... 12
Experimental research in BLEVE ... 19
Modeling of the overpressure hazard ... 26
Conclusion ... 41
Chapter 3 Compressible flow theory and key variables... 43
Euler equations of gas dynamics ... 43
Isentropic flows ... 43
Normal shock ... 44
Shock tube ... 47
C-D nozzle and under-expanded jet ... 51
Critical boiling flow modeling ... 61
Chapter 4 Experimental setup ... 64
Introduction and objectives of the experiment ... 64
Key parameters involved in the study of BLEVE ... 65
Apparatus design ... 67
Instrumentation ... 73
Data acquisition and Control ... 79
High Speed Imaging tools and techniques ... 79
vii
Experimental Procedure ... 87
Safety ... 87
Chapter 5 Experimental results ... 89
Summary of the test campaigns ... 89
Rupture patterns ... 91
Physical measurements of BLEVE experiments ... 94
High speed imaging data ... 100
Chronology of a BLEVE: example case ... 113
Chapter 6 Lead shock and maximum overpressure characteristics... 117
Anisotropy of the pressure-field ... 117
Shock formation: observations ... 123
Parametric analysis with failure variables... 125
Modeling ... 131
Conclusion on lead shock characterization ... 143
Chapter 7 Secondary flow patterns ... 145
Purpose of the chapter ... 145
Second shock formation process ... 145
Conclusions ... 156
Chapter 8 Phase change observation and consequences ... 157
Introduction ... 157
Objectives ... 157
Detailed analysis ... 157
Conclusion ... 172
Chapter 9 Ground loading characterization ... 174
Introduction ... 174
Objectives and major findings ... 174
Detailed analysis ... 174
Estimation model ... 181
Scaling to real size road tank truck ... 183
Conclusions ... 185
Chapter 10 Conclusion ... 186
Contributions to BLEVE research and industrial safety ... 186
Answers to the main questions of BLEVE ... 187
viii
Chapter 11 Appendices ... 194
: Overpressure prediction models: expansion energy calculation ... 195
Appendix B : Apparatus initial designs and evolutions ... 201
Initial test campaign: summer 2014 ... 201
Second test campaign: spring 2015 ... 202
Final apparatus design: spring 2017 ... 208
Appendix C : Test tubes after rupture ... 209
BLEVE experiments 2015 ... 209
BLEVE experiments 2017 ... 212
Appendix D : Validation of the 4-sensor probe ... 215
Appendix E : Data and plots from BLEVE 2017 ... 217
Appendix F : Graphic User Interface for timeline analysis ... 271
Appendix G : 2D CFD of the Open-ended shock tube ... 273
Introduction to CFD theory ... 273
Meshing and problem setup ... 275
Grid independence study ... 277
Time step size and CFL independence study ... 279
ix
List of Figures
Figure 2-1 Vessel failures from experiments (left: partial failure in fish mouth pattern ; right: total failure)
(Birk et al., 2006a) ... 5
Figure 2-2 Fireballs generated by a vessel rupture containing flammable PLG (left: experimental test from Birk; right: BLEVE accident in Toronto (2008) ... 6
Figure 2-3 Aerial view of the refinery after explosions, France, 1966 ... 6
Figure 2-4 PEMEX LPG Terminal during the accident, Mexico 1984 ... 7
Figure 2-5 Ruptured pipe of the reactor, Japan 2004 ... 7
Figure 2-6 Fireball resulting from the propane BLEVE, Toronto 2008 ... 7
Figure 2-7 Cosmo Oil refinery accident, Japan 2011 (left: Storage spheres under fire:; right: fireball resulting from a sphere BLEVE) ... 8
Figure 2-8 Step by step mechanism of a typical BLEVE failure ... 10
Figure 2-9 Catastrophic failure of a 1m3 experimental propane vessel (a) vessel before explosion ; b) explosion and radial propagation of the crack through the ends; c) after explosion, vessel flat on the ground) (Birk et al., 2007) ... 10
Figure 2-10 Potential failure scenarios of BLEVE ... 11
Figure 2-11 P-v diagram describing the various equilibrium state of fluid with rapid changing properties (Salla et al., 2006) ... 13
Figure 2-12 Schematic of a P-T diagram describing the saturation and superheat temperature defining the superheat degree ... 14
Figure 2-13 Spinodal lines on P-T diagram for propane, based on different equations of state ... 15
Figure 2-14 P-T diagram of a cold and a hot BLEVE ... 16
Figure 2-15 P-T diagram of experimental venting of R-22 in steel tubes with different fill level (65 % and 90%), showing the maximum superheat state reached by the liquid (Barbone, 1994) ... 17
Figure 2-16 Evidence of a pressure rise due superheated venting in a tube after a limited drop ... 18
Figure 2-17 Superheat venting of R-22 test tubes (left: P-T diagram of the steel vessels, with thermodynamic state before pressure rise; right: relation between pressure rise and pressure drop) (Barbone, 1994) ... 18
Figure 2-18 Results from experimental superheat boiling inside an open-ended cylinder (left: imaging inside the cylinder ; right: pressure signal at the top of the cylinder) (Chen et al., 2008) ... 19
Figure 2-19 Visualization of supercritical propane explosions (left: liquid-like expansion ; right: vapor-like expansion)(Laboureur, 2012) ... 21
x
Figure 2-21 Overpressure at 20m from the side of a 2000L tank (Birk et al., 2007) ... 23
Figure 2-22 Summary of experimental BLEVE with propane on P-T diagram ... 24
Figure 2-23 Schematic representation of the different phases of a pressure wave ... 26
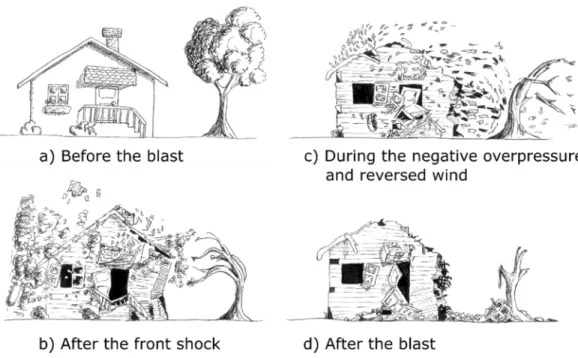
Figure 2-24 Artistic representation of the damages induced by a blast wave ... 27
Figure 2-25 Hopkinson blast wave scaling law (Strehlow and Baker, 1976) ... 29
Figure 2-26 Curves of overpressure versus scaled distance (Left: TNT scaling ; Right: Sachs Scaling) (Laboureur, 2012) ... 30
Figure 2-27 Schematic of the different types of errors: a) high systematic error; b) high random error ; c) high systematic and random error ; d) low systematic and random error (inspired from (Asch, 2010)) .... 36
Figure 2-28 Blast chart for propane liquid explosion from Van den Berg simulation work (Van den Berg, 2008) ... 39
Figure 2-29 Scaled overpressure-distance curves for liquefied propane explosion from CFD, in comparison with TNT curve (Yakush, 2016) ... 40
Figure 3-1 Schematic of the shock formation process by piston effect ... 44
Figure 3-2 Shock and flow velocity depending on the reference frame (a) Steady frame, unsteady shock of velocity , analog to traveling blast wave; b) Moving frame, steady shock) ... 46
Figure 3-3 Pressure evolution hypothesis and moving shock, observed by Laboureur (Laboureur et al., 2015) ... 47
Figure 3-4 Shock tube apparatus available in the laboratory of ISR ... 47
Figure 3-5 Shock tube wave structure (top: before membrane rupture, bottom: after membrane rupture) 48 Figure 3-6 x-t characteristics plot of wave structures emerging from a shock tube ... 49
Figure 3-7 Calculation of shock tube characteristics from shock Mach number and conservation equations for a case involving air (left: failure pressure 4; right: shock overpressure, 2 − 1)... 50
Figure 3-8 Shock overpressure from failure pressure of an Air-Air shock tube case ... 51
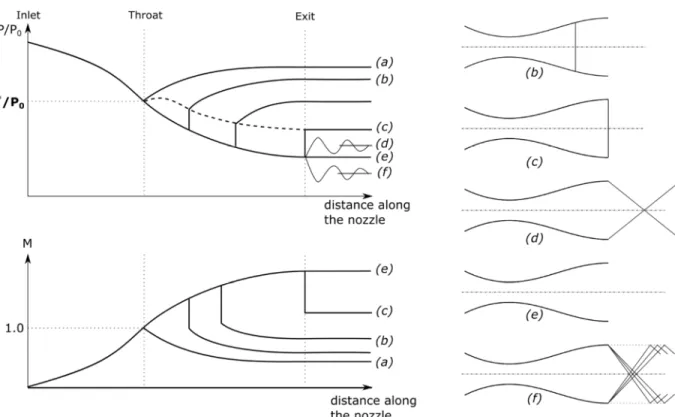
Figure 3-9 Pressure and Mach number along isentropic flows through a C-D nozzle ... 53
Figure 3-10 Pressure and Mach number along non-isentropic flows in a C-D nozzle ... 55
Figure 3-11 Mach diamonds behind a statically mounted Pratt & Whitney J58 engine on full afterburner while disposing of the last of the SR-71 fuel prior to program termination. (By NASA [Public domain], via Wikimedia Commons) ... 55
Figure 3-12 Schematic describing the topology of under-expanded jet (Abbett, 1971) ... 56
Figure 3-13 Schematic of the flow patterns involved in the transient start of a supersonic jet (Radulescu and Law, 2007) ... 56
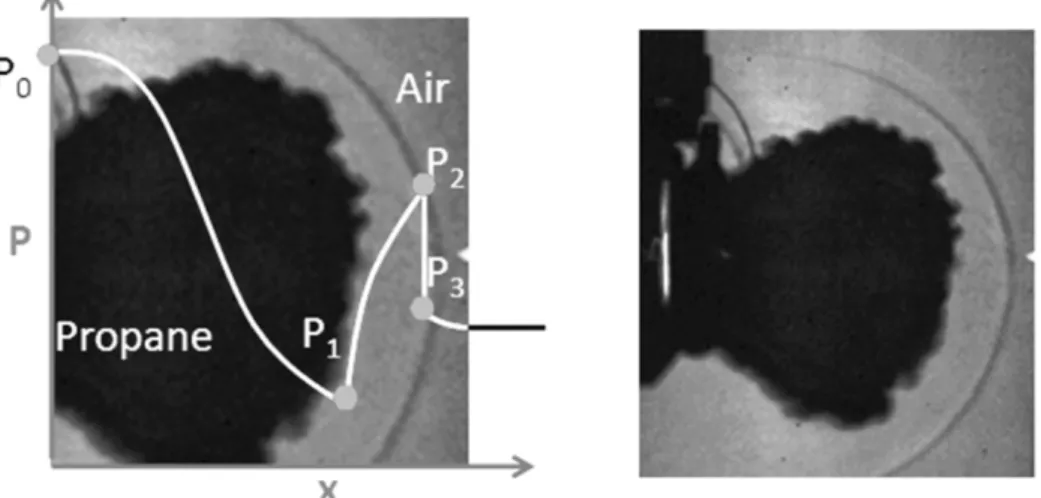
Figure 3-14 Pressure evolution and stationary shock, during first step of BLEVE observed by Birk (left: pressure profile prediction; right: evidence of Mach shock at exit of a vessel) (Laboureur et al., 2015) ... 57
xi
Figure 3-15 Pressure profile in expanding propane cloud, circles denote the contact surface, for =
25 (Yakush, 2016) ... 58
Figure 3-16 Time profiles of pressure at different distances from the center, 0 = 25 (Yakush, 2016) ... 59
Figure 3-17 Distance versus Time for spherical flow field (Kornegay, 1965) ... 60
Figure 3-18 Descriptive schemes of the definition of the control volume for conservation equations through boiling wave ... 62
Figure 4-1 Schematic of the tube apparatus ... 68
Figure 4-2 Photo of the experimental tube (left: close-up view before experiment; right: view on concrete stand, after burst) ... 69
Figure 4-3 Design of the seal with steel nut, end cap and Swagelok ferrules ( a) open ; b) closed and sealed) ... 69
Figure 4-4 Schematic of the piping circuit mounted for remote control of the filling and venting ... 70
Figure 4-5 Electric heater plate, machined to match the shape of the tube... 70
Figure 4-6 Characteristics of the machining process on the tube ... 72
Figure 4-7 Failure pressure for test campaign 2017, predicted versus actual ... 73
Figure 4-8 Blast gage positions and angles (a) top view; b) longitudinal view c) radial view) ... 75
Figure 4-9 Photo of the blast gages setup ... 76
Figure 4-10 Schematic of the four-sensor blast gage ... 77
Figure 4-11 Load cell mounting (left: photo of one load cell mounting under the base plate; right: descriptive scheme of the 4 load cells with regards to the tube ... 78
Figure 4-12 Optical axes of measurement ... 83
Figure 4-13 Examples of shadowgraph visualization (left: pool bottom projection of the waves at the surface; right: shocks generated by a rifle bullet ((Settles, 2001), CC BY-SA 3.0) ... 84
Figure 4-14 Scheme of Z-type shadowgraph configuration used in the testing ... 86
Figure 4-15 Spark control room ... 88
Figure 5-1 Failure control parameters of all tests on a Liquid Fill - Failure Pressure scatter plot ... 89
Figure 5-2 P-T diagram with failure condition of all plots with propane saturation curve ... 90
Figure 5-3 P-T diagram with failure conditions for water BLEVE test campaign (2014 and 2015) (a) and commercial propane (2015) (b)... 91
Figure 5-4 Partial failure with fish-mouth type of opening ( = 15 , = 60%, wall thickness = 0.9mm) ... 91
Figure 5-5 Full opening: catastrophic failure with flattening of the tube and separation into 3 pieces ( = 20 , = 60%, wall thickness = 0.9mm) ... 92
xii
Figure 5-6 Mapping of failure types with failure pressure and failure length (water BLEVEs 2014) ... 92 Figure 5-7 Full opening: catastrophic failure with flattening of the tube ( = 18.3 , = 18%,
= 150 ) ... 93 Figure 5-8 Full vessel opening from air burst ( = 15.5 , , = 150 ) ... 94 Figure 5-9 One-sided openings (left: = 19.0 , = 56%, = 50 ; right: = 12.5 , = 59%, = 100 ) ... 94 Figure 5-10 Evolution of the heating process of a test with respect to the propane saturation curve on a P-T diagram ... 96 Figure 5-11 Liquid overfilled test (left P-T diagram ; right: tube not fully open after burst) ... 96 Figure 5-12 Measurements from the 4-sensor blast gage above the vessel ( = 17.7 , = 17%, = 150 ) (left: pressure signals with same origin of pressure; right: same pressure signals shifted vertically for readability)... 97 Figure 5-13 Measurements from the near-field blast gages surrounding the vessel: left: 45o angle; right: horizontal plan ( = 17.7 , = 17%, = 150 ) ... 98 Figure 5-14 Measurements from the far-field blast gages surrounding the vessel ( =
17.7 , = 17%, = 150 ) ... 98 Figure 5-15 Ground loading measurement, load cells individually and total sum (left: = 26.9 −
= 61% − = 150 ; right: = 19 − = 56% − = 50 ) ... 99 Figure 5-16 Various transient pressure profiles measured inside the tube ... 100 Figure 5-17 Side view with direct high speed imaging (camera Photron SA5, "# = 142$%, = 20 , = 60% #& , '( & )&' '*) ... 102 Figure 5-18 Side view with direct high speed imaging (camera Photron SA3, "# = 200$%, = 18.6 , = 56%, = 75 ) ... 103 Figure 5-19 Top view with direct high speed imaging (Camera Phantom VEO710, "# = 52$%, = 19.3 , = 84%, = 150 ) ... 105 Figure 5-20 Axial view with direct high speed imaging (Camera Phantom V711, "# = 190$%, = 19.3 , = 83%, = 150 )... 106 Figure 5-21 Axial view with direct high speed imaging made in 2015 (Camera Phantom V711, = 28 , = 56% , = 75 ) ... 107 Figure 5-22 Radial view with shadowgraph high speed imaging (Camera Phantom V2512, "# = 120$%,
= 19.3 , = 86%, = 150 ) ... 110 Figure 5-23 Axial view with shadowgraph high speed imaging (Camera Phantom V711, "# = 115$%,
xiii
Figure 5-24 Radial view with shadowgraph high speed imaging (Camera Phantom V2512, "# = 107$%,
= 18.3 , = 18%, = 150 ) ... 112
Figure 5-25 Chronology of a BLEVE through physical measurements and high speed imaging ( = 18.6 , = 52.61%, = 75 ) ... 115
Figure 6-1 Overpressure ratios of gages with symmetric positions (left: at 30cm; right: at 3m) ... 118
Figure 6-2 Position of the far-field horizontal blast transducers around the tube ... 119
Figure 6-3 Ratio of overpressures side / end overpressure at 3m from the vessel ... 120
Figure 6-4 Ratio between maximum overpressure measured at 30cm from above the vessel and 45o angle ... 121
Figure 6-5 Ratio between top and side-on overpressure in the near-field (30cm), compared with the far-field (3m) ... 122
Figure 6-6 Opening time of the tube against failure pressure ... 123
Figure 6-7 Different stages of shock formation through shadowgraph ( = 19.3 , = 85%, = 150 ) ... 124
Figure 6-8 Overpressure signals from blast gages above the tube ( = 30.6 , = 65%, = 150 ) ... 125
Figure 6-9 Overpressure evolution above the vessel with failure pressure, for cases with 60% liquid and 150mm cut length (left: near-field; right: far-field) ... 126
Figure 6-10 Overpressure evolution above the vessel with liquid fill level, for cases of failure pressure between 17 to 19 bar, and 150mm cut length ... 127
Figure 6-11 Overpressure evolution above the vessel with cut length, for cases with 60% liquid and 19 bar failure pressure ... 127
Figure 6-12 Pressure waves generated through a test resulting in hydraulic failure (left: pressure signals from gages above the tube; right: shadowgraph) ... 128
Figure 6-13 Overpressure signals above the vessel for cases of similar failure pressure but different liquid fill level (left: high liquid content; right: high vapor content) ... 129
Figure 6-14 Axial shadowgraph showing the shock formation process for a high liquid content (left) and high vapor content (right). Tests conditions exposed Figure 6-13 ... 130
Figure 6-15 Comparison between energy models and experimental data from small scale BLEVE 2015 (left: Prugh 1991; right: Casal 2006 irreversible) ... 132
Figure 6-16 Comparison between energy models and experimental data from small scale BLEVE 2017 (left: Prugh 1991; right: Casal 2006 irreversible) ... 133
xiv
Figure 6-17 Comparison of experimental data for three experimental cases with the corresponding
expansion-controlled curve from (Van den Berg, 2008) ... 135 Figure 6-18 Prediction from expansion controlled model versus experimental results ... 135 Figure 6-19 Comparison of experimental overpressure measurements with Friedman Whitam prediction for one test case of small scale BLEVE 2017 (left: conservative prediction for most tests;
right:underpredicted case, mostly liquid) ... 138 Figure 6-20 Prediction from Friedman-Whitham model versus experimental results ... 139 Figure 6-21 Comparison of experimental overpressure measurements with Friedman Whitham prediction before and after radius adjustment ... 140 Figure 6-22 Effective vapor fraction based on Friedman-Whitham theory compared with small scale BLEVE experiments, with liquid fill value at each point (,4 = 1.13) ... 141 Figure 6-23 Prediction of large scale experiments from literature with F-W model: a) 400L, b) 2000L, c) 5000L ... 142 Figure 6-24 Effective vapor fraction based on Friedman-Whitham theory compared with small scale BLEVE experiments and large scale experiments from literature (,4 = 1.13) ... 142 Figure 7-1 Time versus distance for spherical flow field propagation with Mach shock reflection ... 146 Figure 7-2 Contour plots of the pressure evolution after burst of the compressed air chamber ... 147 Figure 7-3 Structure of the under-expanded shock (left: schematic at nozzle exit ((Abbett, 1971)); right: CFD of transient jet start, at t=2ms) ... 148 Figure 7-4 P-x plot after burst at the tube exit for various time steps (x=0: tube exit) ... 148 Figure 7-5 Pressure profile against time at different locations around the Mach disk maximum reach based on transient jet CFD ... 149 Figure 7-6 Overpressure measurements above the vessel for small scale BLEVE experiments ( = 26.9 , = 63%, = 150 ) ... 150 Figure 7-7 Formation of a condensation cloud above the Mach shock above the vessel ("# = 200$%,
= 18.6 , = 56%, = 75 ) ... 151 Figure 7-8 Pressure evolution through the flow features at the early steps of a BLEVE ( = 18.6 ,
= 56%, = 75 ) ... 152 Figure 7-9 Overpressure measured above the vessel at dP1 (15cm), for various cases at = 18.5 ± 0.5 , = 150 and varying liquid fill level ... 155 Figure 8-1 Transient pressure transducer location (left: scheme enlarged; right: photo of the transducer tube end with support plate) ... 158 Figure 8-2 Pressure profiles with varying failure conditions (a) no repressurization; b) late
xv
Figure 8-3 Transient pressure profile classification of all tests ... 159
Figure 8-4 P-T diagram summary plot with failure condition and pressure drops before stabilization .... 160
Figure 8-5 Description of the variables extracted from transient pressure signals ( = 29.5 , = 18%, = 150 ) ... 162
Figure 8-6 Path of the expansion wave from opening to pressure sensor ... 163
Figure 8-7 Parity plot between experimental measurement of #. ( and estimation of #. ( through wave propagation calculation ... 165
Figure 8-8 Pressure rise versus pressure drop (left: tube depressurization (Barbone, 1994); right: BLEVE experiments) ... 166
Figure 8-9 Chronology of events between sources of the BLEVE hazards inside the vessel (vapor expansion and liquid boiling) and consequences of the BLEVE (shock and cloud propagation) ( = 32.7 , = 70%, = 150 ) ... 169
Figure 8-10 Events occurring when the vessel opened, both outside (blast and clouds propagation) and inside the tube (expansion and boiling wave propagation) ... 170
Figure 8-11 Side window view of small scale propane failure ( = 28 ; = 56% ; = 75 ) ... 171
Figure 8-12 Boiling wave velocity through the window ... 172
Figure 9-1 Load cell location around the test tube ... 174
Figure 9-2 Ground loading measurement, gage by gage and total sum for 3 different profiles: ... 175
Figure 9-3 Test summary with specification of the presence or not of initial bump (a) No initial load; b) Initial load merged with main load; c) clear separated initial load) ... 176
Figure 9-4 Timeline of ground loading and internal transient pressure for case c) presence of initial load ( = 26.9 , = 61%, = 150 )... 177
Figure 9-5 Correlation between failure pressure and (left to right) maximum load; positive impulse; duration of positive impulse ... 178
Figure 9-6 Correlation between cut length and (left to right) maximum load; positive impulse; duration of positive impulse ... 179
Figure 9-7 Correlation between liquid volume fill level and (left to right) maximum load; positive impulse; duration of positive impulse ... 180
Figure 9-8 Non -dimensional maximum load as a function of failure pressure and liquid volume fill .... 181
Figure 9-9 Non -dimensional impulse load as a function of liquid volume fill and failure pressure ... 181
Figure 9-10 Description of the equivalent surface for ground loading estimation ... 182
xvi
Figure 9-12 Effective length of cylinder vessel ... 183
Figure 11-1 Variation of U and 0∆ as a function of the vapor fraction of the theoretical final condition (Planas-Cuchi et al., 2004) ... 196
Figure 11-2 Overpressure versus Sachs scaled distance, for TNO near-field estimation (TNO, 1997) ... 200
Figure 11-3 General view of the small scale BLEVE apparatus (1st test campaign: summer 2014) ... 201
Figure 11-4 Machined slot on top of the tube for controlled failure ... 203
Figure 11-5 General view of the small scale BLEVE apparatus (2nd test campaign: spring 2015) ... 204
Figure 11-6 Retroreflective shadowgraph setup schematic (Hargather and Settles, 2009) ... 205
Figure 11-7 Radial view with high speed retroreflective shadowgraph (Camera V711, "# = 115$%, = 37 , = 61%, = 100 ) ... 207
Figure 11-8 Overpressure signal at 40cm above the vessel with 2 different sensors ( = 16 − = 5% − = 150 ) ... 216
Figure 11-9 Blast transducers positions ... 218
Figure 11-10 Failure control parameters of all tests on a Liquid Fill - Failure Pressure scatter plot ... 219
Figure 11-11 P-T diagram with failure condition of all plots with propane saturation curve ... 219
Figure 11-12 Description of the different sections of the Graphic User Interface ... 271
Figure 11-13 Use of the timeline on the Graphic User Interface ... 272
Figure 11-14 Geometry and mesh description of the high pressure tube for transient jet simulation ... 276
Figure 11-15 Pressure profile versus time for monitors along the tube axis with different mesh sizes .... 278
Figure 11-16 Lead shock overpressure versus distance for different mesh sizes ... 278
Figure 11-17 Pressure profile versus time for monitors along the tube axis with different time steps ... 280
xvii
List of Tables
Table 2-1 Main causes of BLEVE (Abbasi and Abbasi, 2007) ... 9
Table 2-2 Experimental overpressure from literature ... 25
Table 2-3 Overpressure thresholds from French legislation (INERIS, 2005) ... 27
Table 2-4 Overpressure prediction models based expansion energy calculation ... 33
Table 3-1 Behavior of isentropic flow through converging and diverging nozzles ... 52
Table 4-1 Sensor characteristics ... 78
Table 4-2 Camera characteristics ... 80
Table 4-3 Link to camera datasheets ... 80
Table 4-4 Link to lighting device datasheets ... 81
Table 4-5 Summary of high speed optical axes and properties... 82
Table 4-6 Key independent parameters varied with control over the small scale experiments. ... 86
Table 6-1 Correlation table between failure parameters and maximum overpressure above the vessel ... 125
Table 6-2 Scaled distance, overpressure range and error of experimental test campaigns through expansion energy modeling ... 133
Table 6-3 Comparison between prediction models: errors between predicted and measured overpressure ... 139
Table 8-1 Correlation coefficient between transient pressure variables and failure parameters ... 163
Table 9-1 Correlation coefficients between load variable and failure variables ... 178
Table 9-2 Vessel geomteries of various scales, and ground loading estimation of a BLEVE ... 184
xviii
List of Abbreviations
BLEVE Boiling Liquid Expanding Vapor Explosion C-D nozzle Converging-Diverging nozzle
CFD Computational Fluid Dynamics
EoS Equation of State
FB Fractional Bias
F-W model Friedman-Whitham model GUI Graphic User Interface
HSI High Speed Imaging
ISR Risk Science Institute (Institut des Sciences du Risque)
LFG Liquid Flammable Gas
LGEI Laboratory of Industrial Environment Engineering (Laboratoire du Génie de l’Environnement Industriel)
LPG Liquid Petroleum Gas
NMSE Normalized Mean Square Error PILS Pure In Line Shadowgraph PLG Pressure Liquefied Gas TLOC Total Loss of Containment 123 Superheat Limit Temperature
1
Chapter 1
Introduction
Motivation
Pressurized vessels are commonly used in the industry to store and transport pressure liquefied gas (PLG). Accidents involving these vessels can lead to a specific type of explosion, called a Boiling Liquid Expanding Vapor Explosion (BLEVE). As the acronym indicates, these explosions involve the explosive expansion of the pressurized vapor, and the violent boiling from the liquid suddenly superheated due to the sudden loss of containment. This type of accident is known in the industrial landscape for over six decades now. However, predicting when it will happen, as well as the consequences of such an explosion still remains poorly understood in details.
Emergency responders need to be able to adopt the proper tactics when exposed to a pressurized vessel in hazardous environment, such as fire engulfment. Should they work on cooling down the vessel to avoid explosion or stay at a safe distance to avoid the consequences of the explosion? This question is difficult to answer because of the large number of parameters involved. It is difficult to evaluate the situation when on site: intensity of the fire, pressure inside the vessel, structural strength of the vessel wall, including small defects, rust and other weakening factors of the vessel wall structure.
Industries need to understand better the consequences of BLEVE to place their various vessels at safe distances from critical infrastructures and from each other, in order to avoid domino effects and diminish the severity of an explosion accident.
Finally the transportation industry policy makers need to understand the hazards involved with pressure vessels travelling through roads and railways. What would be the consequences of a BLEVE in a congested urban area, with high rise building? Similarly, what would happen if a road tanker accident lead to a BLEVE on a bridge?
Modeling and experiments have been conducted to improve our understanding of BLEVE. But the current understanding of the detailed physics of the explosion remains poorly understood to answer these questions.
2
Objectives
This project aims at understanding the physics of the compressible flow behavior and the thermodynamics involved in the near field of BLEVE accidents. It will focus on the physics of how the overpressure is generated in the near-field, and its hazardous consequences. One of the main questions it will try to answer is the following: what are the contribution of the vapor expansion and the liquid boiling in the overpressure generation, as well as in other hazards in the vicinity of the vessel?
Scope
The scope of this work included experimental research using a novel apparatus designed and constructed for this project. The basic apparatus was designed and constructed in Canada. Preliminary experiments were conducted in Canada using a limited array of instruments. A copy of the apparatus was then fabricated and shipped to France where a much more detailed experimental setup was constructed. The main experiments were conducted in France. Some computational fluid dynamics (CFD) was also conducted using the ANSYS Fluent software. This was done to help understand the observed phenomena. The CFD analysis was started in Canada and continued in France.
This contribution is a challenging experimental work conducted between IMT Mines Ales (France) and Queens’ University (Canada). Main experiments were performed in the so called Spark Facility located in France and provided a unique set of experimental data. The main focus of this work was to understand the physics of BLEVE through a small scale experimental setup trying to reproduce realistic cylindrical vessel explosions. The experimental prototype was designed and constructed for the purpose of the project. It consists of a an aluminum tube prepared and machined to burst at various controlled failure pressure, surrounded by blast gages and adequate instruments to capture pressure information, ground loading and other data meaningful to the understanding of the explosion. High speed imaging is set up to capture the explosion under different angles, with help of shadowgraph techniques to visualize the shock propagation. Numerical simulation work is performed to help the interpretation and analysis of the experimental data. The computation work is performed through ANSYS Fluent. It was limited to non-viscous transient compressible flow simulation, to be solved with modest computational capabilities.
This study focuses on the behavior of the fluid as it is depressurized and expands out of the failing vessel. It does not deal with the structural analysis aspect of the vessel failure itself, but it includes the observed deformations leading to its dynamic opening.
3
Contributions
With the safety engineering orientation of this project in mind, the contributions of the presented work are, in no specific order:
- The presentation of a small scale realistic BLEVE apparatus expanding the set of experimental data and imaging available in the domain of BLEVE research. Scaling in addressed but not fully solved;
- Chronological timelines of the phenomena involved inside and outside the failing vessel during BLEVE, with a graphic user interface developed for the purpose through Matlab;
- A study of the anisotropy of the pressure field out of a cylindrical vessel geometry;
- A discussion on the contribution of both fluid phases in the generation of BLEVE hazards in the near-field;
- A physics based model of the maximum overpressure based on compressible flow assumptions and conservation equations;
- Interpretations of experimental measurements to various flow patterns involved in the complex vessel opening of the BLEVE (side vortices, stationary shock due to critical flow), with help of numerical simulation;
4
Chapter 2
Literature Review
Definition of BLEVE
BLEVE (Boiling Liquid Expanding Vapor Explosion) is one of the most feared event in the industry. This accident consists of the failure of a pressurized vessel filled with PLG (Pressure Liquefied Gas), involving expansion of a vapor phase followed by flashing of a liquid phase. BLEVE is known for its powerful overpressure, fire or toxic hazard depending on the type of commodity stored, and the difficulty to predict with accuracy when a damaged vessel will fail. This type of industrial accident is now known for over 50 years. However the definition of BLEVE itself is still controversial. Various authors define "explosion" differently, as well as the influence of speed of the flashing process and its influence on the explosion. In 1979, Reid proposes a definition stating that a BLEVE occurs when the liquid is over its superheat limit at vessel failure (Reid, 1979) leading to homogeneous nucleation and triggering the explosive flashing of the liquid. Theoretically, the homogeneous nucleation induces the strongest explosive phase change possible. However, this state needs a liquid with no suspended particles, a vessel wall that is perfectly smooth with no nucleation sites and no temperature stratification, which never happens in practical case of industrial storage. Following this definition, there has probably never been a BLEVE in an industrial setting.
More recently, in 2007, a more realistic definition focusing on the catastrophic failure of the vessel was proposed by Birk et al. (Birk et al., 2007): "a BLEVE is the explosive release of expanding vapor and boiling liquid when a container holding a PLG fails catastrophically". A BLEVE implies that the vessel will fully open during the failure and leads to a TLOC (Total Loss of Containment). This full opening results in the formation of shock waves that travel out into the surroundings. This late focus on total loss of containment emphasizes the fact that a full opening of the vessel is needed to characterize a BLEVE. Partial opening of the vessel can lead to a strong jet release (Figure 2-1 left), but full opening of the vessel leads to a harmful blast wave and much more violent phase change of the superheated liquid. The flattened remains of the vessel after such accidents are witness of the violence of the explosion (Figure 2-1 right)
5
Figure 2-1 Vessel failures from experiments (left: partial failure in fish mouth pattern ; right: total failure) (Birk et al., 2006a)
A consequence of the release of LPG or other flammable contents through a BLEVE may lead to fire hazards, such as fireballs, flash fire or vapor cloud explosions. Indeed a fireball is often a very direct consequence of BLEVEs. However it should be clear that fire related consequences are not a necessity for defining a BLEVE. The BLEVE is the mechanical failure of a pressurized vessel, thus BLEVE can happen with non-flammable substances, for example liquid carbon dioxide.
BLEVE potential hazards
The destructive potential of BLEVE is due to several types of hazards. First, the explosive release of expanding vapor and flashing liquid generates strong overpressure and shock waves propagating into the surroundings. This hazard is of smaller range than fire and projectile hazards. However, it is present for any kind of PLG inside the vessel. Moreover the strength generated by the overpressure can be destructive for nearby structures, such as buildings, tunnels (van den Berg and Weerheijm, 2006), bridges or other vessels likely to trigger a chain reaction. This last scenario happened in the Cosmo Oil accident in Japan 2011 and will be described in Section II - .
Another form of hazard is the projection of vessel fragments. This hazard is much more random, but can be deadly and may be the furthest reaching danger. Hazard ranges for projectiles from rail cars have been observed greater than 1 km. Abbasi (Abbasi and Abbasi, 2007) published a review on the statistics on trajectory, penetrability and other characteristics of this kind of missile.
Finally, if the commodity is flammable, a fireball (Figure 2 2) can be generated. If ignition is not immediate, the flammable gas is dispersed, with risk of a vapor cloud explosion (TNO, 1997). If the gas is toxic (ammonia, chlorine), the explosion is followed by a toxic cloud dispersion.
6
Figure 2-2 Fireballs generated by a vessel rupture containing flammable PLG (left: experimental test from Birk; right: BLEVE accident in Toronto (2008)
This work will focus on the near field overpressure hazard and its consequences. Several physical aspects of this process need to be investigated in more detail to understand the consequences of such an event.
Historical cases of major BLEVEs
Abbasi has listed and classified many major accidents depending on their causes and consequences (Abbasi and Abbasi, 2007). Few examples are given here to illustrate the consequences of such accident.
LPG storage farm, Feyzin, France, 1966 (Institution of Chemical Engineers, 1987): Due to a handling issue while draining a 1200 m3 propane sphere, a leakage led to the generation of a vapor cloud of 1m deep, spreading over 150m. Ignition of the cloud occurred 25min after the leakage start due to a car on an adjoining road. The flash fire came back to the sphere, igniting a pool fire that engulfed the leaking container. After 90min of water spray and firefighters’ intervention, the sphere suffered a BLEVE killing 10 firemen, burning severely people up to 140m away, and triggering a domino effect on
surrounding spheres due to fragments projection. In the end, 5 spheres and 2 other pressure vessels
Figure 2-3 Aerial view of the refinery after explosions, France, 1966
7
exploded, killing 18 people, injuring around 80 others and leading to extensive damage to the site. This is the earliest major French BLEVE accident recorded.
PEMEX LPG Terminal, Mexico City, Mexico 1984: This accident is one of the deadliest catastrophes in the history of BLEVE, it resulted in of over 650 deaths and 6400 injuries. The accident was caused by the leakage of flammable LPG through a pipe on an industrial site receiving refinery supply, creating a vapor cloud explosion and a devastating chain reaction of BLEVEs.
Mihama Nuclear Power Reactor, Mihama, Japan 2004: A large pipe of superheated water leaked until pipe rupture. The resulting BLEVE released a strong two-phase flow that killed 11 workers nearby. This is an example of the damages a water BLEVE can lead to.
Sunrise Propane,
Toronto, Canada 2008: the accident occurred at Sunrise, a company selling propane for commercial purposes. The investigation states that the explosion may have originated from an illegal tank-to-tank transfer. An employee of Sunrise and a firefighter died because of the accident. Consequences like closing a major highway near the explosion, evacuating the surrounding population and cleaning the damage cause by the accident caused $CAD 1.8million. Additionally, law suits led to a $5.3million fine to Sunrise.
Figure 2-4 PEMEX LPG Terminal during the accident, Mexico 1984
Figure 2-5 Ruptured pipe of the reactor, Japan 2004
Figure 2-6 Fireball resulting from the propane BLEVE, Toronto 2008
8
Cosmo Oil Company, Chiba, Japan 2011 (Birk et al., 2013): as a consequence of a large magnitude earthquake, this disaster was the largest BLEVE so far, from large propane spheres with a storing capacity of 2000 to 4000m3, generating fireballs of diameters larger than 200m diameter.
Figure 2-7 Cosmo Oil refinery accident, Japan 2011 (left: Storage spheres under fire:; right: fireball resulting from a sphere BLEVE)
Mechanisms of failure
Substances involved in BLEVEs and main causes of failure
Historical surveys state that over 70 BLEVE events happened between 1970 and 2004, 46% of which with LPG (Liquid Petroleum Gas) (Salla et al., 2006), but many other substances have been reported (ethylene oxide for 9.5% of the cases, vinyl chloride for 8%, and sometimes water).
The main causes leading to BLEVE accidents are: train derailments, external fires, load/unloading operations. It is noted that 48% of the cases are classified as transport accidents, where the explosion is mainly due to fire (Salla et al., 2006). A vessel failure can find its origin in many causes: impact on the vessel or between 2 vessels (train derailment), fatigue due to loading/unloading cycles of the vessel, corrosion, poor weld, etc. The most common scenario of failure is a tank engulfed in fire (Table 2-1).
9
Table 2-1 Main causes of BLEVE (Abbasi and Abbasi, 2007)
Causes of BLEVE % of occurrence
Fire 36
Mechanical damage 22
Overfilling 20
Runaway reactions 12
Overheating 6
Vapor space contamination 2
Mechanical failure 2
Typical fire engulfed vessel failure
Let us consider the most common scenario from Table 2-1, a vessel containing PLG engulfed in a pool fire (Figure 2-8 a). First, the fire heats up the liquid phase, increasing temperature of the fluid inside the vessel, and consequently the pressure inside the vessel rises. The metallic structure of the vessel is heated up as well. The temperature of the bottom part of the vessel wall remains cool due to the contact with the liquid phase, due to the strong heat transfer coefficient and heat capacity of the liquid. However, the upper part of the tank wall is in contact with the vapor phase. It is exposed to a poor heat exchange due to the low gas thermal properties, and thus heats up dramatically. The high wall temperature weakens the tank structure until its yield strength becomes lower than the hoop stress generated by increasing internal pressure. The vessel deforms until it cracks open to release the high pressure content of the vessel.
When the wall opens, the vapor phase in the vessel (first exposed to the opening in this scenario) starts expanding out, pushing the surrounding atmosphere away (Figure 2-8 b). The pressure drops suddenly in the vessel, putting the liquid phase in a superheat state until sources of instability (nucleation site such as particle in the fluid, wall roughness, etc.) trigger the boiling (Figure 2-8 c). The subsequent boiling is violent because of strong superheat. The whole content is expelled outward, and the vessel wall may be separated into several parts, and propelling some pieces away (Figure 2-8 d).
10
Figure 2-8 Step by step mechanism of a typical BLEVE failure
Vessel failure patterns
To define the rupture patterns of the vessel, one must understand how it weakened first. If the weakened area on the vessel is small, the crack initiated by the opening of the vessel will eventually stop when reaching a stronger part of the wall, leading to a partial failure. The opening will lead to a typical fish-mouth opening pattern (Figure 2-1 left), and the release from this crack will be a two-phase flow jet. This is not a BLEVE.
If the weakened area is larger, the crack may keep propagating along the tank axis until the ends of the vessel. The crack may turn and go circumferential at the ends or it may cut through the ends. A classic failure pattern observed for cylindrical vessels is the following, crack propagates to the cylinder end caps, turn radially where the welds are and end up separating the vessel into 3 pieces: the center body and 2 end caps (Figure 2-1 right; Figure 2-9). The energy of the BLEVE will usually flatten the center part and propel the end caps like missiles.
Figure 2-9 Catastrophic failure of a 1m3 experimental propane vessel (a) vessel before explosion ; b) explosion and radial propagation of the crack through the ends; c) after explosion, vessel flat on the
11 Summary of the potential scenarios
One typical example of scenario has been described above. Depending on the timing of the different main events leading to a BLEVE (crack propagation, wall weakening, pressure drop and liquid boiling), various scenarios are observed. Figure 2-10 sums up some distinctive scenarios made through literature.
Figure 2-10 Potential failure scenarios of BLEVE
Birk et al. 2007 described the difference between one-step and two-step BLEVE that has been observed in some experiments. These patterns depend on how the crack opening propagates. If the vessel is weak enough, the crack will start and propagate through the whole length of the vessel in a few milliseconds, to then fully open the vessel. This corresponds to one-step BLEVE, the most widely observed BLEVE.
In some cases, the vessel wall is strong enough to stop the crack from propagating after it started. This leads the expansion of the vapor through the opening, and a pressure drop in the vessel. Ultimately, the
12
liquid phase will boil and a 2-phase flow jet release will take place through the partial opening. This can go until the vessel empties.
However sometimes the boiling is strong enough to cause internal pressure build-up that will trigger the crack to start propagating again, leading to a full BLEVE. This has been called the two-step BLEVE. The observed experimental cases lead to conclude that 2-step BLEVEs seem stronger than 1-step BLEVE. The delay between the crack stopping and propagating again can be up to 2s from experimental observation. The conditions inducing 2-step BLEVEs are an intricate balance of conditions between wall structural strength, weakening conditions, internal pressure build-up and dynamics of the opening.
Another concept presented in the literature is the distinction between hot and cold BLEVE (Birk et al., 1993). Cold BLEVE is when failure is triggered by impact or if vessel fails while liquid is cool and far from the superheat limit temperature (or 123). Hot BLEVE is when the liquid has been heated to near the 123. Hot BLEVE tend to be stronger than cold BLEVE. This leads to investigate the thermodynamic
concepts behind BLEVE, superheat liquid and violent boiling.
Thermodynamics of BLEVE
Understanding the thermodynamics of the fluid in the vessel helps to evaluate the power and hazards of this accident. Initial definitions of the BLEVE stated that the liquid temperature must be over the Superheat Limit Temperature, to reach homogeneous nucleation and have a BLEVE (Reid, 1979). Since that time experiments from many sources have shown that BLEVEs happen over a range of temperatures (Balke, 1999; Birk et al., 2007, 1993; Johnson and Pritchard, 1991). Superheat is the origin of the violent boiling. This requires us to define the concept of superheated liquid, together with superheat limit temperature.
Theoretical superheat limit: homogeneous nucleation
When the vessel fails, the vapor phase expands and the pressure drops inside the vessel. A rapid pressure drop in the liquid phase will result in a non-equilibrium process. However because the pressure drop is very fast, the liquid phase enters a non-saturated equilibrium superheat state. It is a metastable state where the fluid remains liquid while crossing the saturation curve into the vapor region (from B to C Figure 2 12). Ideally, this pressure drop is possible until the fluid reaches the limit of the metastable equilibrium condition (point C Figure 2 12). This condition is defined through stability analysis and must fulfill the following to remain stable (Shamsundar and Lienhard, 1993):
4∂P∂v8
9: 0
13
When reaching the theoretical conditions ending the stability of the superheat liquid state (point C Figure 2-11), the fluid will start boiling through a phenomenon of homogeneous nucleation. The liquid will boil at the molecular level: the hydrogen bonds break in the body of the liquid phase. This leads to a rapid and violent phase change. The expansion work generated by this phenomenon is understood to be the destructive power of the BLEVE.
Boiling at the molecular level (i.e. homogeneous nucleation) is only possible if no other nucleation sites are available. This is certainly not the case in practical pressure vessels. Therefore achieving this theoretical BLEVE is unlikely.
Figure 2-11 P-v diagram describing the various equilibrium state of fluid with rapid changing properties (Salla et al., 2006)
The line describing the theoretical stability limit to superheat state is called spinodal line. (CP-H for liquid and CP-I for vapor on Figure 2-11, dashed line on Figure 2-14). The vertical gap between the saturation line and the spinodal line describes the potential degree of superheat the fluid can reach when going through an ideal isothermal pressure drop. Constant temperature is a common assumption in this case, due to latency of thermal effect compared to pressure changes.
The degree of superheat is determined by this fixed superheat temperature compared to the saturation temperature for the actual liquid pressure (Figure 2-12). The Jakob number is a non-dimensional number to describe the degree of superheat of a fluid. It is defined as follow:
; = <=>?@(12A− 1BCD)
∆EFC=
14
Where <=GHI is the specific heat of the liquid phase, 12A is the temperature of the superheated liquid after pressure drop, 1BCD is the saturation temperature of the superheated liquid at this same pressure, and ∆EFC= the latent heat of vaporization. Jakob number describes the ratio of excess heat available in the
liquid due to superheat state and the heat required for vaporization phase change.
Figure 2-12 Schematic of a P-T diagram describing the saturation and superheat temperature defining the superheat degree
Definitions of the JKL
The superheat limit criterion brings us to the definition of the atmospheric superheat limit 123. For a PLG vessel failing in the ambient surroundings the pressure can only drop down to ambient pressure.
Early literature (Reid, 1983) states that the atmospheric superheat limit temperature corresponds to approximately 89% of the critical temperature (in Kelvin), giving 56.2oC for propane.
Then, the definition of 123 was determined through equation of state of the fluid considered and the spinodal stability criterion. Some authors call it thermodynamic superheat limit temperature. However, equations of states are numerous, and their domain of validity depends on the fluid described and its conditions. Two examples of thermodynamic 123 are calculated, for Van der Waals equation and Redlich-Kwong equation, giving 123MNOP= 40.5Q< and 123MRS = 59Q<. The disparity of these results show the issue of this definition. Van der Walls equation of state shows a lack of validity for this purpose, as the spinodal line defined from this equation of state go above the saturation curve for propane (Figure 2-13).
15
Figure 2-13 Spinodal lines on P-T diagram for propane, based on different equations of state
As a result, some recent studies offer a different approach to superheat. Salla (Salla et al., 2006) proposed a definition not based on thermodynamic stability, but on an energy balance between required vaporization energy of the flashing liquid and available heat in the remaining non-flashing liquid. Based on this method, 123MT = 53.8Q< and corresponds to the maximum energy transfer from the cooling liquid to the vaporizing liquid, leaving the remaining unboiled liquid at the minimum amount of energy possible. The authors of this method proved that their results fit well with classical approaches. Its advantage lies in not depending on equations of state and their domain of validity, relying only the fluid properties instead. This definition is used in prediction model to quantify the energy of the expanding fluid.
Finally, Mengmeng (Mengmeng, 2013) defines a U23, or kinetic superheat limit. The U23 is defined experimentally, in clean lab conditions. This quantification allows to validate the previous definition of superheat limit. Some experiments are available in the literature, trying to quantify the bubble growth rate in superheat. However, most of these experiments investigated butane superheat properties (Frost, 1988; Shepherd et al., 1982), little results are available to characterize propane experimental superheat limit.
In order to plot spinodal lines on thermodynamic plots with experimental data from this work, the spinodal defined by Redlich-Kwong is chosen for convenience, as the other methods only deliver a single 123 and atmospheric pressure, and not the full spinodal line.
Use of the JKL in BLEVE theory
For all these definitions, the 123 corresponds to the temperature on the liquid spinodal corresponding to atmospheric pressure (Figure 2-14). The consequence is that the superheat energy available in the phase change is maximum at the superheat limit temperature 123 and atmospheric pressure. It is visible as
16
the largest possible drop in pressure between the saturation line and the spinodal line on the P-T diagram (Figure 2-14).
The concept of hot and cold BLEVE (Birk et al., 1993) are based on this definition of 123. An explosion below superheat limit temperature (1TCHG: 123) is considered as a cold BLEVE while 1TCHG V 123 is considered a hot BLEVE. Cold BLEVEs are limited by atmospheric conditions. Hot BLEVEs are
considered stronger due to higher pressure and temperature of failure, and because the liquid can theoretically reach higher degrees of superheat by dropping closer to the spinodal.
Figure 2-14 P-T diagram of a cold and a hot BLEVE
Practical superheat unstability: heterogeneous nucleation
However, the reality of industrial cases and experiments have shown that reaching homogeneous nucleation never happens in practice. Between the saturation line and the spinodal line, the fluid is in a metastable state, waiting for a disturbance to nucleate. If none occurs, it reaches homogeneous nucleation at the theoretical superheat limit. In practical cases such as industrial vessels, wall roughness, dirt or other particles in the fluid provide nucleation site: they are sources of bubbles to grow, triggering a so-called heterogeneous nucleation. The boiling process then starts before reaching the spinodal line.
Because of this practical aspect of superheat, the early definition of BLEVE from (Reid, 1979) seems too restrictive, it considers only explosion above 123 and reaching theoretical superheat. Similarly, the distinction between hot and cold BLEVE is not as sharp as believed in theory. There is no dramatic change in superheat degree in practice before and after the 123, as shown by some experimental results (Barbone, 1994) (Figure 2-15). In their experiments (in glass tubes) the boiling began before the spinodal was reached. This spreads out the time over which the phase change process occurs and reduces its power.
17
Figure 2-15 P-T diagram of experimental venting of R-22 in steel tubes with different fill level (65 % and 90%), showing the maximum superheat state reached by the liquid (Barbone, 1994)
Experimental studies on superheat boiling
Experimental studies of superheated liquid boiling have been conducted to define the pressure response in vessels and cylinder.
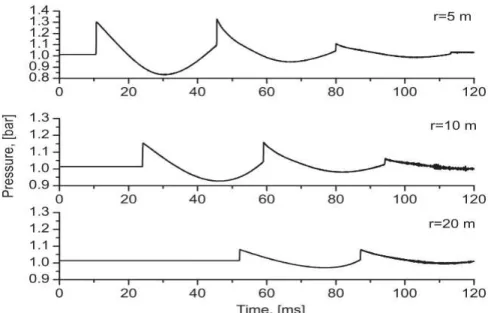
Barbone (Barbone, 1994) studied the venting of superheated refrigerant R22 from 260mL steel tubes Teflon-coated inside and 75mL glass tubes, through the bursting of a foil diaphragm after reaching equilibrium in the tube. Refrigerant R22 is used because its thermodynamic properties are very similar to propane properties, without the flammable aspect. Pressure in the vessel was measured at the bottom and top. The study was run by varying the following parameters: vessel pressure before diaphragm burst, liquid fill fraction, vent cross section area at exit of the tube, wall surface conditions (Teflon or glass) and level of pre-nucleation. First, he shows that superheat boiling of R-22 through a limited cross section area will lead to a pressure rise after a limited drop, while a fluid not superheated like water will drop down to atmospheric pressure (Figure 2-16). The pressure drop defines the level of superheat reached by the fluid.
18
Figure 2-16 Evidence of a pressure rise due superheated venting in a tube after a limited drop
His results with the steel vessel confirm that heterogeneous nucleation starts before reaching the theoretical thermodynamic stability criterion (or spinodal) (Figure 2-15). It also shows that the pressure rise from the violent boiling is proportional to the pressure drop, and thus to the superheat degree reached by the liquid (Figure 2-17).
Figure 2-17 Superheat venting of R-22 test tubes (left: P-T diagram of the steel vessels, with thermodynamic state before pressure rise; right: relation between pressure rise and pressure drop)
(Barbone, 1994)
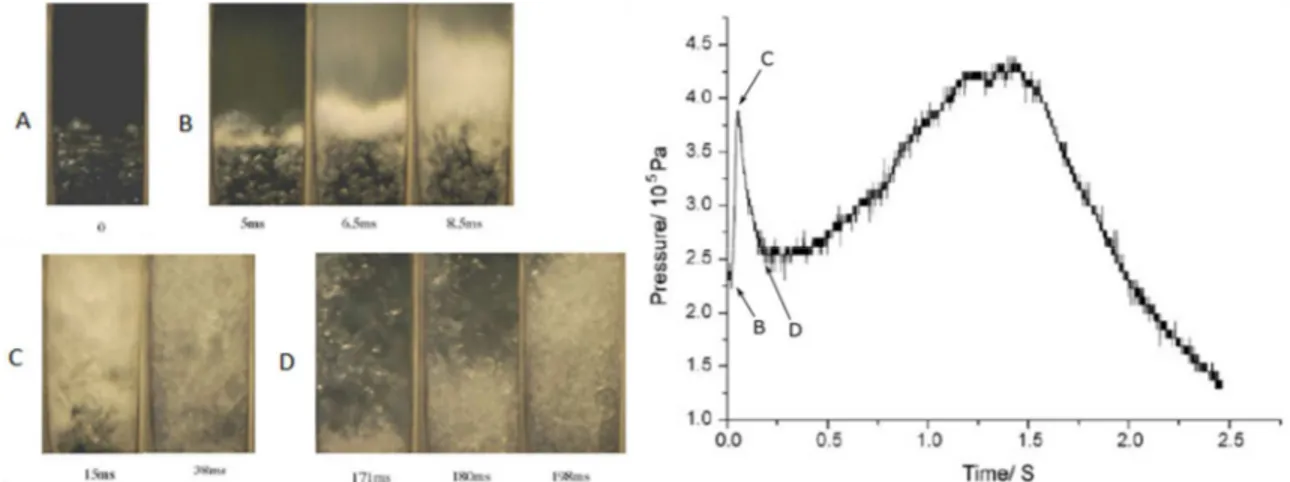
Chen (Chen et al., 2008) performed a boiling experiment with water in a larger squared section tube (160mm x 160mm x 880mm – 22.5L) with a rupture disk to reach superheated state. He measured transient pressure at the bottom and top of the tube following the boiling, while recording high speed imaging of the phase change inside the cylinder. The imaging show two different regimes of boiling (Figure 2-18 left A) to a fully two-phase flow mixture (Figure 2-18 left C). The corresponding pressure
19
signal shows a strong pressure peak (4bar at 34ms Figure 2-18 right) when the whole fluid is fully boiling, showing experimental correlation between violent boiling and pressure wave in a contained volume.
Figure 2-18 Results from experimental superheat boiling inside an open-ended cylinder (left: imaging inside the cylinder ; right: pressure signal at the top of the cylinder) (Chen et al., 2008)
Similar experiments are also conducted with CO2, with studies both inside (Ciccarelli et al., 2015) and outside the tube (Hansen, 2018). These experiments also showed that liquid boiling from superheat state add a significant increase in pressure inside the tube of restricted section. Various flow patterns, similar to Mach diamonds from a choked jet flow, are visible and simulated outside the tube.
These experiments showed interesting characteristics of the consequence of superheat. However, they are all conducted in cylinders failing at one end along the cylinder axis. Thus the opening cross section area is more restrictive than vessel failure observed in BLEVEs. This restriction leads to longer venting time, thus larger and steadier pressure rise conditions, that the dynamic opening of BLEVE make harder to observe.
Experimental research in BLEVE
From the statements made so far, BLEVE seems to be a complex combination of variables: external conditions acting toward vessel failure, wall vessel structure, internal pressure, superheat response of the liquid etc. Experiments have tried to isolate some of these variables (example with the superheat experiments previously discussed). In order to have a more global picture of the phenomenon, more realistic experiments of vessel failure have been conducted. From small lab tests to real size vessel explosions, an interesting range of experiments already exists to characterize and understand better the BLEVE. The variety of the scales covered by experiments in the literature covers an interesting range over critical variables such as failure pressure, vessel size, measurement distance from the vessel.
20 Small scale BLEVE experiments
Small scales experiments are mostly set for their convenience to set up (cheap, most likely indoor in lab conditions) as well as the potential to do many experiments, for parametric analysis and repeatability. However, dimensional analysis is needed when scaling back to real size problems.
V-1.1. Davison 2008
Experiments on commercial gas cylinders used for portable cooking as in camping. The canisters contain 440g of liquefied gas, in a proportion of 70% propane 30% butane. Some tests were performed for the potential BLEVE effects of such containers exposed to a heat source.
BLEVEs were observed in a repeatable way, and difference is made between the rupture patterns of BLEVE and hydrostatic rupture. But no overpressure data is available through these experiments.
V-1.2. Laboureur 2012
The experiments of Laboureur (Laboureur, 2012) cover supercritical failure of small scale propane vessel. Her experiments are the smallest vessels observed in literature so far, with containers of 41g (95mL) for propane experiments and around 6g (13mL) for butane, but by far burst at the strongest pressures (from 50 to 450bar). They consist of a small cartridge filled with PLG, machined notch on top and heated until failure by an electrical resistor. Overpressure data and high speed imaging is available for these experiments.
The main outcome of this work is the distinction of two regimes of supercritical failure, vapor-like or liquid-like, depending on which side of the saturation dome the rupture conditions are located. Distinctive cloud shapes are visible according to the case observed, varying from a spiky irregular cloud structure for liquid-like (Figure 2-19 left) to a smooth dome for vapor-like expansion (Figure 2-19 right).
21
Figure 2-19 Visualization of supercritical propane explosions (left: liquid-like expansion ; right: vapor-like expansion)(Laboureur, 2012)
Shock wave visualization has also been set up on this experiment, with a few images presenting an initial shock ahead of the cloud (Figure 2-20). The shock is captured with retro-reflective shadowgraph, with a Phantom V7.1 at 14kHz, with a 128x128 resolution. These images allow measuring the shock and cloud velocity. The order of magnitude of the velocities measured is over 400m/s for the shock and 200 to 300m/s for the cloud. These are the first experiments showing shadowgraphs of shock wave ahead of a supercritical fluid explosion. However, due to the supercritical nature of the explosion, the question of the contribution of each phase as in real BLEVE accident is unresolved.
Figure 2-20 Shadowgraph of the vessel burst, capturing the shock propagation (Laboureur, 2012)
Another contribution of this work to the literature on pressure vessel burst characterization is the measurement of overpressure on top and sides of the cylindrical vessel.
22 Mid-scale BLEVE experiments
V-2.1. Giesbrecht 1981
Giesbrecht experiments (Giesbrecht et al., 1981) used small to medium scale model vessels, from 0.125kg (0.226L) to 452kg (1m3). The test fluid was propylene. The vessels were 100% full of liquid phase before controlled failure with puncture mechanism, between 40 to 70 bar. His work focused on the consequences of the flammable cloud ignition, one of his conclusions being that the shock generated by pressure expansion work is significant close to vessel but decays quickly compared to potential vapor cloud explosion hazards.
It is a significant work defining superheated liquid boiling overpressure generation from a vessel. Unfortunately, overpressure data with time from mechanical burst are not presented, thus it is hard to deduce the actual impact of liquid on shock wave generation.
V-2.2. Birk 1994 - 2007
Birk tested propane BLEVE on cylindrical vessels of 400L and 2000L with a various range of liquid propane filling (Birk et al., 2007, 2006b, 2006a, 1993; Birk and Cunningham, 1994). The failing pressures were between 20 to 26 bar, with pressure relief valves. These experiments have shown several interesting aspects of the BLEVE. A first conclusion is that the setting of pressure relief valves at 25 bar prevents a stronger build-up of pressure, but only delays the failure in the fire. Moreover, 25 bar is close to the superheat limit of propane, bringing the risk of superheat energy in the liquid to its strongest. It also emphasizes the effect of thermal stratification in the vessel, reducing the total energy in the reservoir before failure. Finally, these tests are the origin of the definition of two-step BLEVE described previously (paragraph III-4), as some have been observed through this work. Hot and Cold BLEVE also came from this work. In one test the 400L vessel was weakened by machining a groove along the top of the vessel. The vessel failed very rapidly while the liquid was still near ambient temperature. The result was a single step rapid BLEVE with very weak overpressures and no significant projectiles.
Some blast pressure traces taken in the far field were the bases of hypotheses made on the contribution of the vapor phase and the liquid phase in the overpressure. Figure 2-21 shows the overpressure trace measured 20m away from the side of a 2000L tank. It presents two first peaks separated by a negative pressure, characteristic of a vapor explosion (Kinney and Graham, 1985), and a third overpressure peak that is not really a shock. Its origin is assumed to be coming from the liquid boiling repressurization, but validation of this hypothesis is still pending.