Publisher’s version / Version de l'éditeur:
Canadian Geotechnical Journal, 21, 1, pp. 100-115, 1984-02
READ THESE TERMS AND CONDITIONS CAREFULLY BEFORE USING THIS WEBSITE. https://nrc-publications.canada.ca/eng/copyright
Vous avez des questions? Nous pouvons vous aider. Pour communiquer directement avec un auteur, consultez la première page de la revue dans laquelle son article a été publié afin de trouver ses coordonnées. Si vous n’arrivez pas à les repérer, communiquez avec nous à PublicationsArchive-ArchivesPublications@nrc-cnrc.gc.ca.
Questions? Contact the NRC Publications Archive team at
PublicationsArchive-ArchivesPublications@nrc-cnrc.gc.ca. If you wish to email the authors directly, please see the first page of the publication for their contact information.
NRC Publications Archive
Archives des publications du CNRC
This publication could be one of several versions: author’s original, accepted manuscript or the publisher’s version. / La version de cette publication peut être l’une des suivantes : la version prépublication de l’auteur, la version acceptée du manuscrit ou la version de l’éditeur.
Access and use of this website and the material on it are subject to the Terms and Conditions set forth at
Frost heave prediction of chilled pipelines buried in unfrozen soils
Konrad, J. M..; Morgenstern, N. R.
https://publications-cnrc.canada.ca/fra/droits
L’accès à ce site Web et l’utilisation de son contenu sont assujettis aux conditions présentées dans le site LISEZ CES CONDITIONS ATTENTIVEMENT AVANT D’UTILISER CE SITE WEB.
NRC Publications Record / Notice d'Archives des publications de CNRC:
https://nrc-publications.canada.ca/eng/view/object/?id=2b008fb4-e025-4383-9135-98227a7a4e4f https://publications-cnrc.canada.ca/fra/voir/objet/?id=2b008fb4-e025-4383-9135-98227a7a4e4fSer
T n
1% 38
N21d
National Research Consell national0.
1344
I*
council-,--
1
C. 2 Division of Division desB69G
1 Building Research recherches en MtimentFrost
Heave Prediction of Chilled Pipelines
Buried
In Unfrozen Soils
by J.-M. Konrad and N.R. Morgenstern
Reprinted from
Canadian Geotechnical Journal Volume 21, No. 1, February 1984 p. 100-115 (DBR Paper No. 1344) Price $2.00 NRCC 25271
WDG., R E .
L I B R A R Y
T h i s p a p e r , w h i l e b e i n g d i s t r i b u t e d i n r e p r i n t form by t h e D i v i s i o n of B u i l d i n g R e s e a r c h , remains t h e c o p y r i g h t of t h e o r i g i n a l p u b l i s h e r . It s h o u l d n o t be r e p r o d u c e d i n whole o r i n p a r t w i t h o u t t h e p e r m i s s i o n of t h e p u b l i s h e r . A l i s t of a l l p u b l i c a t i o n s a v a i l a b l e from t h e D i v i s i o n may be o b t a i n e d by w r i t i n g t o t h e P u b l i c a t i o n s S e c t i o n , D i v i s i o n of B u i l d i n g R e s e a r c h , N a t i o n a l R e s e a r c h C o u n c i l of C a n a d a , O t t a w a , O n t a r i o ,
KIA
0R6.Ce document e s t distribui! SOUS forme de
t i r s - a - p a r t par 1 - n * u + = i n n des r e c h e r c h e s - - en b a t i m e n t . s o n t t o u t e f o i , o r i g i n a l
.
r e p r o d u i t en consentement r -.-
- .. Une l i s t e d p e u t G t r e o d e s p u b l i c a e n b a t i m e n t Canada, O t t ,Frost heave prediction of chilled pipelines buried in unfrozen soils
J.-M. KONRADDivision of Building Research, National Research Council Canada, Ottawa, Ont., Canada KIA OR6
AND
N. R. MORGENSTERN
Department of Civil Engineering, The University of Alberta, Edmonton, Alta., Canada T6G 2G7
Received December 20, 1982 Accepted September 26, 1983
Frost heave is an important consideration in the design of buried chilled pipelines. A procedure for calculating the amount of heave under a chilled gas pipeline is presented based on a finite-difference formulation of the heat and mass transfer in saturated soils. The frost heave of the soil is characterized in terms of the segregation potential concept developed in earlier papers by the authors. Good agreement is found between the predictions of heave obtained with this procedure and that observed in long-term full-scale experiments at a test site in Calgary, Canada. Additional calculations are presented to explore the influence of pipeline temperature, pipe insulation, and ground temperature on frost heave of buried pipelines.
Le godement des sols dsultant du gel est un aspect important lors de la conception des gazoducs enfouis dans les sols et opkrant des tempkratures infkrieures ?I0°C. L'article prksente un modtle pour le calcul du soultvement de ces gazoducs fond6 sur une formulation en diffkrences finies du transfert de chaleur et de masse dans un sol saturk. La mkcanique du gonflement du sol est reprksentke A I'aide du concept du "potentiel de skgrkgation" dkveloppk par les auteurs dans des publications antkrieures. Le modtle permet de prkdire le soultvement de quatre gazoducs d'essais situts ti Calgary avec une prkcision satisfaisante pour I'ingknieur sur une @node relativement longue d'environ 10 annkes. Le modtle est ensuite utilisk pour kvaluer l'influence de la temptrature des gazoducs, de I'isolation autour des conduites et de la tempkrature du sol sur le soukvement des conduites. Can. Geotech. J. 21, 100-115 (1984)
Introduction
Burying a chilled gas pipeline in permafrost preserves the frozen state, prevents undue thermal degradation, and thereby resolves most of the problems associated with pipeline operation in ice-rich ground. However, where the pipeline passes through unfrozen soil, the ground around the pipe freezes. Because of the presence of fine-grained soil along the right-of-way, the potential for frost heaving may exist for many kilometres of a pipeline route. Two important new design considera- tions arise under these conditions. First, how much frost heave will occur over the lifetime of the project? Second, how much differential heave will occur and will it lead to unacceptable strains in the pipe? For example, where the pipeline crosses from frozen to unfrozen and back to frozen ground, it will be restrained from heaving where it is buried in frozen soil but will be subjected to heave across the unfrozen soil. Can this differential heave lead to distress?
Frost action in soils has received considerable attention in the literature. It is well known that frost heave is not only caused by freezing of in-situ pore water but also by water flow to a freezing front. This water flow is induced by a suction gradient that develops in the frozeq soil. Although considerable research has been devoted to the frost heave process, there has been no general agreement on an engineering theory that would allow prediction of the amount and rate of frost heave as
a function of the soil type, applied load, and boundary conditions.
This paper proposes a basis for calculating the amount of heave under a chilled gas pipeline based on a finite-difference formulation of the heat and mass transfer in saturated soils. The frost heave concepts used in the modelling have been established previously by Konrad and Morgenstern (1980,198 1,1982) and will be summarized briefly below. The model is used to evaluate and predict the results of a field test program in Calgary reported by Slusarchuk et al. (1978). The Calgary test facility consists of four 120cm pipe test sections buried in a frost-susceptible silt. These pipeline sections have been in operation since 1974 and maintained at a temperature of -8.5"C. Finally, the frost heave analysis will be used to evaluate certain aspects of the design of a chilled gas pipeline particularly with respect to the effect of pipe insulation and variations in pipe operating temperature and in-ground temperature on frost heaving.
The frozen fringe in freezing soils
In a fine-grained soil, not all of the water within the soil pores freezes at 0°C. In some clays, up to 50% of the moisture may exist as a liquid at -2OC. This unfrozen water is mobile and can migrate under the action of a suction gradient. The characteristics of unfrozen water in frozen soils have been reviewed by Anderson and
KONRAD AND MORGENSTERN 101 Morgenstern (1973) and Tsytovich (1975). Clear
evidence of mass transport through a frozen zone underneath an ice lens was given by Dirksen and Miller (1966) and Hoekstra (1966). This led Miller (1972) to propose that an ice lens in a freezing soil grows somewhere in the frozen soil, slightly behind the frost front, i.e., the warmest isotherm at which ice can exist in
'
the soil pores. This temperature depends mainly upon pore size, applied pressure, and solute concentration. In,
silty soils, the average pore size is relatively large and the frost front is then close to the 0°C isotherm. The temperature at the base of the ice lens (or freezing front) is referred to here as the segregation-freezing tempera- ture, T,, because the segregational heaving process takes place at that isotherm. The frozen soil between the frost front and the freezing front is called the frozen fringe. Direct evidence for the existence of a frozen fringe has been published by Loch and Kay (1978) and Konrad and Morgenstern (1982b). In addition to these considerations, Hoekstra (1 969) and Mageau and Morgenstern (1979) published experimental data indi- cating that the suction developed in the frozen soil on the cold side of the warmest ice lens (or freezing front) had little to no effect on the rate of water migration to that lens. That is, an ice lens acts like a cutoff with regard to water flow.Assuming full saturation and incompressibility of the soil skeleton, it appears that the mechanics of frost heave can be regarded as a problem of impeded drainage in a
'
two-layered system to an ice-water interface that existsat the freezing front (T, isotherm). Substantial suctions are generated at this interface but the frozen fringe is the major source of resistance to water flow to the segregation front due to its low permeability (Konrad and Morgenstern 1980). Consequently, frost heave characteristics of a freezing soil should be related to the characteristics of the frozen fringe. We have taken the view that precise point measurements of permeability, temperature, and suction within the frozen fringe would not ultimately be of direct value in a predictive theory; instead, unique and overall frozen fringe characteristics of a given soil should be deducible from controlled laboratory freezing tests and these frost heave character- istics should constitute input parameters to a general theoretical formulation of simultaneous heat and mass transfer.
I
Soil freezing characteristics from laboratory testsKonrad and Morgenstern (1980, 1981, 1982) demon- strated that representative parameters can be obtained in the laboratory without detailed measurements at the
for various applied surcharges on about 10 cm diameter and 10 cm high soil samples. Temperature profiles were obtained throughout the test by means of thermistors installed in the cell wall. Water intake or expulsion and heave were monitored with time.
Two distinct phases of frost heave may be recognized for this type of freezing test: frost heave during an advancing frost front created by a positive net heat extraction rate; frost heave corresponding to the growth of the final ice lens initiated at maximum frost front penetration.
During the advancing frost front phase or transient freezing, Konrad and Morgenstern ( 1 9 8 2 ~ ) demon- strated that a given freezing soil can be characterized either by its segregation-freezing temperature, T,, and the overall permeability of the frozen fringe, K ~ , or by its segregation potential, SP (Fig. 1). The segregation potential, itself explicable in terms of detailed character- istics of the frozen fringe (T,, K ~ ) , is readily obtained from the laboratory tests, as it is the ratio of the water intake flux and the overall temperature gradient in the frozen soil near the frost front. Furthermore, SP constitutes the necessary coupling parameter between heat and mass flow required to predict frost heave. These parameters of the freezing soils are dependent upon applied pressure at the freezing front, P,, suction at the frost front, P,, and rate of cooling of the current frozen fringe, Tf. The rate of cooling during transient freezing, related to the degree of thermal imbalance
T, T, T, : @C
r
I TEMPERATURE
a1 CONDITIONS ASSOCIATED WITH THE FROZEN FRINGE
scale of the frozen fringe. This section summarizes the TEMPERATURE UNFROZEN WATER PERMEABILITY m o u CONTENT
results of the laboratory freezing program.
One-dimensional freezing tests with fixed cold and
"
c"""cT""""o''"'F"""'"'R1"'CAN. GEOTECH. I . VOL. 21. 1984
FIG. 2. Cooling of the frozen fringe during transient freezing.
within the soil, is defined here as the change in average temperature of the frozen fringe per unit time and can be approximated by the change of temperature per unit time at the 0°C isotherm (Fig. 2) using the following relationship:
where ATi is the change in temperature during a time step At = 1 at the level of the frost front at time t; grad T is the temperature gradient, and AX is the advance of the frost front per unit time.
A unique frost heave characteristic surface (SP, P,, &) for a given applied pressure can be determined for a given soil from controlled freezing tests. By fitting functions to the experimental relations between SP and
P,, at different rates of cooling and providing interpola-
tion procedures, the surface shown in Fig. 3 was used to characterize mass transfer in freezing Devon silt (Konrad and Morgenstern 1982a) for zero applied load. The frost heave model using the previous input predicted the observed behaviour of all the freezing tests conducted in this investigation remarkably well. It has also been demonstrated that these frost heave concepts established for Devon silt can be extended to any fine-grained soil
It has been known for a long time that applied pressure inhibits frost heave. The influence of pressure can be explained in terms of stress-induced changes in unfrozen water content within the frozen soil. This in turn affects
FIG. 3. Characteristic frost heave surface for Devon silt used for laboratory freezing tests simulation (no applied load). the segregation-freezing temperature and the overall permeability of the frozen fringe, and hence SP. Konrad and Morgenstern (1982b) established that the segrega- tion-freezing temperature of a given soil becomes colder with increasing applied pressures. At the formation of the final ice lens (i.e., end of transient freezing) a simple expression was found to fit experimental results:
where Ts is the temperature ("C) of the freezing front for an applied pressure P,, Tso is the temperature ("C) of the freezing front for zero surcharge, and A is a constant.
Experimental data also showed that the average permeability of the frozen fringe decreases with increasing applied surcharge and may be fitted by (Konrad and Morgenstern 1982b):
where
K~
is the permeability of the frozen fringe at a given surcharge P,,Kf0
is the permeability for zero applied load, and B is a constant.In freezing tests with applied surcharge, it has been observed, both by the authors and others, that water may be first expelled from the sample but later attracted to the freezing front. Konrad and Morgenstern (1982b) established that expulsion of water occurs only during the advancing frost front phase. Moreover, it is a
KONRAD AND MORGENSTERN 103
APPLIED PRESSURE, MPa
FIG. 4. The segregation potential of Devon silt for field
,
conditions.i
function of applied pressure and rate of cooling of the frozen fringe. When the rate of cooling is close to zero, i.e., close to thermal steady state, water is always attracted to the freezing front, provided that the applied pressure is smaller than the real "shutoff" pressure for which no water flow to the ice lens is possible. For fine- grained soil, this shutoff pressure is too high to be of interest for practical applications.
Figure 4 shows the experimental relationship between SP and applied pressure (for Devon silt) for the case of atmospheric pressure at the frost front (i.e. ,.P, = 0) and at the formation of the final ice lens (i.e., Tf = 0). This relationship is readily expressed by:
where SP, is obtained for zero applied pressure and a is a constant.
, Konrad and Morgenstern (1983) presented the results I of a literature survey on well-documented cases of frost
heave data that give strong support for the general validity of [4].
Soil freezing characteristics for field conditions Labo~atory studies have shown that the rate of frost heave, h,, in a freezing soil can be calculated as: [5]
h,
= 1 . 0 9 ~ = SP(P,, P,, f f ).
grad TfTo successfully predict frost heave in the field using [5], SP must be determined frop tests using representa- tive values of P,, P,, and Tf. Evaluation of these parameters appears, at first sight, to require a substantial number of tests and this might seem to be a serious limitation on the practical use of the frost heave model that has been developed. These problems can be overcome by seeking an upper-bound value to frost heave and by considering the following simplifications in- herent in field freezing conditions.
In the field, frost penetration rates are usually small
(for example, in Fig. 9 they are about 0.02 cm/h over the first 100 days of freezing and only about 0.008 cm/h after 400 days). The actual average temperature gradients in the frozen zone near the frost front are also small, say ranging from approximately O.OTC/cm to q.OTC/cm. Because [I] results in an extremely small Tf (field), about 0.0015"C/h or less, it is argued that SP (field) may be approximated by the SP obtained at the formation of the final ice lens using freezing tests with constant temperature boundary conditions. Experiments on Devon silt have shown that the final ice lens was initiated when the rate of cooling was approximately O.Ol°C/h. This approximation, however, does not im- ply that a single ice lens is growing "in situ." Because the frost front is not stationary, several ice lenses may form.
The segregation potential decreases with increasing suctions at the frost front (Komad and Morgenstern 198 1). Therefore, an upper-bound of frost heave can be computed for the case where P, is very small. In a laboratory test this would correspond to a warm plate temperature close to 0°C to ensure small values of P, since the length of unfrozen soil at the formation of the final ice lens would be very small. This assumption is not too conservative, because in many field freezing conditions P, is usually small owing to high mass permeability of the unfrozen soil and small water migration rates. The upper-bound solution also assumes that water is abundantly available at the freezing front. If the soil is unsaturated, the rate of frost heave is considerably reduced.
In the field, the influence of overburden cannot be neglected. The effect of overburden becomes even more important if additional loading from berms or other types of surcharges are introduced. From the previous labora- tory studies and considering that an upper-bound to frost heave is obtained by neglecting transient cooling of the frozen fringe and assuming zero suction at the frost front, the field frost heave characteristics of a given soil simply reduce to:
IT, = (T,,(
+
AP,
and&
=Kf0
edBPe or [61SP = SP, e d e
where the subscript o refers to freezing under no applied load.
It appears, therefore, that only a limited number of well-controlled freezing tests may be required to adequately characterize the segregation potential of
homogeneous soil in the field over a wide range of overburden pressures. In practice, three freezing tests using constant temperature boundary conditions and different applied surcharges covering the expected range in the field suffice to define the field frost heave
104 CAN. GEOTECH. 1. VOL. 21, 1984
characteristics. One should ensure a warm plate temperature close to 0°C (say +l°C) and enough freezing time to grow the final ice lens. By using cold step temperatures of about -5 to -8°C and about 10 cm high samples, the time required to reach the maximum frost front penetration and hence the final ice lens growth is relatively short (less than 1 day). Therefore, the field frost heave characteristics of any soil, using undisturbed or reconstituted samples, can be obtained in less than 4 days using a single freezing cell.
A simple frost heave model for freezing around a chilled pipe
Frost heave during an advancing frost front
Frost heave results from a complex interaction between heat and mass transfer in freezing soils. Fourier's general equation is widely used to model heat transfer in freezing ground when conduction dominates. Appreciable simplifications are achieved by assuming that the thermal properties of frozen soil are independent of the temperature and there is no convective heat transfer. Moreover, the amount of unfrozen water remaining in the frozen soil is lumped at the frost front by a dimensionless parameter. Although these param- eters influence slightly the position of the 0°C isotherm and the rate of frost penetration, realistic predictions of frost heave depend on the accuracy of mass transfer modelling, i.e., the use of adequate parameters charac- terizing the segregational process in freezing soil.
The heat and mass transfer for the case of freezing around a buried pipe should be formulated in two- dimensional space. Furthermore, ambient air tempera- ture variations with time should also be taken into account in order to simulate ground temperature variations around the pipe. This may render the mathematical formulation of the problem too sophisti- cated for many engineering purposes. As the direction of ice lensing is always perpendicular to the heat flow, pipe heave will result essentially from ice formation in a sector beneath the pipe. Thus, it is convenient to approximate the temperature distribution beneath the centre line of the pipe by a simplified model that assumes radial heat flow. Furthermore, air temperature variations will be neglected in the following but could be considered with ease in a more comprehensive analysis. The general nondimensional form of the equation of transient heat flow in cylindrical polar coordinates (r,O,z) reduces to the two-dimensional equation for the case where the temperature, T, is independent of z:
1 dT
-
d 2 ~ 1 d T 1 d 2 ~ [7]----+--+--
a dt d? r d r
3
do2where a is the thermal diffusivity of the medium. The sector beneath the pipe shown in Fig. 5 is one of circular
symmetry along the centre line which results in d 2 ~ / d 0 2 = 0, and [7] simplifies to
1
Equation [8] holds independently in the frozen soil and in the unfrozen soil. Both continuity of temperature 1
and heat flux must be satisfied at each boundary. For the case of radial heat flow beneath the pipe, the following temperature boundary conditions are considered:
1
IT = Tc for r = ro
T = Ti = 0°C for r = ro
+
X(t) [9] dT/dr = 0 at large depth forr = ro
+
X(t)+
Z(t)i
where Tc is the cold side temperature or pipe tempera- ture, ro is the radius of the pipe, X(t) is the thickness of the frozen soil at time t, and Z(t) is the thickness of the unfrozen soil at time t.In freezing saturated soils, internal heat created by the phase change of the water is liberated at two locations: at the base of the warmest ice lens where the migratory water freezes with a heat release equal to vL, and at the frozen-unfrozen interface where the pore water freezes as the frost front advances with a heat generation equal to ~nL(dX/dt). For simplicity, the latter heat generation is lumped to the 0°C isotherm.
The continuity of heat flux can readily be expressed at the 0°C isotherm per unit area as
where k is the thermal conductivity, v is the water migration rate, dT/dr is the temperature gradient (the subscripts f and u refer, respectively, to frozen and unfrozen), E is a dimensionless factor taking into
account the proportion of water remaining unfrozen in the frozen soil, n is the porosity of the unfrozen soil, L is the latent heat of freezing of water, and dX/dt is the rate of frost front penetration.
The heat-conduction equations are solved numeric- ally using the finite-difference scheme proposed by Crank and Nicholson (1947). The moving boundary condition associated with the penetration of the frost front is accounted for by a supplementary node at the frozen-unfrozen interface. As illustrated in Fig. 5, the nodes are unequally spaced in the frozen zone because of frost heave and equally spaced in the unfrozen soil. The details of the finite difference formulation are given by K o ~ a d (1 980).
Total frost heave is the combination of the segrega- tional heave, h,, and the amount of heave, hi, arising from the expansion of in-situ pore water during
KONRAD AND MORGENSTERN ORIGINAL POSITION COUPLING I OF PIPE i t \ I SOIL 1 .
- -
=- af d t d~ r dr WARMEST 'I: :- FROZEN F R I N G E 'dT v ( t l = SP (P,). (- ) T (t, r = r, + X ( t l l = Ti 1 09C dr f FROST FRONTFIG. 5. Equations for the field frost heave model under a pipeline considering radial heat flow. freezing. For a time interval, At, incremental total frost
heave is obtained from:
According to an earlier paper by Konrad and Morgenstern (1980), the water flux, v, to the freezing front may be calculated for each time step using Darcy's
1
law in the frozen fringe with the following equation:1
wherePw 1 L T,*
vi
=-=-[-In-+-Pe YW YW v w To* v w
I
is the Clausius-Clapeyron equation. It represents the suction potential at the base of the warmest ice lens. Here
T,*
is the segregation-freezing temperature in K and is obtained from [5]; To* is the temperature of the freezing point of pure water in K; yw is the unit weight of water; and Vw and Vi are, respectively, the specific volume of water and ice. In [12] Kf is the overall permeability ofthe frozen fringe obtained from [6] and d is the length of the frozen fringe which can be computed from d =
T,/grad Tf.
Alternatively, the water flux, v, to the freezing front may also be obtained using the segregation potential of the freezing soil (eq. [6]) from:
[13] v = Spagrad Tf
Since the frost heave parameters, T,, Kf, and SP, are dependent upon applied pressure, the model evaluates the pressure at the freezing front as follows:
where Po, is the initial overburden pressure, yf is the unit weight of the frozen soil of thickness X(t), and Pad is an additional pressure.
The additional pressure must be introduced when the surcharge i s increased during the freezing process, either by the placement of a berm above the pipe or by restraining loads applied by means of hydraulic jacks and reaction piles. Moreover. Pad is a function of time
106 CAN. GEOTECH, 1. VOL. 21, 1984 5). The present analysis does not take into consideration
the resistance to upward motion of the frozen bulb. Since SP decreases with increasing pressure, this simplification results in a conservative frost heave prediction.
For many soils (silty sands to sandy silts), field freezing conditions result in suctions at the frozen-un- frozen interface small enough to ignore and the previous equations for water flow are applicable. However, for clays, significant suctions at the frozen-unfrozen interface may exist as a consequence of the relatively low permeability of clays. Equation [12] should, therefore, be rewritten for a two-layered medium composed of the frozen fringe and the unfrozen soil (Konrad and Morgenstern 1980). Obviously, for accu- racy the frost heave characteristics of the frozen fringe should correspond to the range of the actual suctions at the frost front in the field.
Frost heave during a "quasi" stationaryfrost front The pipeline proposed to carry chilled gas from northern Canada and Alaska to southern markets, once built, may operate for tens of years. Therefore, sufficient time for transient freezing (i.e., advancing frost front) to be completed is available and it is of particular interest to develop a frost heave model when the frost front does not penetrate further into the un- frozen soil.
Experimental data given by Konrad and Morgenstern (1980) show that if the heat extraction rate is not maintained artificially constant during the growth of the final ice lens, the heave rate decays monotonically with time and frost heave will ultimately stop. Komad (1980) established that this was related to the warming of the
base of the final ice lens as the height of the samples
increases with time because of ice lens growth. When the frost front is stable, the rate of heaving of the final ice lens is solely a function ~f the current heat
deficit existing at the segregation front. Frost heave prediction is, therefore, obtained from:
where the temperature gradients on each side of the freezing front are obtained from the steady state temperature distribution around a cylindrical heat source in which the geometrical boundary conditions vary with time as the ice lens grows thicker.
For saturated soils, the ultimate heave is obtained when the suction at the base of the warmest ice lens reaches zero. By setting
P,
= 0 in the Clausius-Cla- peyron equation (eq. [12]), one readily obtains the temperature,T,
("C),
for which the pressure in the liquid film beneath the ice lens is atmospheric, as a function ofapplied pressure:
Description of the Calgary test facility
1
In order to study the effects of a chilled gas pipeline ,
buried in a frost susceptible soil, a frost heave project was undertaken in Calgary by Northern Engineering
I
Services Co. Ltd. (N.E.S.) for Canadian Arctic Gas Study Limited. This program involved a field test facility, a laboratory testing program, and model pipeline studies. The results of these full-scale tests are given by Slusarchuk et al. (1978) and Carlson et al. (1981); detailed laboratory data can be obtained from the interim report presented by Northern Engineering Services (1975).Site conditions
A site was selected in the University of Calgary area which was characterized by an upper soil strata (8 m) of frost susceptible nature and a high water table ensuring a ready supply of water to the freezing front.
The moisture content of the test facility soil varied between 18 and 22% and the plastic limit between 14 and 18% with a liquid limit of 24-31%. Grain size distributions were determined from samples taken at different depths and showed that, in general, the soil contained 13% sand sizes, 64% silt, and 23% clay sizes. The depth to the free groundwater table was moni- tored in open standpipes and in August 1973 was found to lie between 2.3 and 2.6 m below original ground surface. The results of in-situ field permeability tests indicated that the Darcy coefficient of permeability was between 0.6 X 1 p and 1.0 x l p c m / s . Visual in- spection of undisturbed Shelby tube samples indicated that a number of fissures were present in the soil. Description of test facility
The main objectives of the field test facility were to monitor the performance of a chilled pipeline buried in unfrozen soil, to determine the effect of increasing overburden pressures in reducing frost heave, and to examine the effects of replacing some of the frost susceptible soil beneath the pipe with non-frost suscepti- ble gravel. Therefore, four separate sections using
1.20 m diameter pipe, each 12.2 m long, were buried under different conditions at the test facility. These conditions were represented by the control, deep burial, restrained, and gravel sections. At the control section, the pipe was buried 0.75 m below nominal ground surface. This represented the minimum "normal" burial situation and was taken to be the base condition with which the other test sections were compared. The pipe at the deep burial section was placed 1.70m below nominal ground surface, in order to study the effect of
KONRAD AND MORGENSTERN 107
BEAM AND JACK I I
RESTRhINT nssCfdaLY,
I TO REACTION 4
C O N T R O L S E C T I O N 'ILE RESTAATNED SECTION
8m TRENCH 1 m DEEPER ' TRENCHOVEREXCAVATED L B Y i m AND BACKFILLED WITH GRAVEL I 1 I I I t NES 119751
-
G R A V E L SECTION D E E P B U R I A L S E C T I O N FIG. 6. Schematic view of test sections after Slusarchuk erA PENNER AND-VEDA (1977)
-
w - LO c I I I I I I 0 0 0.04 0.08 0.12 0 16 0.20 0.24 0.28 APPLIED PRESSURE. M h SP = SP,, e*Pe @ sPO = 3 W r mm2/lr PC1 SEGREGATION POTENTIALUSED I N THE
8
SPo = 230 x mmZ/(r ."C1 FROST HEAVE MODEL @SP, = 180 x 10.5 mm2/lr .OCI
al. (1978).
additional overburden pressures on heave rate. At the restrained section, the pipe was buried 0.75 m below nominal ground surface and loading of the pipe through
, the restraint beam was achieved using two hydraulic
jacks (it is important to note that the restraint was a
,
constant loading restraint and not a "no displacement" restraint). At the gravel section the pipe was buried 0.75 m below nominal ground surface, but the trench was dug 1 m deeper and backfilled with gravel. Cross sections of the four test pipeline sections are shown on Fig. 6.The pipe temperature in all sections was maintained at -8.5"C for about 7 years and the facility is still operating. The chilled air began to circulate through the buried pipe sections on March 30, 1974.
Temperatures, vertical displacements (heave), and pore water pressures were measured in the ground around the freezing pipe.
Calgary silt freezing characteristics from laboratory tests
Northern Engineering Services (1975) conducted a
'
series of laboratory freezing tests on undisturbed Cal- gary silt samples. Frost heave, amount of water flowing into or out of the samples, and temperature distribution
I were measured for various applied surcharges.
I
The samples were frozen with a constant cold side step temperature, but the warm side temperature was not always well controlled and sometimes decreased con- tinuously as the frost front penetrated into the sample.FIG. 7. Segregation potential of Calgary silt from laboratory freezing tests.
Furthermore, in many tests the freezing period was too short (frost front not stationary) and thus the tests were characterized by water expulsion. When freezing occurs in fine-grained soils under an externally applied load, water may be first expelled from the freezing front but later it will always be attracted into the sample. Konrad and Morgenstern (1982b) established that water attrac- tion is a function of both applied pressure and rate of cooling of the frozen fringe: the higher the applied load, the smaller the rate of cooling at which water will flow into the soil specimen. Therefore, in order to obtain the freezing characteristics of Calgary silt with a fair degree of confidence using the N.E.S. investigation, only tests in which stationary frost fronts were reached have been considered in the present analysis.
Figure 7 presents the results of the analysis of N.E.S. tests expressed in terms of the segregation potential at the formation of the final ice lens or near it. The suction at the frost front has been calculated for each test using Darcy's law and was found to be less than 5 kPa. It is argued, therefore, that the calculated freezing param- eter, SP, corresponds actually to the case where P,, suction at the frost front, is close to zero. SP for each test is readily obtained by dividing the measured water
intake velocity by the overall temperature gradient in the frozen soil near the 0°C isotherm. Furthermore, SP has also been calculated using the measured frost heave rate corrected for in-situ pore water freezing. Both values of SP were consistent for all the tests reported in Fig. 7.
Penner and Ueda (1977) and Ueda and Penner (1977) performed frost heave tests using Calgary silt sampled at
108 CAN. GEOTECH. J. VOL. 21. 1984
two different locations, containing 17 and 30% clay size particles, respectively. The segregation potential has been calculated using their results at the formation of the final ice lens (i.e., stationary frost front) and has been reported
in
Fig. 7. It is clear that Calgary silt with thehigher clay fraction is more frost susceptible than Calgary silt containing fewer clay size particles. It can
also be staled that the results obtained by N.E.S. (1975) that have been selected in our anaIysis are representative for Calgary silt. Furthermore, the appreciable scatter results mainly from variations in clay fraction in the different undisturbed soil samples obtained at the test site and to some extent also from variation in testing procedures.
It should also be stressed that the relationship between the segregation potential and applied pressure for Cal- gary silt is similar to that obtained for Devon silt (Konrad and Morgenstern 1982b) using well-controlled laboratory freezing tests. For Calgary silt, the mean value of frost heave characteristics is accounted for in a simple manner by the following equation:
[17] SP = SP, e-de
where SP, = 230 X 1W5 mm2/(s ."c) and a = 9.5 Mpa-' . In order to be used in the frost heave model and because of the significant scatter, the previous frost heave characteristics were bound by introducing in [17], SP,(max) = 300 x 1W5 mm2/(s."C) and SP,(min) = 180 X 1W5 mm2/(s "C), the parameter a remaining the same.
Comparison between prediction and field observations
At any time, the frost bulb around the buried pipes could be delineated from the ground temperature read- ings to an accuracy of about 10 cm. The movement of the frost bulb with time around the deep burial section is shown in Fig. 8. From the actual shape of the frost bulb it appears at first sight that the simplified model assuming radial heat flow in a sector beneath the centre line of the pipe will be adequate for engineering purposes.
The results of the model simulation, i.e., frost heave and frost penetration below the centre line of the pipe, will be compared to the observed data in order to confirm the fundamental concepts of frost heave mechanics put forward by the authors and to validate the field frost heave model and its engineering applicability .
The freezing conditions prevailing at each insbu-
mented section of the Calgary test site were simulated
using the field frost heave model presented previously.
The main input parameters necessary to solve the heat m s f e r fwmuiation were taken from the N.E.S. interim report (1975) and can be summarized as follows.
The average ground temperature was inferred from the thermistor readings and taken as +6S°C. The
HORIZONTAL SCALE. m
FIG. 8. Frost penetration around deep burial section after Slusarchuk et al. (1978).
condition of zero heat flux was applied at a depth of 15.6 m below the original positioi of the centre of the pipe. Parametric studies revealed that the temperature distribution in the upper part of the soil is not very sensitive to the location of the lower boundary for depths greater than 15 m.
The temperature in the pipes varied between
-
10 and -7°C with fluctuations in-ambient atmospheric tem- perature. A mean value of about -8.5"C was adopted for the simulation. Furthermore, during the first 50 days of freezing, the pipe temperature was assumed to decrease linearly from-
3.2 to-
8S°C, which closely represents the actual conditions.The thermal conductivities of the frozen soil and the unfrozen soil were taken, respectively, as 1.8 W/(m. "C) and 1.5 W /(m "C). The amount of unfrozen water remaining in the frozen soil was taken as 10% of the initial water content. Since the water table was at the same level or even higher than the base of the pipes, the soil was assumed to be fully saturated with a porosity of about 0.38.
Control section
As shown in Fig. 7 the data obtained from laboratory freezing tests on Calgary silt present some scatter. In
order to evaluate the influence of this scatter in SP on frost heave and frost penetration, the simulation of the control section was performed with the upper, mean, and lower values of the segregation potential determined from the laboratory tests (eq. [15]). The initial overbur- den pressure above the pipe in the field was estimated to be 11 kPa. After 400 days, a berm was placed on the top of the pipe, which increased the stress on the freezing bulb by approximately 6.4 kPa.
KONRAD AND MORGENSTERN 109
""
OERM r C ADDED /*-
. .- ROSlTlOM AT TIME t 0-0 FIELD DATA CROSS SECTION1
FIG. 9. Predictions and observations for the control section. frost heave model using as input the different values of the segregation potential of Calgary silt. An initial conclusion from these results is that the heat conduction problem has been adequately formulated with radial heat flow beneath the pipe, since the computed frost depth with time compares very well with the measured position of the 0°C isotherm. It is worthwhile to stress that the actual position of the frost front was determined by means of temperature measurements and that a check by drilling was also performed, which increases signifi- cantly the reliability of the field test results. In Slusar- chuk et al. (1978) the position of the frost front was given with respect to the pipe's base, which is a datum that varies with time as a result of frost heaving. In Fig. 9 the position of the frost front is taken with respect to the initial position of the base of the pipe. This has the advantage of recognizing readily the different phases of frost heave, i.e., one where the frost front advances and another one with a "quasi" stationary frost line. The thickness of the frozen soil at any time is obtained by adding both total heave and frost depth. The maximum frost penetration is approximately 2.3 m, which pro- duces a pressure at the freezing front at the end of transient freezing of about 52 kPa.Using the upper-bound value of the segregation potential of Calgary silt as input parameter results in a slightly smaller frost penetration than observed but in an overprediction of frost heave. Also, the time required to reach the maximum frost penetration is about 1300 days, which is significantly less than observed. With the lower-bound value of SP, the simulated frost penetration
is slightly deeper than the measured one and the predicted total heave at any time is smaller than the actual observations. Using the mean value of the segregation potential given by [16] yields the best approximation of both field frost heave and frost depth below the pipe. This parametric study reveals that frost heave is m&e sensitive to variations in SP than frost penetration. For instance, if the values of frost heave and frost depth computed with the mean value of SP are taken a; reference, a 20% increase in SP results in an increase in frost heave of 23% and a decrease in frost penetrations of lo%, whereas a decrease of 20% in SP produces only an 1 1 % reduction in frost heave and a 7% increase in the frost depth. These results are consistent with the fact that internal heat released at the freeezing front significantly affects the position of the 0°C isotherm. It is well known that high water intake rates retard the frost penetration, whereas the frost front advances faster with small water migration rates.
It is also expected that for an equal relative change in SP (positive or negative) different relative changes in frost heave will occur, since the thickness of the frozen soil influences significantly the temperature gradient near the 0°C isotherm in the case of radial heat flow. For a constant pipe temperature, higher temperature gra- dients near the frost front will be obtained for shallower frost penetration and induce higher frost heave rates according to [ l l ] . Furthermore, the relationship be- tween temperature gradient and thickness of frozen soil is not linear and thus accounts for the difference in frost heave variations.
This parametric study thus confirms that acceptable frost heave and frost penetration predictions were ob- tained with the field model for either the upper or lower bound values of the segregation potential of Calgary silt, the best simulation being obtained with the mean value of SP obtained from laboratory freezing tests. It is also encouraging that Nixon (1982) has successfully pre- dicted the heave of circular freezing tests using essen- tially the same model and data.
The frost heave model indicated also that the rate of cooling of the frozen fringe was less than O.Ol°C/h after about 40 days of freezing. This result justifies, there- fore, the use of freezing parameters corresponding to the formation of the final ice lens in laboratory freezing tests with fixed temperature boundary conditions.
Heave prediction for the deep burial, gravel, and restrained sections
It is now of benefit to apply the field frost heave model with the average freezing characteristics deduced from the laboratory testing in order to assess the amount of heave for the deep burial, gravel, and restrained sec- tions. In those three sections, the stresses at the freezing front are higher than those obtained in the control section
110 CAN. GEOTECH. J. VOL. 21, 1984 TIME. d w --'c-- --6
-
w = 230 ,-3.5 p. [FROSTMEAVf MmEL1 -0- F I E W DATA C ROBS SECT10FIG. 10. Predictions and observations for the deep burial section.
and are approximately 60- 150 kPa. This permits testing of the model over a wider stress range.
The initial overburden for the deep burial section is 18 kPa, for the gravel section 34 kPa, and for the restrained section 11 kPa. The loading history for the restrained section is given in Fig. 12. For both the gravel and the deep burial sections a surface berm has been added which increases the stress at the frost bulb by about 6.4 kPa after 400 days of freezing. The results of the simulation are summarized in Figs. 10-12 and compared with actual field measurements, which corre- spond to about 2000 days of freezing (Carlson et al.
1981).
Inspection of Figs. 10 and 11 demonstrates that the field frost heave model adequately predicts both total heave and frost penetration for the deep burial and gravel sections. At the restrained section (Fig. 12) the actual frost heave is about 75% of the predicted value and the actual frost depth is greater than the predicted one. If the simulation is performed with the lower limit of SP, the prediction is significantly improved. It should be noted that major differences in heave rate are observed for the first 200 days of freezing and that relatively good agreement is obtained thereafter. This may suggest variable soil conditions and high sensitivity of frost heave parameters to these conditions in the upper part of the soil. Furthermore, during the early stage of freezing, higher rates of cooling of the frozen fringe will also affect SP and therefore the heave rate. However, the
C
IFROST HEAVE MODECI-O-- FIELDO#TA
CROSS SECTION
FIG. 1 1 . Predictions and observations for the gravel section.
LOADING HISTORY am ul 0 ,6
-
0 TIME. d m o 600 low 1500 2000 TIME. days 0 WO 1WO 1500 2WO 0- I 1 I >.
.
w .2m iqs Pe-
-
180 sgs P* MODEL 0-0 FIELDDATA CROgs SECTION--
FIG. 12. Redictions and observations for the restrained
KONRAD AND MORGENSTERN 111 a;sumptions made in the frost heave model ( P , = 0 and
Tf = 0) will yield conservative results. Final remarks for the Calgary test site results
In the previous analysis, the pore pressure irnrnedi- ately beneath the frost front can also be calculated by assuming a given length of flow in intact unfrozen soil and its permeability. For the control section, the negative excess pore pressure beneath the frost line was calculated to be in the range of -0.8 to -0.2 kPa, assuming a wrmeabilitv of the intact unfrozen soil of about 1 6 5 cA/s. The fr&t heave model predicts that the negative pore pressures in the unfrozen soil decrease with frost penetration. Since the piezometers (Terra Tec Model P-1022) installed at the test site have an accuracy of 0.6 kPa, such small negative pore pressure changes could not be measured. This is consistent with the field observations reported by Slusarchuk et al. (1978).
The previous analysis also reveals that for the temperature conditions at the Calgary test site, an advancing frost front occurs for about 1500-2500 days and that a final ice lens will grow with a "quasi" stationary frost front.
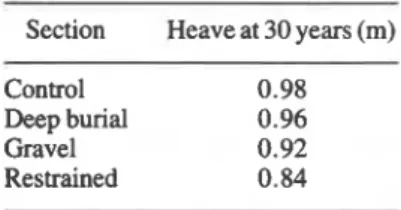
The application of the frost heave model to simulate the growth of the final ice lens for the temperature boundary conditions that remain constant with time yields the results summarized below (see eq. [lo]):
Section Heave at 30 years (m)
Control 0.98
Deep burial 0.96
Gravel 0.92
Restrained 0.84
Since the frost front is relatively shallow (52.5 m), the freezing system will be very sensitive to variations in thermal regime associated with changes in air temperatures. Therefore, it is expected that several ice lenses will form in the field. The previous figures are thought to represent an upper-bound of frost heave, since field data after 1980 have shown that the actual frost heave rate fluctuates in response to summer and winter temperatures. During the summer the measured frost heave rate is almost zero as the base of the temperature of growing ice lens warms up, which may even result in some thawing. This moderating effect is not taken into consideration in the frost heave simulation reported here.
I
Practical results for the design of a chilled gas pipe- line in discontinuous permafrost
The data analyzed from the Calgary test facility support the field frost heave model presented herein as
well as the general concept of frost heave mechanics recently put forward by Konrad and Morgenstern (1980, 1981, 1982). Additional support is given by Nixon (1982). It is now of value to use the field frost heave model to provide information for different environmen- tal conditions and on the utility of several design alternatives, as they might be used in a pipeline project. The effect of variations in pipeline freezing tempera- tures, ground temperatures, and pipeline insulation on frost heave will be analyzed in the following sections. Influence of pipeline temperature
Figure 13 illustrates the variation in total heave and frost penetration below the original position of the base of the pipe for different values of the pipeline tempera- ture. The initial ground temperature was taken as +2"C in order to simulate the conditions that might be found in southern discontinuous permafrost areas along a pipe-
line route. The for the freezing soil are given
by
WI.
Several consequences of altering the pipeline tem- perature can be noticed. Colder freezing temperatures result in higher total heave and larger frost penetration. The time required to attain the maximum frost front penetration increases with decreasing pipe freezing temperatures. For Tc =
-
1°C, the frost line will reach its maximum penetration after about 3 years, whereas for Tc =-
10°C the frost front will continue to advance even after 30 years of freezing.Figure 13 also reveals that the relationship between T, and total heave is not linear. A freezing temperature five times colder results in a heave only 1.35 times larger. This arises from the fact that drastic freezing temperature changes in the pipeline are associated with drastic changes in frost penetration but not in tempera- ture gradients in the frozen fringe as shown in Fig. 13. Since the thickness of the current fringe is related to the temperature gradient, and recalling [ l 11, which demon- strates that the water flux is more or less inversely proportional to the frozen fringe thickness, the previous results then readily follow.
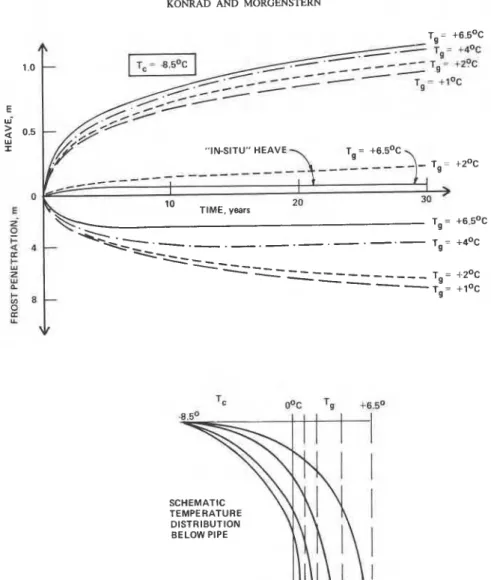
Influence of ground temperature
Figure 14 illustrates the variations in total heave and frost penetration below the original position of the pipeline base for different ground temperatures. The freezing temperature of the pipe is constant for all the simulated cases and is taken as
-
8.5"C. The parameters of the freezing soil have been slightly altered in order to study the sensitivity of total heave with respect to these parameters. For this analysis, SP, is equal to 175 X1 r 5 mm2/(s. O C ) .
The results presented in Fig. 14 warrant further explanation. The model predicts that the highest heave is obtained for the warmest ground temperature. This is
112 CAN. GEOTECH. I. VOL. 21. 1984 f i 0.8
-
TIME, years 10 20 30I
I>
-
-
-
-
-
T, = -l°C-
.
.
-
.
-
T,= -4OC 6 v T,= .lO°C Tc Tg oOc +zO -3 0 -4 -2 -1 INITIAL GROUND SCHEMATIC TEMPERATURE TEMPERATURE +Z°C DISTRIBUTION BELOW PIPET:
FIG. 13. Effect of various pipeline operation temperatures using the frost heave model.
contrary to the prediction by the model presented by penetrates deeper and takes longer to reach its maximum Hwang (1977) based on energy considerations for the depth. As indicated in Fig. 14, in-situ water freezing case of the upper-bound frost heave of a pipe. Hwang contributes more to the total heave in the case of a colder predicts that the colder the ground temperature, the ground temperature. This explains the fact that total higher the resulting frost heave. The present field frost heave is not that sensitive to ground temperature heave model predicts that the colder the ground tem- variations.
perature, the deeper the frost penetration into the
unfrozen soil. Therefore, if the pipe temperature is the InfIuence of pipe insulation
same in all cases, it is clear that the temperature gradient Figure 15 illustrates the effect of insulating the across the current fringe decreases with increasing pipeline. The selected ground temperature was +2"C depth. Hence, when the ground temperature decreases and the pipeline temperature -8.5"C. Frost heave was (Fig. 14), this in turn increases the length of the frozen calculated for different insulation thicknesses. The fringe with a concomitant decrease of the overall thermal conductivity of the insulation, A,,,, was consi- hydraulic gradient, which reduces water flux to the dered to be 10 times smaller than that of the frozen soil. freezing front and, hence, total heave. A 5 cm thick insulation reduces total heave by about It should also be emphasized that the applied pres- 20%, whereas a 15 cm thick insulation reduces total sures at the freezing front increase with depth. There- heave by approximately 45%. Conversely, the frost fore, low pressures are associated with warmer ground penetration is also reduced with increasing thickness of temperature, whereas higher pressures at the freezing the insulation.
front develop with colder ground temperature, thus also Soil-pipeline interaction
affecting heave rate. One of the main objectives of the research program on For colder ground temperatures, the frost front frost heave mechanics was to establish fundamental
KONRAD AND MORGENSTERN 1 .o E w-
5
0.5 I "IN-SITU" HEAVE 0 E 2 0 I- 4 4 . . .-.-.- T = +4OC 0: 9 I- UI 2 w---
Tg= +z°C L---
t; 8 T 9 = +l°Cz
u DISTRIBUTION BELOW PIPEFIG. 14. E f f e c t o f v a r i o u s ground temperatures u s i n g t h e frost h e a v e m o d e l . frost heave parameters of soils in order to develop a
procedure for forecasting the heave of a chilled buried gas pipeline, under both unrestrained and restrained conditions. The examples cited previously demonstrate that unrestrained heave is predicted in a reasonable
)
manner. Restrained heave may also be predicted by calculating the normal stress required to deform dif- ferentially the pipeline encased in frozen soil. This stress can then be used as an externally applied stress in the frost heave calculation to moderate the predicted heave. In this way, an iterative solution can be developed for soil-structure interaction analyses of differential frost heave. Guidance in these calculations is given by Nixon et al. (1983).Conclusion
During freezing of small soil specimens in the laboratory, substantial variations in the rate of cooling of
the frozen fringe and of the suction at the frost front (frozen-unfrozen interface) occur, leading to important variations in the segregation potential of the soil.
Contrary to this, these parameters do not vary significantly during field freezing; this is partly because
of h e larger scaIe of field conditions resulting in
relatively small temperature gradients and thus in small rates of cooling of the frozen fringe, and partly because
of a higher mass permeability of the unfrozen soil due to fissures, thus reducing the suction at the frost front. It has been shown by the present study that a realistic upper-bound to frost heave for field freezing conditions can be computed if the freezing characteristics of a fine-grained soil used as input correspond to those obtained from laboratory freezing tests, provided:
(1) the density of the soil sample used in the laboratory testing is essentially the same as that existing in the field;
114 CAN. GEOTECH. J. VOL. 21, 1984 f lNsu:NloN
-
= l o Tc = -8.5OC ins Tg = +2.0°C e - 0 crn . - e = 5 c m---
---
* = l 5 c r n 20 m - ->
ELAPSED TIME, years
---
--
e = 1 5 c r n-
. . . - .
-
* = 5 m-
v
r = O c mFIG. 15. Effect of pipeline insulation using the frost heave model. (2) the freezing characteristics reflect the conditions at
the onset of the formation of the final ice lens, i.e., a "quasi" stationary frost front;
(3) the suction at the frost front is relatively small. In a laboratory test this would correspond to a warm plate temperature close enough to 0°C to ensure a small length of unfrozen soil and, hence, small values of the suction at the frost front.
The freezing characteristics of a soil subjected to freezing in the field then reduce simply to a relationship between the segregation potential, SP, and the applied pressure at the freezing front given by
SP = SP, e - O P =
Both soil constants, SP, and a, can be obtained from controlled freezing tests with constant temperature boundary conditions. Furthermore, only a few tests are required to adequately define the previous relationship. The predictive power of the field frost heave model, in which the freezing soil is characterized by the previous relationship, has been shown through the successful detailed analysis of the performance, over several years, of the chilled pipeline sections at the test facility at Calgary, Alberta.
In conclusion, although many field problems are multidimensional, frost heave can be calculated very simply using the freezing characteristics obtained from
one-dimensional frost heave tests, provided that the thermal problem can be approximated either with an analytical solution or by using approximate numerical models.
Acknowledgements
This work has been supported in part by funds from the National Research Council of Canada. Dr. Konrad gratefully acknowledges the assistance provided by the Division of Building Research, National Research Council of Canada.
ANDERSON, D. M., and MORGENSTERN, N. R. 1973. Physics, chemistry and mechanics of frozen ground. Proceedings, 2nd International Conference on Permafrost, Yakutsk, U.S.S.R., pp. 257-288.
CARLSON, L. E., ELLWOOD, J. R., NIXON, J. F., and SLUSARCHUK, W. A. 1981. Field test results of operating a chilled, buried pipeline in frozen ground. Proceedings, 4th Canadian Permafrost Conference, Calgary, Alta., March 2-6, 1981.
CRANK, J., and NICHOLSON, P. 1947. A practical method for the numerical evaluation of solutions of partial differential equations of the heat conduction type. Proceedings of the Cambridge Philosophical Society, 43, pp. 50-67. DIRKSEN, C., and MILLER, R. D. 1966. Closed-system
freezing of unsaturated soil. Soil Science Society of America Proceedings, 30, pp. 168- 173.
KONRAD AND MORGENSTERN 115 HOEKSTRA, P. 1966. Moisture movement in soils under
temperature gradients with the cold side temperature below freezing. Water Resources Research, 2, pp. 24 1 -250.
1969. Water movement and freezing pressures. Soil Science Society of America Proceedings, 33, pp. 5 12-5 18. HWANG, C. T. 1977. Frost heave design of a chilled gas pipeline. 30th Canadian Geotechnical Conference, Saska- toon, Sask.
KONRAD, J.-M. 1980. Frost heave mechanics. Ph.D. thesis, Department of Civil Engineering, University of Alberta, Edmonton, Alta.
KONRAD, J.-M., and MORGENSTERN, N. R. 1980. A mech- anistic theory of ice lens formation in fine-grained soils. Canadian Geotechnical Journal, 17, pp. 473-486.
1981. The segregation potential of a freezing soil. Canadian Geotechnical Journal, 18, pp. 482-491.
1982a. Prediction of frost heave in the laboratory during transient freezing. Canadian Geotechnical Journal, 19, pp. 250-259.
1982b. Effects of applied pressure on freezing soils. Canadian Geotechnical Journal, 19, pp. 494-505.
1983. Frost susceptibility of soils in terms of their segregation potential. Proceedings, 4th International Con- ference on Permafrost, Fairbanks, Alaska, July 18-22,
1983.
LOCH, J. P. G., and KAY, B. D. 1978. Waterredistribution in partially frozen, saturated silt under several temperature gradients and overburden loads. Soil Science Society of America Journal, 42(3), pp. 400-406.
MAGEAU, D., and MORGENSTERN, N. R. 1979. Observations on moisture migration in frozen soils. Canadian Geotechnical Journal, 17, pp. 54-60.
MILLER, R. D. 1972. Freezing and heaving of saturated and unsaturated soils. Highway Research Record, No. 393, pp.
1-11.
NIXON, J. F. 1982. Field frost heave predictions using the segregation potential concept. Canadian Geotechnical Jour- nal, 19, pp. 526-529.
NIXON, J. F., MORGENSTERN, N. R., and REESOR, S. N. 1983. Frost heave - pipeline interaction using continuum mechan- ics. Canadian Geotechnical Journal, 20, pp. 25 1-26 1. NORTHERN ENGINEERING SERVICES. 1975. Interim report on
results from frost effects study. Unpublished.
PENNER, E., and UEDA, T. 1977. The dependence of frost heaving on load application. Proceedings, International Symposium on Frost Action in Soils, Lulea, Sweden, Vol. 1, pp. 92-101.
SLUSARCHUK, W., CLARK, J., NIXON, J. F., MORGENSTERN, N. R., and GASKIN, P. 1978. Field test results of a chilled pipeline buried in unfrozen ground. Proceedings, 3rd International Conference on Permafrost, Edmonton, Alta., pp. 878-890.
TSYTOVICH, N. A. 1975. The mechanics of frozen ground. McGraw-Hill Book Company, New York, NY.
UEDA, T., and PENNER, E. 1977. Mechanical analogy of a constant heave rate. Proceedings, International Symposium on Frost Action in Soils, Lulea, Sweden, Vol. 1, pp. 57-67.