HAL Id: hal-03213124
https://hal.inrae.fr/hal-03213124
Submitted on 30 Apr 2021
HAL is a multi-disciplinary open access
archive for the deposit and dissemination of
sci-entific research documents, whether they are
pub-lished or not. The documents may come from
teaching and research institutions in France or
abroad, or from public or private research centers.
L’archive ouverte pluridisciplinaire HAL, est
destinée au dépôt et à la diffusion de documents
scientifiques de niveau recherche, publiés ou non,
émanant des établissements d’enseignement et de
recherche français ou étrangers, des laboratoires
publics ou privés.
Cordeiro, Daniel Tomas, Ana-Paula Teixeira-Gomes, Valérie Labas, Elisabeth
Blesbois
To cite this version:
Anais Vitorino Carvalho, Soler Laura, Aurore Thélie, Isabelle Grasseau, Luiz Cordeiro, et al..
Pro-teomic Changes Associated With Sperm Fertilizing Ability in Meat-Type Roosters. Frontiers in
Cell and Developmental Biology, Frontiers media, 2021, 9, 15 p. �10.3389/fcell.2021.655866�.
�hal-03213124�
doi: 10.3389/fcell.2021.655866
Edited by: Silvina Perez-Martinez, CONICET Centro de Estudios Farmacológicos y Botánicos (CEFYBO), Argentina Reviewed by: Inmaculada Parrilla, University of Murcia, Spain Woo-Sung Kwon, Kyungpook National University, South Korea *Correspondence: Anaïs Vitorino Carvalho [email protected]
†These authors have contributed
equally to this work Specialty section: This article was submitted to Cell Growth and Division, a section of the journal Frontiers in Cell and Developmental Biology Received: 19 January 2021 Accepted: 03 March 2021 Published: 09 April 2021 Citation: Vitorino Carvalho A, Soler L, Thélie A, Grasseau I, Cordeiro L, Tomas D, Teixeira-Gomes A-P, Labas V and Blesblois E (2021) Proteomic Changes Associated With Sperm Fertilizing Ability in Meat-Type Roosters. Front. Cell Dev. Biol. 9:655866. doi: 10.3389/fcell.2021.655866
Proteomic Changes Associated With
Sperm Fertilizing Ability in Meat-Type
Roosters
Anaïs Vitorino Carvalho1*†, Laura Soler2†, Aurore Thélie1, Isabelle Grasseau1,
Luiz Cordeiro1, Daniel Tomas1,2,3, Ana-Paula Teixeira-Gomes3,4, Valérie Labas1,2,3and
Elisabeth Blesblois1
1CNRS, INRAE, Université de Tours, IFCE, Nouzilly, France,2INRAE, ENVT, INP-Purpan, UPS, UMR Toxalim, Toulouse,
France,3INRAE, Université de Tours, CHU de Tours, Plate-forme PIXANIM (Phénotypage par Imagerie in/ex vivo de l’Animal
à la Molécule), Nouzilly, France,4INRAE, ISP, Université de Tours, Nouzilly, France
The molecular basis of male fertility remains unclear, especially in chickens, where decades of genetic selection increased male fertility variability as a side effect. As transcription and translation are highly limited in sperm, proteins are key molecules defining their functionality, making proteomic approaches one of the most adequate methods to investigate sperm capacity. In this context, it is interesting to combine complementary proteomic approaches to maximize the identification of proteins related to sperm-fertilizing ability. In the present study, we aimed at identifying proteins related to fertility in meat-type roosters, showing fertility variability. Fertile roosters (fertility rates higher than 70% after artificial insemination) differed from subfertile roosters (fertility rates lower than 40%) in their sperm mass motility. Fertile and subfertile sperm protein contents were compared using two complementary label-free quantitative proteomic methods: Intact Cell MALDI-TOF-Mass Spectrometry and GeLC-MS/MS. Combining the two strategies, 57 proteins were identified as differentially abundant. Most of them were described for the first time as differentially abundant according to fertility in this species. These proteins were involved in various molecular pathways including flagellum integrity and movement, mitochondrial functions, sperm maturation, and storage in female tract as well as oocyte–sperm interaction. Collectively, our data improved our understanding of chicken sperm biology by revealing new actors involved in the complexity of male fertility that depends on multiple cell functions to reach optimal rates. This explains the inability of reductionist in vitro fertility testing in predicting male fertility and suggests that the use of a combination of markers is a promising approach.
Keywords: sperm, chicken, proteomic, fertility, semen
INTRODUCTION
Male fertility depends on the optimal functioning of all processes needed for sperm to fertilize the oocyte. The fertilizing ability of sperm is therefore reliant on the correct development and maturation of sperm cells including the acquisition of motility, structural integrity, viability, and its capacities to penetrate into the oocyte. Each aspect of these sperm functions are classically
investigated byin vitro tests to diagnose fertility perturbations (WHO, 2010). However, these tests results are poorly correlated within vivo male fertility in humans and in animals, suggesting the responsibility of more subtle dysfunctions of sperm biology (or putative combination of several suboptimal functions) in male subfertility, potentially revealed by molecular analysis (Soler et al., 2016a;Jodar et al., 2017).
Among the technical approaches available to investigate the molecular basis of male fertility, proteomics is particularly adequate (Kovac et al., 2013). Indeed, transcription and translation are very limited in mature sperm cells. Furthermore, proteins are considered as major effectors of cell functions (Jodar et al., 2017). Thus, sperm cell biology and activity are conditioned by the protein types, their abundance, and their posttranslational modifications at a given moment. Currently, mass spectrometry (MS)-based proteomics has been the most relevant approach to compare the sperm proteome from individuals with normal fertility and ones presenting difficulties to procreate in humans (Jodar et al., 2017;Bracke et al., 2018) and in animals (Park et al., 2013). Proteomic analysis of sperm cells provides two types of knowledge: on the one hand, global proteome analysis informs on the molecular pathways essential for sperm biology, and on the other hand, it helps identify potential male fertility biomarkers. These biomarkers are largely needed to predict the individual fertility capacity in human medicine (Jodar et al., 2017), animal reproduction (Druart et al., 2019), and genetic conservation programs of endangered breeds and species (Soler et al., 2020). Whereas each proteomic method provides a large amount of data and may propose potential biomarkers, due to the advantages and disadvantages of each methodology, a single approach cannot apprehend the complexities of male fertility. For instance, the Intact Cell MALDI-TOF Mass Spectrometry (ICM-MS) approach is a high-throughput methodology allowing the characterization of endogenous peptidoforms and proteoforms (<20 kDa) present in intact and whole cells without previous protein extraction or separation (Soler et al., 2020), at the difference of the bottom-up proteomic approach using a GeLC-MS/MS strategy allowing a larger overview of proteomes from extracted and digested protein samples.
Chicken is not only a popular laboratory model mainly for research on embryology, genetics, and behavior but also the first animal protein source for human consumption (FAO, 2020). Rooster fertility has decreased over the last decades in commercial breeds as a side effect of genetic selection especially for meat production (Rauw et al., 1998), but the molecular pathways involved in impaired sperm biology remain unclear. Previous investigations revealed that proteomic approaches applied to sperm cells are highly valuable to discriminate fertile and subfertile roosters (Labas et al., 2015;Soler et al., 2016a), but the molecular pathways involved in the sperm-fertilizing ability remains poorly described.
Here, to increase our understanding of subfertility causes in chickens, we first evaluated the semen quality from fertile and subfertile meat-type roosters in order to identify sperm defects relative to the fertility reduction observed in some animals. Furthermore, we used two complementary label-free quantitative proteomic approaches (ICM-MS and GeLC-MS/MS)
at the individual level, in order to identify the proteins relative to sperm-fertilizing ability in chickens and potentially linked them to sperm quality defects and identify new cellular impairments not revealed by classicalin vitro semen quality evaluation.
MATERIALS AND METHODS
Animals
All experiments were carried out in accordance with the European welfare and the French Direction of Veterinary Services regulations (agreement number C37–175-1) as previously described (Soler et al., 2016a). Animal rearing was performed in the PEAT INRAe Poultry Experimental Facility (2018)1. Briefly, 360 adult ISABROWN females (ISA, Ploufragan, France) and 36 meat-line males acquired from Hubbard and Novogen (Quintin, France) were housed under a 14L/10D photoperiod and fed with standard diet of 12.5 MJ/day, supplemented with calcium for the females. Whereas males were housed in individual battery cages, hens were reared in groups of 5 animals.
Semen Collection
Semen were collected twice a week by massage (Burrows and
Quinn, 1937) for 5 weeks for in vitro analysis or in vivo
fertility determination. After collection, sperm concentrations were immediately determined by light absorption (Accucell photometer, IMV Technologies, L’Aigle, France) at a wavelength of 530 nm (Brillard and McDaniel, 1985) and semen were diluted 1:1 in Beltsville Poultry Semen Extender (BPSE) (Sellier et al., 2006). Semen were used directly to analyze semen or inseminate females and aliquoted for proteomic investigation.
In vivo Fertility Determination
To estimate the individual in vivo fertility of each male, 10 females per male were intravaginal artificially inseminated (AI) with a dose of 108 sperm cells/female, two times at 1 week interval. Females were all fertile with almost one egg per day and randomly attributed to males. Fertility was determined by egg candling (from days 2 to 9 after the first AI and days 2–23 after the second AI). The fertility rate (FR) was defined as the percentage of fertile egg on the total number of analyzed egg (about 250 for each male). Males with FR >70% (n = 14) were considered fertile (F), whereas the subfertile (SF) population was associated with a FR <40% (n = 11) (Soler et al., 2016a). Nine animals per fertility status (F or SF) were randomly selected and included in this analysis. The difference of fertility between F and SF animals was explored by Mann–Whitney test, and significant difference was defined at 5% (p ≤ 0.05; R studio, R software version 4.0.2) (Allaire, 2015;
R Core Team, 2017).
In vitro Semen Analysis
As previously described (Labas et al., 2015;Soler et al., 2016a), semen quality was investigated with severalin vitro parameters 1https://doi.org/10.15454/1.5572326250887292E12
on F and SF animals. 7–8 ejaculates per rooster, collected in a period of 20 days, were included in the evaluation. Sperm volume was defined by weighing (ml), and sperm concentration was determined by light absorption (109 sperm/ml), as previously described. Sperm viability (%) was determined with SYBR-14/propidium iodide fluorescent dyes, as previously described (Soler et al., 2016a), on at least 300 marked sperm per individual sample. Mass motility, defined as the movement of sperm group, was defined on a motility scale previously described
(Blesbois et al., 2008): 0 as a total lack of movement and 9
as the presence of representing whirlwinds covering 30–60% of the observed area. Furthermore, objective measurements of motility were evaluated using the computer-assisted sperm analysis (CASA) system with an HTM-IVOS (Hamilton–Thorn Motility Analyzer, IVOS) (Blesbois et al., 2008). Thus, motility parameters such as straight-line velocity (VSL,µm/s), curvilinear velocity (VCL, µm/s), and average path velocity (VAP, µm/s) were individually determined as the mean of two semen samples. These parameters were also used to determine the percentages of motile, rapid, and progressive sperms as a motile sperm presented a VAP> 5 µm/s, rapid sperms showed a VAP > 50 µm/s, and a progressive cell was defined by a VAP > 50 µm/s. All preparations and observation were performed by the same observer. Each parameter was subjected to the Mann–Whitney test on the animal subset included in this analysis (9 animals F and 9 roosters SF; R studio, R software version 4.0.2) (Allaire, 2015;R Core Team, 2017). The statistical significance was defined at 5% (p ≤ 0.05).
Intact Cell MALDI-TOF–Mass
Spectrometry
Whole and intact sperm cells from F and SF roosters (n = 9) were analyzed by ICM-MS. Three ejaculated semen samples were collected from each male on BPSE as previously described. Sperm cells were isolated by centrifugation (600 ×g, 10 min at 4◦
C). Sperm cells were washed twice with 1 ml of Tris Sucrose Buffer (TSB, 20 mM Tris–HCl, pH 6.8, and 260 mM sucrose) and then resuspended at 106 sperm/µl. Using the dried droplet method, 1µl of cell suspension was overlain with 2.5 µl of sinapinic acid matrix solution at 20 mg/ml dissolved in 50% acetonitrile/50% water in the presence of 2% trifluoroacetic acid. Twelve replicates were spotted for each sample onto an MTP Ground Steel 384 MALDI plate (Bruker Daltonics, Germany). The matrix/sample mix was allowed to evaporate at room temperature for 30 min. MS acquisitions were performed using a Bruker UltrafleXtreme MALDI-TOF instrument (Bruker Daltonics, Germany) equipped with a Smartbeam laser at a 2-kHz laser repetition rate following an automated method controlled by FlexControl 3.0 software (Bruker Daltonics, Germany). Spectra were obtained in positive linear ion mode in the m/z 1,000–20,000 range and collected from each spot as a sum of 1,000 laser shots in 5 shot steps (total of 5,000 spectra per spot). The parameters used for spectra acquisition were ion source 1, 25 kV; ion source 2, 23.55 kV; lens, 7 kV; pulsed ion extraction; and laser parameter set, large. Spectra were acquired three consecutive times per spot (36 technical replicates per sample). External
calibration was applied using a mixture of known peptides and proteins as Glu1-fibrinopeptide B [M + H]+ = 1 571.59 m/z, ACTH (fragments 18–39) [M + H]+ = 2 466.68 m/z, insulin [M + H]+= 5 734.52 m/z and ubiquitin [M + H]+= 8 565.76 m/z, cytochrome C [M + H]+= 12 360,97 m/z, and myoglobin [M + H]+ =
16 952.31 m/z. To increase mass accuracy (mass error < 0.05%), internal calibration was subsequently applied to all spectra. The latter was achieved by performing a lock mass correction using flexAnalysis 4.0 software (Bruker) with the mass of the highest-intensity peak in the middle of the mass range, corresponding to the protein phosphoglycerate kinase (7,983.457 m/z). All spectra were converted in format mzXML using the CompassXport tool (Bruker Daltonics) and treated using the free and open-source analysis software R (version 3.6.1) along with specific package for Quantitative Analysis of Mass Spectrometry Data as MALDIquant (v1.19.3) (Gibb and
Strimmer, 2012). The spectra were treated using the square
root intensities, and the baseline estimation was based on the TopHat filter (van Herk, 1992;Gil and Werman, 1993). Spectra were smoothed using the Savitzky–Golay filter, realigned using prominent peaks, and normalized on intensity using the total ion current (TIC) method (Filzmoser and Walczak, 2014). Peaks were detected using the Median Absolute Deviation (MAD) method with a signal-to-noise ≥ 2. To retain only quality spectra for each sperm sample, the dataset (n = 36 technical spectra) was filtered by correlation analyses by comparing the spectra two by two. Then, we computed filter-based correlation coefficients with iterations from 40 to 90% for each technical spectrum vs. all other spectra of the same class. All retained spectra were merged to generate a total average spectrum for each sample. The x-axis of spectra represented the m/z values of biomolecules, and the y-axis represented the normalized peak intensities.
The intra-assay precisions of the ICM-MS acquisitions were determined by calculating the coefficient of variation (% CV) of the normalized peak-intensity values from the technical replicates for each ejaculate (n = 27). The CV% are ranged from 16.71 to 46.88% with a mean CV at 29.41%. The inter-assay precision was determined by calculating the % CV of the mean peak-normalized values for the three ejaculates of all animals. For F and SF populations, the mean% CV did not exceed 36.76 and 36.38%, respectively.
The MS data did not pass the normality and homogeneity QQ plot and Kolmogorov–Smirnov tests. Therefore, for comparative analyses, data were submitted to the non-parametric Mann– Whitney or Wilcoxon test to characterize changes between the two fertility conditions. M/z were considered significantly differential when ap< 0.05 and a fold-change ratio (FC) ≤ 0.66 or ≥ 1.5. Principal component analysis (PCA) and volcano plot were performed using the gplots (v3.0.3) and FactoMineR (v2.1) packages of the R software (R Core Team, 2017).
The peaks observed by ICM-MS were annotated using a home database generated from Gallus gallus sperm top-down proteomics, containing ∼800 biomolecules already identified in chicken spermatozoa (Soler et al., 2016a,b). The ICM-MS peaks were aligned to theoretical peptidoform and proteoform average masses [M + H]+
modifications, with a mass tolerance ≤ 0.05% (± 500 ppm) (Supplementary Data 1).
Bottom-Up Proteomic by GeLC-MS/MS
Four animals from each fertility status (SF and F) were randomly selected to be analyzed by a bottom-up proteomic approach combining SDS-PAGE fractionation, in-gel protein digestion by trypsin, and nano-Liquid Chromatography coupled to high-resolution tandem mass spectrometry (GeLC-MS/MS). Briefly, proteins were extracted as previously described (Labas et al., 2015) and 50µg of total protein was submitted to SDS-PAGE (4–20%, 8.3 × 6 cm × 1.5 mm). After Coomassie Blue staining, each gel lane was fractionated into 11 slices. Gel pieces were washed in water with acetonitrile (1:1), then cysteine reduction and alkylation were performed by successive incubations with 10 mM dithiothreitol in 50 mM NH4HCO3(30 min, at 56◦C) and 55 mM iodoacetamide in 50 mM NH4HCO3(20 min, at room temperature, in the dark). Digestion was carried out overnight using 25 mM NH4HCO3 with bovine trypsin (sequencing grade, Roche Diagnostics, Paris, France) at 12.5 ng/µl. Peptides were extracted and dried using a SPD1010 speedvac system (ThermoSavant, Thermo Fisher Scientific). For each protein band, the resultant peptide mixture was reconstituted with 30µl of 0.1% formic acid and 2% acetonitrile, sonicated for 10 min and analyzed by nanoLC-MS/MS in triplicate. Proteomic experiments were performed using an LTQ Orbitrap Velos mass spectrometer coupled to an Ultimate R
3000 RSLC Ultra High-Pressure Liquid Chromatographer (Thermo Fisher Scientific, Bremen, Germany) as previously described (Labas et al., 2015). A peptide mixture (5µl) was loaded on a trap column for desalting and separated using a nano-column. The gradient consisted of 4–55% B for 90 min at a 300 nl/min flow rate. The mass spectrometer was operated in positive data-dependent mode using Xcalibur software (version 2.1; Thermo Fisher Scientific, San Jose, CA). In the scan range of m/z 300–1,800 with a targeted resolution at 60,000, the 20 most intense peptide ions with charge states ≥ 2 were fragmented using Collision Induced Dissociation (CID). A lock mass corresponding to polydimethylcyclosiloxane ions [m/z, 445.1200025 (Si(CH3)2O)6] was enabled for accurate mass measurements.
Protein data identification was performed using Mascot search engine version 2.7.0.1 (Matrix Science, London, United Kingdom) combined to Proteome Discoverer 2.1.1.21 software (Thermo Fisher Scientific, Bremen, Germany), against the chordata section of the non-redundant NCBI database (download august 2020). The search parameters included trypsin as a protease with two allowed missed cleavages and carbamidomethylcysteine, methionine oxidation, and acetylation of N-term protein as variable modifications. The tolerance of the ions was set to 5 ppm for parent and 0.8 Da for fragment ion matches. Mascot results obtained from the target and decoy databases searches were subjected to Scaffold software (v 4.11.1, Proteome Software, Portland, United States) using the protein cluster analysis option (assemble proteins into clusters based on shared peptide evidence). Peptide and protein identifications were validated and accepted if they could be established at greater than 95.0% probability as specified by the
Peptide Prophet algorithm (Keller et al., 2002) and by the Protein Prophet algorithm (Nesvizhskii et al., 2003), respectively. Protein identifications were accepted if they contained at least two identified peptides. The correspondent% decoy false discovery rate (FDR) done by Scaffold software was < 0.0% regarding the number of protein/clusters, and FDR was < 0.00% for the 141,914 spectra, which was in accordance with FDR values acceptable by Mass Spectrometry Data Interpretation Guidelines (<1%) (Deutsch et al., 2016). Quantifications were based on a label-free approach using two independent quantitative methods: the Spectral Counting (SC) using the “Weighed Spectra” method
(Liu et al., 2004) and the Average Precursor Intensity (API)
method (Cox et al., 2014). At-test was performed to characterize changes between F and SF roosters. Differences were considered statistically significant for t-test with a p < 0.05. Limits of an average normalized weighted spectra (NWS) of ≥ 5 and fold change of ≤ 0.71 or ≥ 1.4 were included to increase the validity of comparison. MS data have been deposited to the ProteomeXchange Consortium via the PRIDE partner repository (Vizcaíno et al., 2014) with the dataset identifier PXD022322 and 10.6019/PXD022322.
For each significant cluster, one significant protein with an annotation (exclusion of LOC proteins without gene symbol and defined by their gene loci), a unique gene symbol, and a gene description has been randomly chosen to represent the cluster (n = 39, Supplementary Data 2). When the unique gene was defined as significant by SC and API methods, the SC analysis was kept. The mean signal of each differentially abundant protein (DAP) with unique gene symbol for each individual was calculated based on the three technical replicates by animal (Supplementary Data 2). Data exploration was performed with R (version 4.0.2) (R Core Team, 2017). Protein abundances obtained by GeLC-MS/MS, mass motility, and fertility contributions to the sample variability were explored by principal component analysis (PCA) with the package factoextra (version 1.0.7).
Western Blotting
Sperm cells were separated by centrifugation (600 ×g, 10 min, 20◦
C) from the seminal plasma for 4 F and 4 SF males randomly selected. Sperm proteins were extracted by sonication in lysis buffer (150 mM NaCl, 10 mM Tris–HCl, 1 mM EGTA, 1 mM EDTA, 200 mM sodium fluoride, 4 mM sodium pyrophosphate, 2 mM sodium orthovanadate, 1% Triton X-100, and 0.5% NP40) with protease inhibitor EDTA-free (1 tablet/10 ml buffer, 04693159001, Roche Diagnostics, Mannheim, Germany). Twenty-five micrograms of protein was included in gradient 8–16% gradient SDS-PAGE, before being transferred onto nitrocellulose membranes (Amersham Protran 0.2 µm NC, 10-600001, GE Healthcare Life Science, Germany). Total protein staining on membranes was achieved using RevertTM 700 Total Protein Stain (cat. 926-11011, LI-COR Biosciences, United States) according to the manufacturer’s instructions and scanned with the Odyssey CLx Imaging System (LI-COR Biosciences, Germany). Membranes were incubated with primary antibody overnight at 4◦
C, then incubated with the appropriate fluorescent-conjugated secondary antibody, IRDye 800CW goat
anti-rabbit (cat. 926-32211, LI-COR Biosciences, United States) or IRDye 800CW goat anti-mouse (cat. 926-32210, LI-COR Biosciences, United States), diluted 1:2,000 in Odyssey blocking buffer (cat. 927-50000, LI-COR Biosciences, United States) diluted 1:1 (v:v) in Tris-buffered saline buffer (TBS) (cat. N14581, Interchim Life Sciences, France). The optimized primary antibodies were used as follows: rabbit anti-lysozyme (1:500) and mouse anti-ovotransferrin [1:1,000, mouse (Gautron et al., 2001)] in 0.1% Tween 20 TBS (TBS, cat. N14581, Interchim Life Sciences, France; Tween-20, cat. P9516, Sigma, Germany) with 5% (w/v) non-fat dry milk, at room temperature. The antibodies raised against lysozyme and ovotransferrin were a kind gift from S. Réhault-Godbert and J. Gautron (INRAE, University of Tours, BOA, Nouzilly, France). It was produced by ProteoGenix (Schiltigheim, France) after immunization of rabbits with purified egg white lysozyme (Sigma-Aldrich, Saint-Quentin-Fallavier, France). A protein-specific band signal was normalized against total protein stain signal, and differences were evaluated using a Mann–Whitney test (R studio, R software version 4.0.2) (Allaire, 2015;R Core Team, 2017). The statistical significance was defined at 5% (p< 0.05).
RESULTS
Fertility and in vitro Characterization of
Semen
Thein vitro characterization of the semen from F and SF roosters included the investigation of volume, concentration, viability,
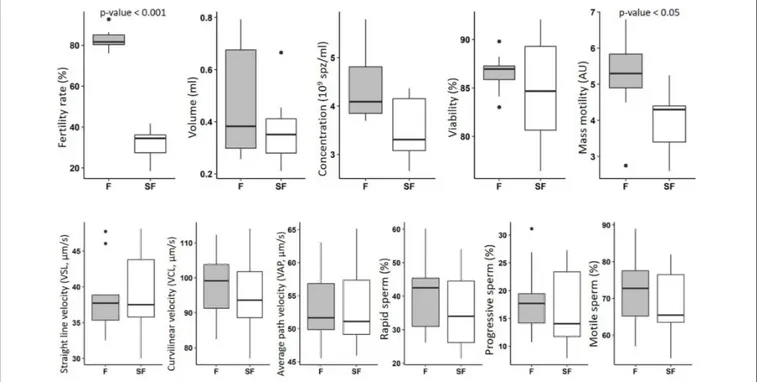
and several motility parameters. The significant decrease of in vivo fertility observed in SF animals is associated with a reduction of mass motility (Figure 1). No significant impact was observed on the otherin vitro parameters investigated, i.e., volume, concentration, viability, and other motility parameters, obtained with CASA analysis.
Comparison of Sperm ICM-MS Profiles
From F and SF Roosters
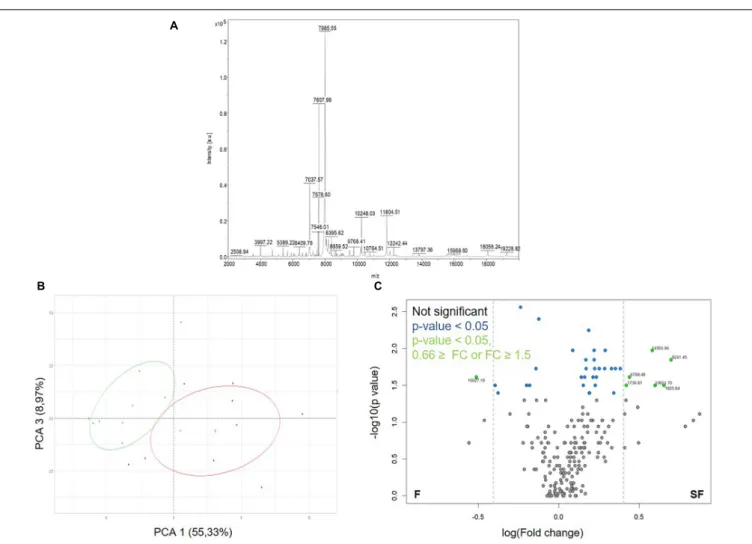
We firstly applied the ICM-MS approach to sperm sampled from F and SF roosters (Figure 2 and Supplementary Data 1). Sperm ICM-MS profiling from meat-line roosters revealed 211 detected peaks in total (Figure 2A). Descriptive analysis performed by PCA reported a clear segregation of F and SF samples based on PCA1 (55.33%) and PCA3 (8.97%) (Figure 2B). The differential analysis revealed 36 m/z peaks differentially abundant between F and SF animals (p< 0.05, Figure 2C). Among them, 7 presented a fold-change ratio (FC) ≤ 0.66 or ≥ 1.5 (Figure 2C). The annotation of these peaks was performed by computational confrontation against a homemade database of chicken sperm proteoforms and peptidoforms identified by Top-Down
MS (Soler et al., 2016a). Three differential peaks with low
m/z corresponding to peptidoforms (as results of protein degradation) were reported: cilia- and flagella-associated protein 100 (CFAP100, 1730.81 m/z, NPFTIPPDIDIFAIR), alpha enolase (ENO1, 1805.64 m/z, AAVPSGASTGIYEALELR) and tubulin beta-7 chain (TUBB7, 6789.49 m/z, SGPFGQIFRPDNFVFGQ SGAGNNWAKGHYTEGAELVDSVLDVVRKEAESCDCLQGF QLTHSLG). Manual annotation allowed to describe one
FIGURE 1 | In vitro characterization of semen from fertile (F) and subfertile (SF) meat-line chickens. Semen samples (9 roosters per fertility status) were subjected to in vitro evaluation including the determination of volume, concentration, viability, and several motility parameters. F animals in gray; SF animals in white. Data were analyzed with Mann–Whitney test and statistical difference was defined with p ≤ 0.05.
FIGURE 2 | Protein content exploration of sperm from fertile (F) and subfertile (SF) meat-line roosters by ICM-MS. (A) Representative sperm cell ICM-MS spectra from one F animal. (B) Principal component analysis (PCA) of ICM-MS signals obtained for F (in green) and SF (in red) roosters. (C) Volcano plot analysis between F and SF animals of detected m/z peaks (n = 211). Gray points indicate not significant peaks, blue ones, peaks with a significant abundance difference between F and SF animals (p< 0.05), and green ones, the significant peaks presenting a fold change (FC) ≤ 0.66 or ≥ 1.5.
whole protein: Lysozyme (LYZ, 14305.86 m/z). These three peptidoforms and one protein were more abundant in SF sperm cells than in F samples (Figure 2C).
Comparison of Sperm Proteome From F
and SF Roosters by GeLC-MS/MS
Analysis
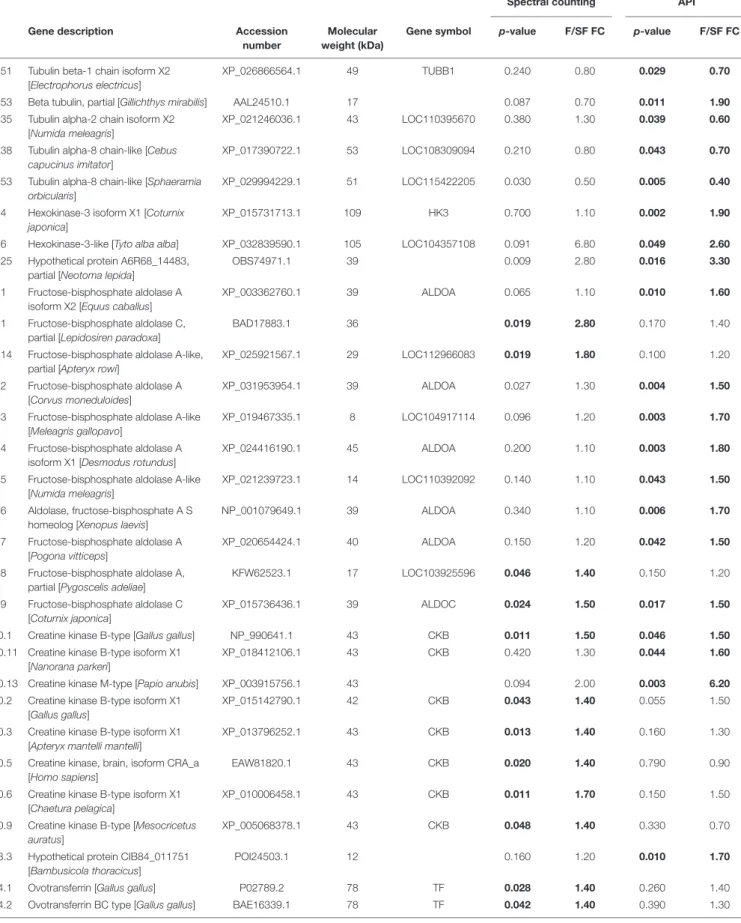
To increase the number of identified DAP and obtain a global overview of semen proteome, we applied a bottom-up proteomic approach and compared F and SF sperm cell profiles. The GeLC-MS/MS investigation of sperm protein content of F and SF animals allowed the detection of 745 proteins included in 327 clusters. Among them, 27 and 50 DAP were identified by the SC and API quantitative methods, respectively, and 7 were comforted by both approaches. Consequently, a total of 84 DAP were identified with differential abundance between F and SF roosters by GeLC-MS/MS analysis (Table 1).
A list of unique genes was developed based on DAP with a gene description and a gene symbol corresponding to the
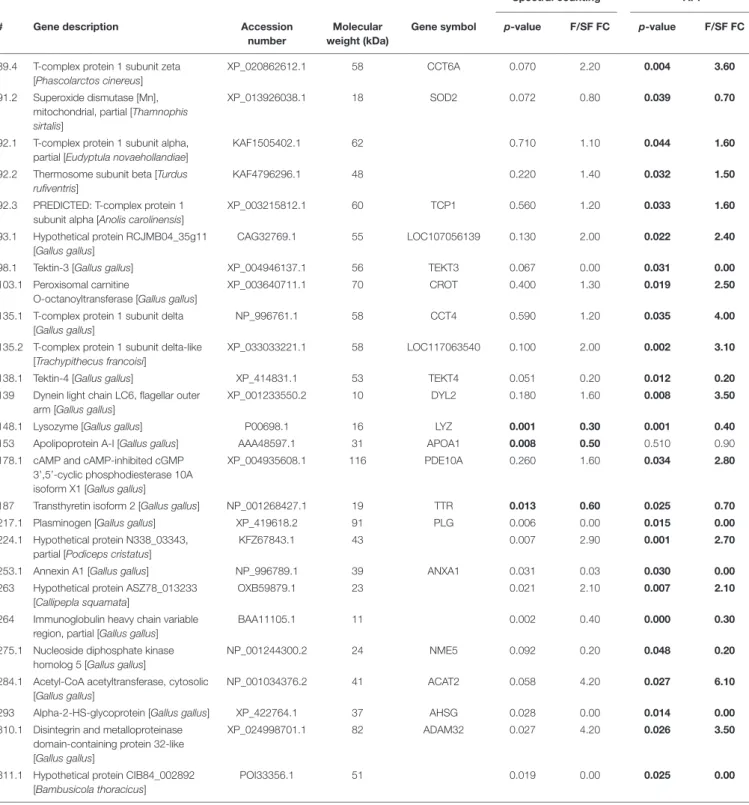
described protein (i.e., DAP list obtained from GeLC-MS/MS without LOC proteins,n = 39) (Supplementary Data 2). This list was used for functional analysis. Combined with animal fertility status and semen mass motility, the PCA analysis (Figure 3) revealed that the first dimension (52.6% of the variability) represented animals clustering according to their fertility status and their sperm mass motility. According to this dimension, proteins with unique genes and annotation were speared by their expression fold change: with negative values, the more abundant proteins in SF roosters, and with positive value, the ones more abundant in F roosters. Dimension 2 only represented 14.4% of the variability (Figure 3) and preferentially represented interindividual variability within a fertility status.
Western Blotting
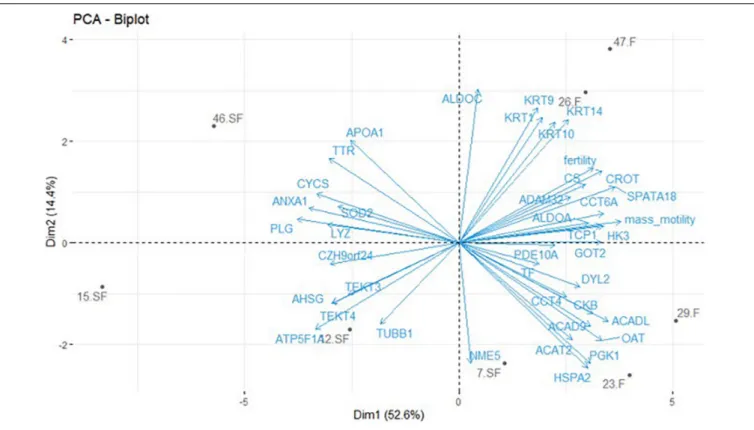
The differential abundance of ovotransferrin (TF) and lysozyme (LYZ) was validated by western blotting. Both proteins presented a significant differential abundance between F and SF sperm,
TABLE 1 | Differentially abundant proteins between fertile (F) and subfertile (SF) meat-line chickens identified by GeLC-MS/MS.
Spectral counting API
# Gene description Accession
number
Molecular weight (kDa)
Gene symbol p-value F/SF FC p-value F/SF FC
1.51 Tubulin beta-1 chain isoform X2 [Electrophorus electricus]
XP_026866564.1 49 TUBB1 0.240 0.80 0.029 0.70
1.53 Beta tubulin, partial [Gillichthys mirabilis] AAL24510.1 17 0.087 0.70 0.011 1.90
2.35 Tubulin alpha-2 chain isoform X2 [Numida meleagris]
XP_021246036.1 43 LOC110395670 0.380 1.30 0.039 0.60
2.38 Tubulin alpha-8 chain-like [Cebus capucinus imitator]
XP_017390722.1 53 LOC108309094 0.210 0.80 0.043 0.70
2.53 Tubulin alpha-8 chain-like [Sphaeramia orbicularis]
XP_029994229.1 51 LOC115422205 0.030 0.50 0.005 0.40
6.4 Hexokinase-3 isoform X1 [Coturnix japonica]
XP_015731713.1 109 HK3 0.700 1.10 0.002 1.90
6.6 Hexokinase-3-like [Tyto alba alba] XP_032839590.1 105 LOC104357108 0.091 6.80 0.049 2.60
7.25 Hypothetical protein A6R68_14483, partial [Neotoma lepida]
OBS74971.1 39 0.009 2.80 0.016 3.30
8.1 Fructose-bisphosphate aldolase A isoform X2 [Equus caballus]
XP_003362760.1 39 ALDOA 0.065 1.10 0.010 1.60
8.1 Fructose-bisphosphate aldolase C, partial [Lepidosiren paradoxa]
BAD17883.1 36 0.019 2.80 0.170 1.40
8.14 Fructose-bisphosphate aldolase A-like, partial [Apteryx rowi]
XP_025921567.1 29 LOC112966083 0.019 1.80 0.100 1.20
8.2 Fructose-bisphosphate aldolase A [Corvus moneduloides]
XP_031953954.1 39 ALDOA 0.027 1.30 0.004 1.50
8.3 Fructose-bisphosphate aldolase A-like [Meleagris gallopavo]
XP_019467335.1 8 LOC104917114 0.096 1.20 0.003 1.70
8.4 Fructose-bisphosphate aldolase A isoform X1 [Desmodus rotundus]
XP_024416190.1 45 ALDOA 0.200 1.10 0.003 1.80
8.5 Fructose-bisphosphate aldolase A-like [Numida meleagris]
XP_021239723.1 14 LOC110392092 0.140 1.10 0.043 1.50
8.6 Aldolase, fructose-bisphosphate A S homeolog [Xenopus laevis]
NP_001079649.1 39 ALDOA 0.340 1.10 0.006 1.70
8.7 Fructose-bisphosphate aldolase A [Pogona vitticeps]
XP_020654424.1 40 ALDOA 0.150 1.20 0.042 1.50
8.8 Fructose-bisphosphate aldolase A, partial [Pygoscelis adeliae]
KFW62523.1 17 LOC103925596 0.046 1.40 0.150 1.20
8.9 Fructose-bisphosphate aldolase C [Coturnix japonica]
XP_015736436.1 39 ALDOC 0.024 1.50 0.017 1.50
10.1 Creatine kinase B-type [Gallus gallus] NP_990641.1 43 CKB 0.011 1.50 0.046 1.50
10.11 Creatine kinase B-type isoform X1 [Nanorana parkeri]
XP_018412106.1 43 CKB 0.420 1.30 0.044 1.60
10.13 Creatine kinase M-type [Papio anubis] XP_003915756.1 43 0.094 2.00 0.003 6.20
10.2 Creatine kinase B-type isoform X1 [Gallus gallus]
XP_015142790.1 42 CKB 0.043 1.40 0.055 1.50
10.3 Creatine kinase B-type isoform X1 [Apteryx mantelli mantelli]
XP_013796252.1 43 CKB 0.013 1.40 0.160 1.30
10.5 Creatine kinase, brain, isoform CRA_a [Homo sapiens]
EAW81820.1 43 CKB 0.020 1.40 0.790 0.90
10.6 Creatine kinase B-type isoform X1 [Chaetura pelagica]
XP_010006458.1 43 CKB 0.011 1.70 0.150 1.50
10.9 Creatine kinase B-type [Mesocricetus auratus]
XP_005068378.1 43 CKB 0.048 1.40 0.330 0.70
13.3 Hypothetical protein CIB84_011751 [Bambusicola thoracicus]
POI24503.1 12 0.160 1.20 0.010 1.70
14.1 Ovotransferrin [Gallus gallus] P02789.2 78 TF 0.028 1.40 0.260 1.40
14.2 Ovotransferrin BC type [Gallus gallus] BAE16339.1 78 TF 0.042 1.40 0.390 1.30
TABLE 1 | Continued
Spectral counting API
# Gene description Accession
number
Molecular weight (kDa)
Gene symbol p-value F/SF FC p-value F/SF FC
18.1 ATP synthase subunit alpha, mitochondrial, partial [Colius striatus]
XP_010196224.1 58 ATP5F1A 0.001 0.70 0.760 1.00
18.5 ATP synthase subunit alpha, mitochondrial-like [Arvicanthis niloticus]
XP_034353318.1 60 LOC117705093 0.005 0.60 0.008 1.60
22.1 Keratin 1 [Homo sapiens] AAG41947.1 66 KRT1 0.019 1.60 0.095 1.80
22.3 Keratin, type II cytoskeletal 1 isoform X2 [Macaca mulatta]
XP_001098182.2 65 KRT1 0.034 2.10 0.360 1.40
22.8 Keratin, type II cytoskeletal 6A isoform X2 [Pongo abelii]
XP_024113011.1 57 LOC100449906 0.002 4.30 0.012 2.70
24.1 Heat shock protein Hsp70 [Gallus gallus]
AAN18280.1 70 HSPA2 0.045 1.60 0.750 1.10
24.7 Heat shock 70 kDa protein [Gallus gallus]
BBO36590.1 70 HSPA2 0.024 2.00 0.910 1.00
27.2 Hypothetical protein N333_09691, partial [Nestor notabilis]
KFQ42654.1 45 GOT2 0.530 0.90 0.005 1.70
32.1 Hypothetical protein ASZ78_016751 [Callipepla squamata] OXB67628.1 45 0.003 1.80 0.140 1.30 32.11 Phosphoglycerate kinase 1 [Paralichthys olivaceus] XP_019941634.1 44 PGK1 0.110 1.80 0.040 1.80 32.2 Phosphoglycerate kinase 1 [Ceratotherium simum simum]
XP_004442122.1 45 LOC101387600 0.001 1.60 0.010 1.80
32.3 Phosphoglycerate kinase 1 [Echeneis naucrates]
XP_029374590.1 44 PGK1 0.020 1.60 0.045 1.50
32.8 Phosphoglycerate kinase 2-like [Ictidomys tridecemlineatus]
XP_005318639.1 45 LOC101964802 0.002 1.60 0.014 1.70
33.1 Keratin 10 [Homo sapiens] AAH34697.1 59 KRT10 0.010 1.50 0.900 1.00
33.2 Keratin, type I cytoskeletal 9 [Homo sapiens]
NP_000217.2 62 KRT9 0.022 2.30 0.170 2.00
33.3 Keratin 14 [Homo sapiens] AAH02690.1 52 KRT14 0.000 4.20 0.180 1.70
46 Unnamed protein product, partial [Gallus gallus]
CAA30161.1 54 LOC107051274 0.000 0.30 0.400 0.80
49.1 Mitochondria-eating protein isoform X1 [Gallus gallus]
XP_004936087.1 62 SPATA18 0.001 1.60 0.094 1.40
56.1 Citrate synthase, mitochondrial isoform X2 [Gallus gallus]
XP_015155774.1 56 CS 0.020 1.40 0.003 1.90
59 Hypothetical protein CIB84_000737 [Bambusicola thoracicus]
POI35507.1 30 0.013 1.60 0.420 1.20
60.1 Cytochrome c [Gallus gallus] NP_001072946.1 12 CYCS 0.037 0.60 0.310 1.20
63.1 Spermatid-specific manchette-related protein 1 isoform X2 [Gallus gallus]
XP_004937159.1 30 CZH9orf24 0.030 0.30 0.180 0.60
65.1 Complex I assembly factor ACAD9, mitochondrial [Gallus gallus]
NP_001006136.1 68 ACAD9 0.009 1.60 0.980 1.00
65.2 Acyl-CoA dehydrogenase family member 9, mitochondrial [Rhincodon typus]
XP_020383709.1 70 ACAD9 0.015 3.00 0.032 4.60
68.4 Hypothetical protein parPi_0021429 [Paroedura picta]
GCF58429.1 47 0.580 0.90 0.047 1.50
69.3 Long-chain specific acyl-CoA dehydrogenase, mitochondrial [Monopterus albus]
XP_020470903.1 50 ACADL 0.430 1.20 0.039 1.40
82.3 Ornithine aminotransferase, mitochondrial [Phaethon lepturus]
XP_010295191.1 48 OAT 0.013 2.20 0.038 1.70
89.1 T-complex protein 1 subunit zeta [Gallus gallus]
NP_001006216.1 58 CCT6A 0.014 1.50 0.540 1.20
TABLE 1 | Continued
Spectral counting API
# Gene description Accession
number
Molecular weight (kDa)
Gene symbol p-value F/SF FC p-value F/SF FC
89.4 T-complex protein 1 subunit zeta [Phascolarctos cinereus]
XP_020862612.1 58 CCT6A 0.070 2.20 0.004 3.60
91.2 Superoxide dismutase [Mn], mitochondrial, partial [Thamnophis sirtalis]
XP_013926038.1 18 SOD2 0.072 0.80 0.039 0.70
92.1 T-complex protein 1 subunit alpha, partial [Eudyptula novaehollandiae]
KAF1505402.1 62 0.710 1.10 0.044 1.60
92.2 Thermosome subunit beta [Turdus rufiventris]
KAF4796296.1 48 0.220 1.40 0.032 1.50
92.3 PREDICTED: T-complex protein 1 subunit alpha [Anolis carolinensis]
XP_003215812.1 60 TCP1 0.560 1.20 0.033 1.60
93.1 Hypothetical protein RCJMB04_35g11 [Gallus gallus]
CAG32769.1 55 LOC107056139 0.130 2.00 0.022 2.40
98.1 Tektin-3 [Gallus gallus] XP_004946137.1 56 TEKT3 0.067 0.00 0.031 0.00
103.1 Peroxisomal carnitine
O-octanoyltransferase [Gallus gallus]
XP_003640711.1 70 CROT 0.400 1.30 0.019 2.50
135.1 T-complex protein 1 subunit delta [Gallus gallus]
NP_996761.1 58 CCT4 0.590 1.20 0.035 4.00
135.2 T-complex protein 1 subunit delta-like [Trachypithecus francoisi]
XP_033033221.1 58 LOC117063540 0.100 2.00 0.002 3.10
138.1 Tektin-4 [Gallus gallus] XP_414831.1 53 TEKT4 0.051 0.20 0.012 0.20
139 Dynein light chain LC6, flagellar outer arm [Gallus gallus]
XP_001233550.2 10 DYL2 0.180 1.60 0.008 3.50
148.1 Lysozyme [Gallus gallus] P00698.1 16 LYZ 0.001 0.30 0.001 0.40
153 Apolipoprotein A-I [Gallus gallus] AAA48597.1 31 APOA1 0.008 0.50 0.510 0.90
178.1 cAMP and cAMP-inhibited cGMP 3’,5’-cyclic phosphodiesterase 10A isoform X1 [Gallus gallus]
XP_004935608.1 116 PDE10A 0.260 1.60 0.034 2.80
187 Transthyretin isoform 2 [Gallus gallus] NP_001268427.1 19 TTR 0.013 0.60 0.025 0.70
217.1 Plasminogen [Gallus gallus] XP_419618.2 91 PLG 0.006 0.00 0.015 0.00
224.1 Hypothetical protein N338_03343, partial [Podiceps cristatus]
KFZ67843.1 43 0.007 2.90 0.001 2.70
253.1 Annexin A1 [Gallus gallus] NP_996789.1 39 ANXA1 0.031 0.03 0.030 0.00
263 Hypothetical protein ASZ78_013233 [Callipepla squamata]
OXB59879.1 23 0.021 2.10 0.007 2.10
264 Immunoglobulin heavy chain variable region, partial [Gallus gallus]
BAA11105.1 11 0.002 0.40 0.000 0.30
275.1 Nucleoside diphosphate kinase homolog 5 [Gallus gallus]
NP_001244300.2 24 NME5 0.092 0.20 0.048 0.20
284.1 Acetyl-CoA acetyltransferase, cytosolic [Gallus gallus]
NP_001034376.2 41 ACAT2 0.058 4.20 0.027 6.10
293 Alpha-2-HS-glycoprotein [Gallus gallus] XP_422764.1 37 AHSG 0.028 0.00 0.014 0.00
310.1 Disintegrin and metalloproteinase domain-containing protein 32-like [Gallus gallus]
XP_024998701.1 82 ADAM32 0.027 4.20 0.026 3.50
311.1 Hypothetical protein CIB84_002892 [Bambusicola thoracicus]
POI33356.1 51 0.019 0.00 0.025 0.00
Significant abundance differences were characterized between F and SF animals by applying t-test and retaining only accession numbers with p-values ≤ 0.05 associated with a fold-change ratio (FC) ≤ 0.71 or ≥ 1.4. Significant peptides are indicated with bold characters within columns corresponding to spectral counting and API (Average Precursor Intensity) quantitative methods. #: number of the considered cluster (before the point) and peptides (after the point).
and abundance changes were in the same direction as in the proteomic analysis (Figure 4 and Table 2). A decrease of TF was revealed in SF samples by western blotting as well as by
GeLC-MS/MS, and LYZ was more abundant in SF animals in western blotting as well as in ICM-MS, GeLC-MS/MS approaches (Figure 4 and Table 2).
FIGURE 3 | Principal component analysis (PCA) of protein abundances obtained by GeLC-MS/MS with unique gene identification combined with fertility status and semen mass motility. Only DAP with a unique gene and an annotation (exclusion of LOC proteins) were included in this analysis. One significant DAP per cluster was retained and the mean signal calculated based on the three technical replicates obtained for each animal. Animals are revealed by their identification number and their fertility status (F = fertile; SF = subfertile). Animals are represented in gray and protein contribution as well as semen parameters in blue.
DISCUSSION
The molecular basis of male fertility remains unclear, especially in chickens, where decades of genetic selection induced an important increase in male fertility variability as a side effect (Soler et al., 2016a). To determine the crucial proteins involved in sperm-fertilizing abilities in order to decipher the impaired molecular pathways in subfertile animals and potentially link them to semen defects as causes of subfertility,in vivo rooster fertility was determined by AI in order to evaluate sperm-fertilizing ability and define animals according to their fertility status, i.e., fertile (FR > 70%) or subfertile (FR < 40%). Semen from F and SF roosters were then collected andin vitro characterized, and sperm protein content was analyzed by two complementary proteomic approaches, showing important candidates involved in the variations in sperm fertilizing ability.
In various species, sperm characteristic is evaluated by classicalin vitro tests (WHO, 2010), evaluating semen volume, concentration, mass motility, and individual cell motility. Here, these tests revealed that the observed fertility reduction in some individuals of meat-type roosters was mainly associated with a decrease of mass motility, whereas the individual sperm motility analysis by CASA was not impacted (Figure 1). However, the small non-significant reduction of percentages of motile, rapid, and progressive sperm obtained by individual investigation may, at the scale of the whole ejaculate, result in the observed reduction
of mass motility. Thus, small differences of sperm cell motility at the individual scale may result to a significant reduction of the whole sperm cell movement of the ejaculate, leading to a reduction of male fertility. In sheep, the association of mass motility reduction and impaired fertility has been reported
(David et al., 2015). In addition to the individual movement
of each sperm cell, the collective progress of sperm cells also appeared necessary to successfully reach the oocyte. So, our data revealed that, at least, one of the causes of subfertility in meat-type roosters was relative to sperm motility defects. However, we showed also that other sperm functions are affected.
To explore differences in sperm protein content between F and SF roosters, we used two complementary proteomic approaches: the ICM-MS and the GeLC-MS/MS. Indeed, whereas ICM-MS focused on the identification of small proteins and peptidoforms, as a result of protein degradation, without protein isolation, GeLC-MS/MS determines larger proteins previously extracted and digested. In contrast to GeLC-MS/MS (Supplementary
Data 3), the ICM-MS approach succeeded in segregating F
and SF animals on the basis of 211 detected peaks (Figure 2). Interestingly, PCA analysis revealed a more important variability within SF animals than within F animals, suggesting that causes of fertility reduction in SF roosters were multiple, corresponding to various proteomic profiles, as previously described (Labas et al., 2015). Furthermore, our data revealed that three of the differentially abundant peaks revealed by ICM-MS correspond to
FIGURE 4 | Western-blot quantification and signals of ovotransferrin (TF) and lysozyme (LYZ) in sperm from fertile (F) and subfertile (SF) roosters. *p< 0.05.
peptidoforms of CFAP100, TUBB7, and ENO1 (whose functions are described later), all more abundant in SF animals than in F roosters (Figure 2). These products certainly result from proteolytic events which could only be identified by ICM-MS methodology, known for highlighting specific or unspecific protease activities generally unrevealed by classical proteomics (Labas et al., 2018). Consequently, an increase of proteolytic events could be assumed in SF sperm, leading to defects on various molecular pathways involved in sperm-fertilizing ability. Moreover, the origin of the peptidoforms identified by ICM-MS remains a challenge, because of the limitation of exhaustive top-down MS databases for exhaustive proteome, as shown in our study by the absence of annotation of other differentially abundant peaks (Figure 2). Thus, whereas ICM-MS appeared to be limited to develop an exhaustive list of proteins involved in sperm-fertilizing abilities, it remains an efficient and sensitive methodology for the identification of small proteins and larger protein degradation products, using small amounts of sperm cells (∼105–106cells/spot) without prior sample preparation, making the ICM-MS approach a promising test to evaluate quality semen
and diagnose male fertility, as previously described (Soler et al., 2016a, 2020).
In order to increase the list of DAP involved in chicken sperm-fertilizing abilities, we therefore used the GeLC-MS/MS method and identified 54 DAP between roosters of the two fertility status (Figure 3 and Table 1), increasing the list of DAP involved in meat-line rooster sperm-fertilizing ability to 57 proteins. For most of them (at the exception of tubulins, tektins, and ovotransferrin), this data is the first report of their involvement in rooster fertility (Labas et al., 2015;
Soler et al., 2016a). The difference of abundance of 2 DAP,
one more abundant in F animals—ovotransferrin (TF)—and another more abundant in SF roosters—lysozyme (LYZ), was confirmed by immunoblot (Figure 4 and Table 2). This finding underlines the complementariness of our combined approach associating ICM-MS and classical bottom-up proteomics (Labas
et al., 2015) for characterization of markers. Of note, both
label-free quantitative proteomic approaches revealed LYZ as significantly more abundant in SF animals when compared to F roosters (Figures 2–4 and Table 2), and immunoblot confirmed the robustness of these quantifications. Altogether, these DAP reflect major dysregulations of flagellum integrity and functions, mitochondria activity, sperm maturation, and cellular interaction.
As a direct reflect of the observed reduction of mass motility, the axoneme integrity appeared impacted by the deregulation of TUBB (beta tubulins) and TEKT (tektins) abundances, crucial components of this cytoskeletal structure forming the flagellum core (Popodi et al., 2005; Raff et al., 2008). Whereas TEKT absence leads to a reduction of sperm motility in mice (Roy et al.,
2007, 2009), the increase of TUBB and TEKT family members
in SF sperm may increase the flagellum rigidity, also leading to a reduction of sperm motility. Interestingly, a perturbation of TEKT in SF animals was already reported in previous studies (Labas et al., 2015;Soler et al., 2016a), confirming the importance of these proteins in chicken sperm-fertilizing ability. However, total variation TUBB abundance may not be the only cause of TUBB influence on axoneme formation, since an increase of proteolytic regulation of TUBB7 has been revealed by ICM-MS experiments (Figure 2). Furthermore, multiple members of the TCP/CCT family were less abundant in SF sperm and these proteins are known to be involved in the cytoskeleton integrity by modeling of newly synthetized actin and tubulin monomers (Brackley and Grantham, 2011). Consistently with our data, reduction of their expression is associated with sperm
TABLE 2 | Comparison of the protein abundance fold change between fertile (F) and subfertile (SF) sperm obtained by ICM-MS, GeLC-MS/MS, and western blotting for ovotransferrin and lysozyme.
Fold change (F/SF)
Protein name ICM-MS GeLC-MS/MS
(spectral counting)
Immunoblotting
Ovotransferrin / 1.4 1.5
motility decrease (Castaneda et al., 2020). Whereas not revealed in sperm cells, the presence of CFAP100 (cilia- and flagella-associated protein 100) is crucial for the ciliary movement of Chlamydomonas reinhardtii, as involved in the regulation of axoneme assembly (Yamamoto et al., 2013). A similar function could be suggested in chicken sperm, and the degradation of CFAP100 by proteolysis may impair the flagellum movement. In addition to the axoneme constitution, the fibrous sheath composition and activity also appeared impaired, especially with the dysregulation of proteins relative to local energy production like ALDOA (aldolase A), HK3 (hexokinase 3), and DYL2 (dynein light chain 2). ALDOA and HK3 would be involved in the flagellum glycolysis process needed for local ATP production (Krisfalusi et al., 2006;Nakamura et al., 2008), and DYL2 in the response of the CA2+ wave responsible for flagellum beating (Mizuno et al., 2012). Similarly, ENO1, present in the tail of sperm cells, is a glycolytic enzyme regulating enzyme activity to produce the energy in microtubules and to protect male gametes against oxidative stress (Park et al., 2013, 2019). ALDOA, HK3, and DYL2 were less abundant in SF animals, and ENO1 was more degraded in SF roosters, suggesting a reduction in local energy for flagellum movement and beating, and is consistent with the observed reduction of mass motility in SF individuals. PCA analysis suggests a positive correlation between mass motility and ALDOA, TCP1, DYL2, and HK3 (Figure 3). However, correlation analysis implies large sample size (Bujang and Baharum, 2016) and, thus, these putative correlations should be validated on a larger sample size, by immunoblot for instance.
Our data also revealed numerous DAP involved in mitochondria integrity and activity such as CS, SPATA18, ACAD9/L, OAT, ATP5A1, SOD2, and CYCS (Figure 5). Some of these actors, such as CYCS (cytochrome C) or SOD2 (superoxide dismutase 2), are known to be involved in the oxygen stress response of sperm cells (Wang et al., 2003; Yan et al., 2014). High abundance of OAT (ornithine aminotransferase) and ATP5F1A (ATP synthase F1 subunit alpha) has been reported in high-quality sperm in bovine and human (D’Amours et al.,
2019; Panner Selvam et al., 2019). Obviously, impairment in
mitochondria integrity and activity may impact the whole-cell physiology, including its motility. Several proteins involved in the energy transduction, such as CKB (creatine kinase B-type), was less abundant in SF roosters. The abundance of CKB is linked with sperm cell maturity in mammals (WHO, 2010), and its abundance is linked to sperm motility in mammals (Parte et al., 2012) and fish (Dietrich et al., 2016). This finding underlines the importance of energy transduction for chicken sperm functions, and not only the energy production.
Interestingly, proteomic approaches developed here also revealed dysregulations in molecular pathways linked to events occurring in the female tracts, and not accessed by classical in vitro semen quality evaluation, as performed here. For instance, our data revealed a higher level of ANXA1 (annexin A1) in SF animals. The presence of ANXA1 has been reported in seminal plasma in mammals (Candenas and Chianese, 2020), and in chickens (Labas et al., 2015;Li et al., 2020). Sperm surface annexins have been associated with the adhesion of sperm to oviductal cells in mammals in order to hold sperm in oviductal
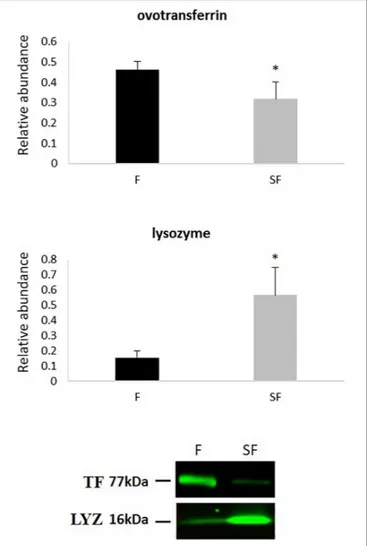
FIGURE 5 | Putative localization of proteins identified as relative to meat-line rooster fertility. Peptidoforms resulting from protein degradation revealed by ICM-MS are noted with asterisks. Green indicates proteins more abundant in fertile animals, and red represents proteins and peptidoforms more abundant in subfertile roosters. Underlined proteins are the one present in chicken seminal plasma (Labas et al., 2015).
reservoir (Ignotz et al., 2007;Teijeiro et al., 2009). In chickens, sperm storage into the female tract occurs during weeks within sperm storage tubules (King et al., 2002). Thus, the reduction of ANXA1 in SF sperm may sign the reduction of sperm capacities to be stored into the female tract. Furthermore, our data reported a high amount of APOA1 in SF animals. APOA1 has been reported in chicken seminal plasma in higher quantity in SF animals (Labas et al., 2015), suggesting a differential impact of seminal plasma in sperm maturation. In mammals, APOA1 is present in the sperm head and known to induce cholesterol efflux in spermatozoa necessary for sperm capacitation (Kwon
et al., 2014). The modification of the APOA1 amount in
chicken sperm in relation with the fertility suggests a sperm maturation deregulation. Moreover, in humans, a decline of sperm motility was observed when sperm APOA1 was inhibited by the presence of antibodies (Chi et al., 2018), suggesting a decrease of sperm motility subsequently to the reduction of sperm maturation. Finally, multiple proteins are known to be involved in the oocyte–sperm interaction in mammals such as the chaperone HSPA2 (Redgrove et al., 2012), LYZ (Herrero
et al., 2005; Sun et al., 2011), and ADAM32 (Vicens et al.,
sperm cell surface and that its neutralization in male rats induces male infertility, by impairing acrosome reaction (Sun et al.,
2011;Narmadha and Yenugu, 2016). Actually, LYZ abundance
observed by immunoblot was not statistically correlated with any of the sperm quality parameters testedin vitro (Supplementary
Data 4), which were all indicators of motility abilities and not of the acrosome integrity. Testing the acrosome functionality in vitro is challenging in chicken sperm (Lemoine et al., 2008) and not classically performed to evaluate semen quality. In this context, it would be interesting to investigate if LYZ abundance could represent an indirect measure of acrosome performance. Additionally, whereas not directly involved in oocyte–sperm interaction, PDE10 is essential to acrosome reaction and thus to oocyte–sperm fusion in mammals (Maréchal et al., 2017). Similar functions could be expected in chicken sperm. Another example with the mammalian equivalent of TF, the lactoferrin (LT), has been reported to be expressed by the epididymis, capable of sperm binding (Jin et al., 1997), increasing the membrane functionality of cryopreserved sperm (Martins et al., 2018), and modulating the oocyte–sperm interaction (Zumoffen et al., 2015). Thus, similar functions could be assumed for avian equivalent, the TF, which may also be involved in the oocyte–sperm interaction, and its reduction in sperm from SF roosters may sign a putative dysregulation of oocyte recognition by sperm cells in SF animals. Further investigations will be necessary to explore the role of these proteins in oocyte–sperm interaction in chicken.
Collectively, our data revealed that the fertility reduction observed in some meat-type roosters may be partly related to the decrease of sperm mass motility. However, among the 50 proteins newly revealed by the developed proteomic strategies and linked for the first time to the chicken fertility status, not all appeared directly relative to motility defects. In fact, other molecular pathways seemed to be impaired, including mitochondria functions, sperm maturation, and events occurring into the female tract, including storage as well as oocyte–sperm interaction. Therefore, our data confirmed the complexity of sperm-fertilizing capacity, a phenomenon not classically revealed byin vitro semen quality evaluation. Thus, it is crucial to obtain a large overview of the sperm proteome at the individual level to decipher the maximum of the mechanisms involved in sperm-fertilizing capacity. Here, we showed that ICM-MS and GeLC-MS/MS approaches were complementary to discriminate animals according to their fertility status based on multiple markers (peptidoforms and proteoforms) and to identify impairments into sperm biological pathways, respectively. Among the proteins identified here, some, such as ENO1, are also known as fertility markers in bull sperm cells (Park et al., 2013, 2019). Thus, these data are thus highly valuable to better understand the molecular processes involved in chicken sperm-fertilizing abilities, but also in the identification of putative robust male fertility biomarkers shared by different animal species.
DATA AVAILABILITY STATEMENT
The datasets presented in this study can be found in online repositories. The names of the repository/repositories and
accession number(s) can be found in the article/Supplementary
Material.
ETHICS STATEMENT
All experiments were carried out in accordance with the European welfare and the French Direction of Veterinary Services regulations (agreement number C37–175-1) as previously described.
AUTHOR CONTRIBUTIONS
EB designed the research. LS, AT, IG, LC, A-PT-G, and VL performed the research. AVC, DT, EB, and VL analyzed the data. AVC, LS, VL, and EB wrote the manuscript. All authors contributed to the article and approved the submitted version.
FUNDING
This work was supported by the French National Infrastructure of Research CRB anim funded by the “Investissements d’avenir,” ANR-11-INBS-0003 and from the French National Institute of Agronomic and Environmental Research (INRAe). The high-resolution mass spectrometer was financed (SMHART project) by the European Regional Development Fund (ERDF), the Conseil Régional du Centre, the French National Institute of Agronomic and Environmental Research (INRAe), and the French National Institute of Health and Medical Research (Inserm).
ACKNOWLEDGMENTS
We would like to thank the personnel of avian experimental unit (UE-PEAT, INRAe, Nouzilly).
SUPPLEMENTARY MATERIAL
The Supplementary Material for this article can be found online at: https://www.frontiersin.org/articles/10.3389/fcell.2021. 655866/full#supplementary-material
Supplementary Data 1 | ICM-MS differential analysis. Each mass represents one peak and the difference between fertile (F) and subfertile (SF) animals (n = 9) was by non-parametric Mann-Whitney or Wilcoxon test to determine the p-value. Supplementary Data 2 | DAP revealed by GeLC-MS/MS included in PCA analysis. Only DAP with a gene description and a gene symbol not corresponding to LOC were included.
Supplementary Data 3 | PCA analysis of GeLC-MS/MS. PCA analysis was conducted based on all the list of 84 DAP revealed by GeLC-MS/MS, with a preferential selection of SC differential.
Supplementary Data 4 | Correlation analysis of western-blot abundance quantifications of ovotransferrin (WB_TF) and lyzosyme (WB_LYZ), fertility rate and in vitro semen quality evaluation parameters. Square including dot presents significant correlation (p< 0.05). Dot color and intensity corresponds to correlation direction and strength, respectively.
REFERENCES
Allaire, J. J. (2015).RStudio: Integrated development environment for R. Boston: RStudio, Inc.
Blesbois, E., Grasseau, I., Seigneurin, F., Mignon-Grasteau, S., Saint Jalme, M., and Mialon-Richard, M. M. (2008). Predictors of success of semen cryopreservation in chickens.Theriogenology 69, 252–261. doi: 10.1016/j.theriogenology.2007. 09.019
Bracke, A., Peeters, K., Punjabi, U., Hoogewijs, D., and Dewilde, S. (2018). A search for molecular mechanisms underlying male idiopathic infertility.Reprod. Biomed. Online 36, 327–339. doi: 10.1016/j.rbmo.2017.12.005
Brackley, K. I., and Grantham, J. (2011). Interactions between the actin filament capping and severing protein gelsolin and the molecular chaperone CCT: Evidence for nonclassical substrate interactions. Cell Stress Chaperones 16, 173–179. doi: 10.1007/s12192-010-0230-x
Brillard, J. P., and McDaniel, G. R. (1985). The reliability and efficiency of various methods for estimating spermatozoa concentration.Poult. Sci. 64, 155–158. doi: 10.3382/ps.0640155
Bujang, M. A., and Baharum, N. (2016). Sample Size Guideline for Correlation Analysis.World J. Soc. Sci. Res. 3:37. doi: 10.22158/wjssr.v3n1p37
Burrows, W. H., and Quinn, J. P. (1937). The Collection of Spermatozoa from the Domestic Fowl and Turkey. Poult. Sci. 16, 19–24. doi: 10.3382/ps.01 60019
Candenas, L., and Chianese, R. (2020). Exosome composition and seminal plasma proteome: A promising source of biomarkers of male infertility.Int. J. Mol. Sci. 21:7022. doi: 10.3390/ijms21197022
Castaneda, J. M., Miyata, H., Archambeault, D. R., Satouh, Y., Yu, Z., Ikawa, M., et al. (2020). Mouse t-complex protein 11 is important for progressive motility in sperm.Biol. Reprod. 102, 852–862. doi: 10.1093/biolre/ioz226
Chi, X., Xiang, D., Liang, S., Hu, C., and Wang, C. (2018). Apolipoprotein A1 localization in sperms and its antibody’s effect on human sperm function. Chinese J. Lab. Med. 41, 664–668.
Cox, J., Hein, M. Y., Luber, C. A., Paron, I., Nagaraj, N., and Mann, M. (2014). Accurate proteome-wide label-free quantification by delayed normalization and maximal peptide ratio extraction, termed MaxLFQ.Mol. Cell. Proteomics 13, 2513–2526. doi: 10.1074/mcp.M113.031591
D’Amours, O., Calvo, É, Bourassa, S., Vincent, P., Blondin, P., and Sullivan, R. (2019). Proteomic markers of low and high fertility bovine spermatozoa separated by Percoll gradient.Mol. Reprod. Dev. 86, 999–1012. doi: 10.1002/ mrd.23174
David, I., Kohnke, P., Lagriffoul, G., Praud, O., Plouarboué, F., Degond, P., et al. (2015). Mass sperm motility is associated with fertility in sheep.Anim. Reprod. Sci. 161, 75–81. doi: 10.1016/j.anireprosci.2015.08.006
Deutsch, E. W., Overall, C. M., Van Eyk, J. E., Baker, M. S., Paik, Y. K., Weintraub, S. T., et al. (2016). Human Proteome Project Mass Spectrometry Data Interpretation Guidelines 2.1.J. Proteome Res. 15, 3961–3970. doi: 10. 1021/acs.jproteome.6b00392
Dietrich, M. A., Dietrich, G. J., Mostek, A., and Ciereszko, A. (2016). Motility of carp spermatozoa is associated with profound changes in the sperm proteome. J. Proteomics 138, 124–135. doi: 10.1016/j.jprot.2016.02.029
Druart, X., Rickard, J. P., Tsikis, G., and de Graaf, S. P. (2019). Seminal plasma proteins as markers of sperm fertility.Theriogenology 137, 30–35. doi: 10.1016/ j.theriogenology.2019.05.034
FAO (2020).Overview of global meat market developments in 2019. Rome: FAO. Filzmoser, P., and Walczak, B. (2014). What can go wrong at the data normalization
step for identification of biomarkers?J. Chromatogr. A. 1362, 194–205. doi: 10.1016/j.chroma.2014.08.050
Gautron, J., Hincke, M. T., Panheleux, M., Garcia-Ruiz, J. M., Boldicke, T., and Nys, Y. (2001). Ovotransferrin is a matrix protein of the hen eggshell membranes and basal calcified layer.Connect. Tissue Res. 42, 255–267. doi: 10.3109/03008200109016840
Gibb, S., and Strimmer, K. (2012). Maldiquant: A versatile R package for the analysis of mass spectrometry data.Bioinformatics 28, 2270–2271. doi: 10.1093/ bioinformatics/bts447
Gil, J., and Werman, M. (1993). Computing 2-D Min, Median, and Max Filters. IEEE Trans. Pattern Anal. Mach. Intell. 15, 504–507. doi: 10.1109/34.211471 Herrero, M. B., Mandal, A., Digilio, L. C., Coonrod, S. A., Maier, B., and Herr, J. C.
(2005). Mouse SLLP1, a sperm lysozyme-like protein involved in sperm-egg
binding and fertilization.Dev. Biol. 284, 126–142. doi: 10.1016/j.ydbio.2005. 05.008
Ignotz, G. G., Cho, M. Y., and Suarez, S. S. (2007). Annexins are candidate oviductal receptors for bovine sperm surface proteins and thus may serve to hold bovine sperm in the oviductal reservoir.Biol. Reprod. 77, 906–913. doi: 10.1095/biolreprod.107.062505
Jin, Y. Z., Bannai, S., Dacheux, F., Dacheux, J. L., and Okamura, N. (1997). Direct evidence for the secretion of lactoferrin and its binding to sperm in the porcine epididymis.Mol. Reprod. Dev. 47, 490–496. doi: 10.1002/(sici)1098-2795(199708)47:4
Jodar, M., Soler-Ventura, A., and Oliva, R. (2017). Semen proteomics and male infertility.J. Proteomics 162, 125–134. doi: 10.1016/j.jprot.2016.08.018 Keller, A., Nesvizhskii, A. I., Kolker, E., and Aebersold, R. (2002). Empirical
statistical model to estimate the accuracy of peptide identifications made by MS/MS and database search.Anal. Chem. 74, 5383–5392. doi: 10.1021/ ac025747h
King, L. M., Brillard, J. P., Garrett, W. M., Bakst, M. R., and Donoghue, A. M. (2002). Segregation of spermatozoa within sperm storage tubules of fowl and turkey hens.Reproduction 123, 79–86. doi: 10.1530/rep.0.1230079
Kovac, J. R., Pastuszak, A. W., and Lamb, D. J. (2013). The use of genomics, proteomics, and metabolomics in identifying biomarkers of male infertility. Fertil. Steril. 99, 998–1007. doi: 10.1016/j.fertnstert.2013.01.111
Krisfalusi, M., Miki, K., Magyar, P. L., and O’Brien, D. A. (2006). Multiple glycolytic enzymes are tightly bound to the fibrous sheath of mouse spermatozoa.Biol. Reprod. 75, 270–278. doi: 10.1095/biolreprod.105.049684
Kwon, W. S., Rahman, M. S., Lee, J. S., Kim, J., Yoon, S. J., Park, Y. J., et al. (2014). A comprehensive proteomic approach to identifying capacitation related proteins in boar spermatozoa.BMC Genomics 15:897. doi: 10.1186/1471-2164-15-897
Labas, V., Grasseau, I., Cahier, K., Gargaros, A., Harichaux, G., Teixeira-Gomes, A. P., et al. (2015). Qualitative and quantitative peptidomic and proteomic approaches to phenotyping chicken semen.J. Proteomics 112, 313–335. doi: 10.1016/j.jprot.2014.07.024
Labas, V., Teixeira-Gomes, A. P., Bouguereau, L., Gargaros, A., Spina, L., Marestaing, A., et al. (2018). Intact cell MALDI-TOF mass spectrometry on single bovine oocyte and follicular cells combined with top-down proteomics: A novel approach to characterise markers of oocyte maturation.J. Proteomics 175, 56–74. doi: 10.1016/j.jprot.2017.03.027
Lemoine, M., Grasseau, I., Brillard, J. P., and Blesbois, E. (2008). A reappraisal of the factors involved in in vitro initiation of the acrosome reaction in chicken spermatozoa.Reproduction 136, 391–399. doi: 10.1530/REP-08-0094 Li, Y., Sun, Y., Ni, A., Shi, L., Wang, P., Isa, A. M., et al. (2020). Seminal Plasma
Proteome as an Indicator of Sperm Dysfunction and Low Sperm Motility.Mol. Cell. Proteomics 19, 1035–1046. doi: 10.1074/mcp.ra120.002017
Liu, H., Sadygov, R. G., and Yates, J. R. (2004). A model for random sampling and estimation of relative protein abundance in shotgun proteomics.Anal. Chem. 76, 4193–4201. doi: 10.1021/ac0498563
Maréchal, L., Guillemette, C., Goupil, S., Blondin, P., Leclerc, P., and Richard, F. J. (2017). Cyclic nucleotide phosphodiesterases in human spermatozoa and seminal fluid: Presence of an active PDE10A in human spermatozoa.Biochim. Biophys. Acta Gen. Subj. 1861, 147–156. doi: 10.1016/j.bbagen.2016.11.006 Martins, H. S., da Silva, G. C., Cortes, S. F., Paes, F. O., Martins Filho, O. A., Araujo,
M. S. S., et al. (2018). Lactoferrin increases sperm membrane functionality of frozen equine semen.Reprod. Domest. Anim. 53, 617–623. doi: 10.1111/rda. 13148
Mizuno, K., Shiba, K., Okai, M., Takahashi, Y., Shitaka, Y., Oiwa, K., et al. (2012). Calaxin drives sperm chemotaxis by Ca2+-mediated direct modulation of a dynein motor.Proc. Natl. Acad. Sci. U S A. 109, 20497–20502. doi: 10.1073/ pnas.1217018109
Nakamura, N., Shibata, H., O’Brien, D. A., Mori, C., and Eddy, E. M. (2008). Spermatogenic cell-specific type 1 hexokinase is the predominant hexokinase in sperm.Mol. Reprod. Dev. 75, 632–640. doi: 10.1002/mrd.20791
Narmadha, G., and Yenugu, S. (2016). Immunization against lysozyme-like proteins affect sperm function and fertility in the rat.J. Reprod. Immunol. 118, 100–108. doi: 10.1016/j.jri.2016.11.001
Nesvizhskii, A. I., Keller, A., Kolker, E., and Aebersold, R. (2003). A statistical model for identifying proteins by tandem mass spectrometry.Anal. Chem. 75, 4646–4658. doi: 10.1021/ac0341261