Publisher’s version / Version de l'éditeur:
Vous avez des questions? Nous pouvons vous aider. Pour communiquer directement avec un auteur, consultez la première page de la revue dans laquelle son article a été publié afin de trouver ses coordonnées. Si vous n’arrivez pas à les repérer, communiquez avec nous à [email protected].
Questions? Contact the NRC Publications Archive team at
[email protected]. If you wish to email the authors directly, please see the first page of the publication for their contact information.
https://publications-cnrc.canada.ca/fra/droits
L’accès à ce site Web et l’utilisation de son contenu sont assujettis aux conditions présentées dans le site LISEZ CES CONDITIONS ATTENTIVEMENT AVANT D’UTILISER CE SITE WEB.
33rd Annual General Conference of the Canadian Society for Civil Engineering
[Proceedings], pp. 210-1-210-13, 2005-06-01
READ THESE TERMS AND CONDITIONS CAREFULLY BEFORE USING THIS WEBSITE.
https://nrc-publications.canada.ca/eng/copyright
NRC Publications Archive Record / Notice des Archives des publications du CNRC :
https://nrc-publications.canada.ca/eng/view/object/?id=c521faa7-03e9-4899-a674-e40959ad1f3a https://publications-cnrc.canada.ca/fra/voir/objet/?id=c521faa7-03e9-4899-a674-e40959ad1f3a
NRC Publications Archive
Archives des publications du CNRC
This publication could be one of several versions: author’s original, accepted manuscript or the publisher’s version. / La version de cette publication peut être l’une des suivantes : la version prépublication de l’auteur, la version acceptée du manuscrit ou la version de l’éditeur.
Access and use of this website and the material on it are subject to the Terms and Conditions set forth at
Field performance of a concrete pipe culvert installed using standard
installations
Field performance of a concrete pipe culvert installed
using standard installations
Smeltzer, P.D.; Daigle, L.
NRCC-48332
A version of this document is published in / Une version de ce document se trouve dans :
33
rdAnnual General Conference of the Canadian Society for Civil Engineering,
Toronto, Ontario, June 2-4, 2005, pp. 210-1 – 210-13
33d Annual General Conference of the Canadian Society for Civil Engineering
33eCongrès général annuel de la Société canadienne de génie civil
Toronto, Ontario, Canada
June 2-4, 2005 / 2-4 juin 2005
FIELD PERFORMANCE OF A CONCRETE PIPE CULVERT INSTALLED
USING STANDARD INSTALLATIONS
P.D. Smeltzer1andL. Daigle2
1. Ontario Concrete Pipe Association, Burlington, ON, Canada
2. National Research Council of Canada, Institute for Research in Construction, Ottawa, ON, Canada
ABSTRACT: In August 2000, a concrete pipe culvert of 1370mm inside diameter was installed under a truck route in the former Regional Municipality of Ottawa-Carleton (now City of Ottawa) using the Standard Installations method. The project demonstrated two installation conditions, known as Type 2 and Type 3. In order to evaluate the pipe performance and verify the Standard Installations theory, two (2) pipe sections were instrumented to evaluate the loading conditions and enable a comparison of the Standard Installations theory. The performance monitoring conducted over a three-year period showed good correlation with the Standard Installations theory. The measured performance of the pipe from the test site compared to the predicted performance for Standard Installations has resulted in some very informative findings on the interaction between pipe and soil, and provides the owners of infrastructure with design options for concrete pipe. This research offers a cost effective alternative to the current design method developed more than seventy years ago.
1. INTRODUCTION
The required supporting strength of a buried concrete pipe is affected by the total load that is imposed upon the pipe and the quality of the supporting condition provided by the embedment soils. The installation conditions and the pipe embedment have a significant impact on the magnitude of the load that the pipe must carry, thus the greater the knowledge on the soil/pipe interaction, the more accurate and fiscally accountable concrete pipe design and installation becomes.
The current Ontario Provincial Standard Specifications (OPSS) for concrete pipe design and installation is based on the Marston-Spangler theory (indirect design method) for earth loads in trench and embankment installation conditions. This procedure is based on:
1. Determining the moment that will occur at the pipe invert under a specified loading condition based on anticipated field conditions (i.e. earth load, live load, installation parameters, bedding factor)
2. Determining the design load (D-Load) that produces the same moment in the pipe through the utilization of the three-edge bearing test.
3. Designing the pipe including the reinforcing steel to support the design load.
Although this method has been the standard practice since the early 1900’s, much of the research available today suggest those theories to be overly conservative due to the assumptions associated with limited knowledge of the day on soil/pipe interaction, specifically the inability to account for the benefit of the lateral supporting characteristics of the embedment soils. Research over the past twenty years, on the interaction between rigid pipe and embedment, has led to the development of an enhanced design
method acknowledged as a direct design method for rigid concrete pipe and its embedment systems – Standard Installation Direct Design (SIDD).
The direct design method determines the actual moments, thrusts, and shears in the buried pipe. This criterion is then used as the basis for the design of the reinforcing steel needed in a concrete pipe to adequately resist those forces. Furthermore, the direct design method, which is based on finite element model analysis, enables the evaluation of various installation loading conditions as part of the design process.
In August 2000, a concrete pipe culvert of 1370mm inside diameter was installed under a truck route in the former Regional Municipality of Ottawa-Carleton (now City of Ottawa) using the SIDD method. Of the four standard conditions developed using finite element model analysis, the project demonstrated two installation conditions, known as Type 2 and Type 3. In order to evaluate the pipe performance and verify the SIDD theory, two (2) pipe sections were instrumented to evaluate the loading conditions and enable a comparison between field measurements and the SIDD theory.
2. COMPARISION BETWEEN MARSTON-SPANGLER AND STANDARD INSTALLATION Marston-Spangler Method
The traditional design method for circular concrete pipe is based on the Marston-Spangler Method developed through work by Anson Marston and Merlin Spangler commencing in the 1910’s. The indirect design method, which relies on the Marston-Spangler theory for earth loads, is identified as indirect as the actual pipe strength required for a given installation is determined through three-edge bearing tests undertaken to confirm the pipe strength design by the manufacturer.
The design process used includes the following steps:
• Calculate the earth (dead) load and the traffic (live) load on the pipe.
• Select the bedding type to be used and determine the bedding factor.
• Select the appropriate factor of safety.
• Select the required pipe three-edge bearing strength.
Design Loads
The dead load is calculated using the Marston load theory
W = CγB2
where, W = backfill load per unit length
C = load factor
γ = unit weight of backfill material
B = trench width, Bd, at top of pipe for trench condition, or pipe outside width, Bc, for
embankment condition
The load factor, C, varies based on Rankine’s active ratio of lateral to vertical soil pressure, the height of the backfill above the pipe, the height of plane of equal settlement, the trench width at top of pipe, the horizontal outside width of pipe, the coefficient of friction between the trench wall and the backfill material and the coefficient of internal friction of the backfill material.
Live loads are based on the transient load expected above the pipe. For the highway condition, the Canadian Highway Bridge Design Code (CSA 2000) provides guidance to the designer.
The Marston – Spangler indirect design method uses the bedding factor, Bf, to translate the three-edge
bearing strength of pipe to the actual design conditions, as follows:
T.E.B. = W
Bf
In Ontario (OPSD 807.01 and 807.03), the calculation of the variable bedding factors are based on bedding factors of 2.8 for Class A, 1.9 for Class B, and 1.5 for Class C installations.
Factor of Safety
Factors of Safety are used in the design to account for the variability in manufacturing and installation of concrete pipe. For reinforced circular concrete pipe, CSA A257.2 Series-03 identifies the Factor of Safety as 1 for the 0.3mm design, and 1.25 or 1.5, based on pipe class, for the ultimate pipe strength. The required three-edge bearing strength of pipe is expressed as follows:
Bf x Di WE + WL D-load >
Standard Installations Design Method
In 1970, the American Concrete Pipe Association (ACPA) began a long-range research project on the interaction of buried concrete pipe and soil. The research resulted in the development of SPIDA, a finite element model for the direct design of buried concrete pipe. Using SPIDA, a large number of finite element computer simulations were conducted, leading to the development of Standard Installations Direct Design and ultimately four standard installations. Field studies were used to verify the four Standard Installations and in 1993, the ACPA introduced the new design process to the industry, and the American Society of Civil Engineers (ASCE) adopted the standard through ASCE 15-93 (ASCE/ANSI 1993). In 2000, CAN/CSA S6-00 Canadian Highway Bridge Design Code (CHBDC) included Standard Installation for the design and installation of buried structures (CSA 2000).
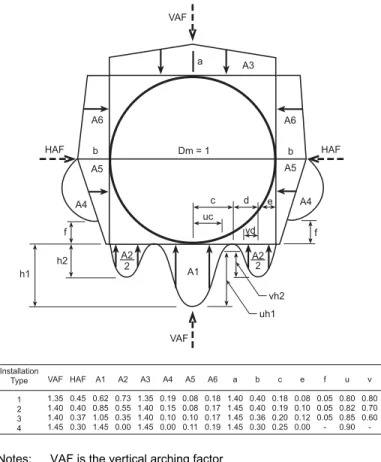
Standard Installations Direct Design considers soil-pipe interaction and uses the Heger Earth Pressure Distributions to determine the earth pressures for a given installation (Fig. 1). The concept of the vertical arching factor (VAF) and horizontal arching factor (HAF) was introduced by Heger to determine the total vertical and horizontal loads. The four Standard Installations range from Type 1 (C1), which is the highest quality installation, to Type 4 (C4), the lowest quality installation. Type C1 to Type C4 are the designations used in the CHBDC. The four Standard Installations are differentiated by the soil materials permitted and the level of compaction required. The soil properties and levels of compaction are illustrated in Table 1. The Type 1 installation utilizes only granular materials for bedding and a high level of compaction is required. Conversely, a Type 4 installation permits any soil type for bedding, and requires compaction for only clay materials.
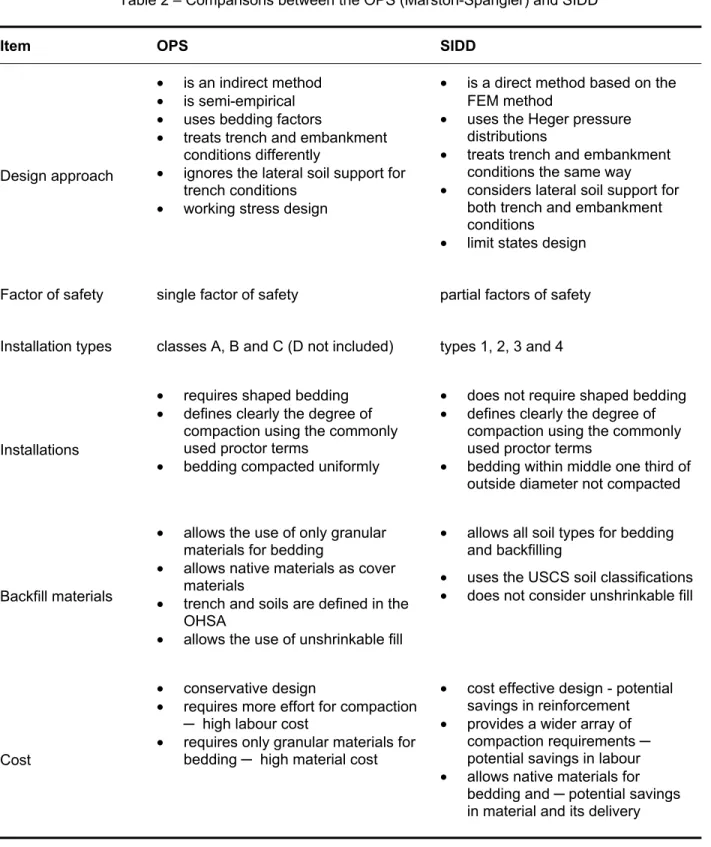
The Standard Installation design permits the designer to utilize native materials under known conditions. It is a departure from the current practice of using only granular materials for bedding of concrete pipe. A comparison of the Marston-Spangler and Standard Installations design methods are presented in Table 2.
VAF A3 A6 HAF HAF A6 b A5 A4 h1 A1 A2 2 vh2 uh1 VAF h2 f A2 2 c d f b A5 A4 e uc a Dm = 1 vd Installation Type 1 2 3 4 VAF 1.35 1.40 1.40 1.45 HAF 0.45 0.40 0.37 0.30 A1 0.62 0.85 1.05 1.45 A2 0.73 0.55 0.35 0.00 A3 1.35 1.40 1.40 1.45 A4 0.19 0.15 0.10 0.00 A5 0.08 0.08 0.10 0.11 A6 0.18 0.17 0.17 0.19 a 1.40 1.45 1.45 1.45 b 0.40 0.40 0.36 0.30 c 0.18 0.19 0.20 0.25 e 0.08 0.10 0.12 0.00 f 0.05 0.05 0.05 -u 0.80 0.82 0.85 0.90 v 0.80 0.70 0.60
-Notes: VAF is the vertical arching factor HAF is the horizontal arching factor
Figure 1 – Heger Pressure Distribution Diagram and Coefficients
Degree of compaction and soil type
Installation
Bedding thickness
(tb) Haunch and outer
bedding Lower side
Type 1 (C1) tb≥ D0/24, and tb≥ 75 mm
For rock foundation:
tb≥ D0/12, and tb≥ 150 mm
95% SW 90% SW, 95% ML or
100% CL
Type 2 (C2) tb ≥ D0/24, and tb ≥ 75 mm
For rock foundation:
tb≥ D0/12, and tb≥ 150 mm
90% SW or 95% ML 85% SW, 90% ML or
95% CL
Type 3 (C3) tb≥ D0/24, and tb≥ 75 mm
For rock foundation:
tb≥ D0/12, and tb≥ 150 mm
85% SW, 90% ML or 95% CL
85% SW, 90% ML or 95% CL
Type 4 (C4) No bedding required,
For rock foundation:
tb≥ D0/12, and tb≥ 150 mm
No compaction required, except for CL,
use 85% CL
No compaction required, except for
CL, use 85% CL Table 1 - Standard Installation Types
3. INSTALLATION AND MONITORING
In an effort to verify the Standard Installations design method for Ontario, in 2000 the Ontario Concrete Pipe Association (OCPA) approached the Ministry of Transportation (MTO) to determine if there was any
interest in reviewing the research conducted in the United States and initiating a pilot project. The MTO decided there was merit to this approach, and the OCPA and MTO approached the National Research Council of Canada (NRC) to participate in the research and act as the Project Manager.
The first phase of the project was a literature review that was completed in early 2000. The review indicated promise for the use of Standard Installation Direct Design for Ontario, and the project sponsors agreed to proceed to a pilot project. The OCPA approached the Regional Municipality of Ottawa-Carleton (now the City of Ottawa) to determine if a representative project was available in the Region. The criteria identified for a representative project included:
• A large diameter culvert installation with less than 2.0 m of cover and easy access to the pipe,
• A location where hydro and telephone were available for data capture and retrieval, and
• A truck route to ensure live load acting on the pipe.
The Region identified a site on Regional Road 19 – River Road in Osgoode. This project was the replacement of a corroded 1000mm corrugated steel pipe. The project design had been completed by the region, and a tender call was scheduled for summer 2000. The MTO, NRC, and OCPA reviewed this project, and it was agreed to move forward with the Regional Road 19 culvert replacement.
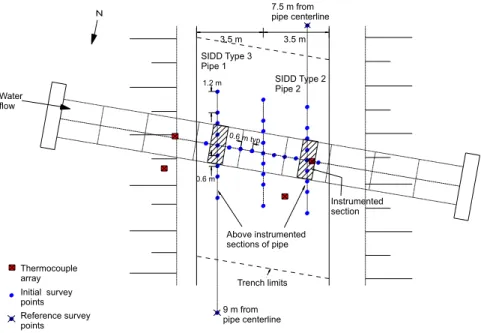
In August 2000, 20.6m of 1350mm reinforced concrete pipe was installed at the Regional Road 19 site. The project was designed to monitor Type 2 and Type 3 installations, with the west half of the road designed as a Type 2 and the east half of the road designed as a Type 3. An instrumented pipe was installed under the driving lanes on each side of the road centreline. The site plan of the instrumented concrete culvert is illustrated in Figure 2. The average depth of cover over the culvert was 1.5m.
The instrumentation was designed to gather information on the pipe and soil performance. Strain gauges were mounted on the reinforcing steel of the pipe during the pipe manufacture and used to determine the moments and trusts acting on the pipe. The pressure cells were the primary instruments to determine the soil-pipe interaction. The pressure cells were attached to the wall of the pipe, and buried in the pipe bedding and backfill material. The earth pressure readings were adjusted for environmental conditions with temperature obtained from the thermocouples and barometric pressure readings published by Environment Canada.
The culvert monitoring included:
• 40 embedded strain gauges (pipe)
• 12 embedded thermocouples (pipe)
• 18 earth pressure cells
• 38 buried thermocouples (soil)
• 3 TDR probes
• 3 thermal conductivity probes
A data logger was installed at the site and data was recorded for the strain gauges, pressure cells, embedded thermocouples and the TDR probes. Soil temperature was recorded every four hours and thermal conductivity was recorded four times per year.
In addition to the instrumented culvert, 37 survey pins were installed to enable the pavement surface elevation to be monitored. A field survey was completed four times per year for the duration of the three- year project.
The instrumented pipe installation was completed by a local contractor, under the direction of the NRC and the Region. Compaction tests were taken throughout the installation process using a Troxler nuclear gauge. The line and grade were set by the contractor; however, the Region checked the installation and tied the pipe and instrumentation using a total station survey prior to backfill.
The installation went very well. The only issue was a slight rotation of the instrumented pipe from vertical; with the Type 2 installation rotated 4 clockwise and the Type 3° installation rotated 10° counter-clockwise.
Table 2 – Comparisons between the OPS (Marston-Spangler) and SIDD
Item OPS SIDD
Design approach
• is an indirect method
• is semi-empirical
• uses bedding factors
• treats trench and embankment
conditions differently
• ignores the lateral soil support for
trench conditions
• working stress design
• is a direct method based on the
FEM method
• uses the Heger pressure
distributions
• treats trench and embankment
conditions the same way
• considers lateral soil support for
both trench and embankment conditions
• limit states design
Factor of safety single factor of safety partial factors of safety
Installation types classes A, B and C (D not included) types 1, 2, 3 and 4
Installations
• requires shaped bedding
• defines clearly the degree of
compaction using the commonly used proctor terms
• bedding compacted uniformly
• does not require shaped bedding
• defines clearly the degree of
compaction using the commonly used proctor terms
• bedding within middle one third of
outside diameter not compacted
Backfill materials
• allows the use of only granular
materials for bedding
• allows native materials as cover
materials
• trench and soils are defined in the
OHSA
• allows the use of unshrinkable fill
• allows all soil types for bedding
and backfilling
• uses the USCS soil classifications
• does not consider unshrinkable fill
Cost
• conservative design
• requires more effort for compaction
─ high labour cost
• requires only granular materials for
bedding ─ high material cost
• cost effective design - potential
savings in reinforcement
• provides a wider array of
compaction requirements ─
potential savings in labour
• allows native materials for
bedding and ─ potential savings
N 0.6 m Above instrumented sections of pipe 0.6 m typ. 3.5 m 3.5 m Instrumented section 1.2 m Trench limits Water flow SIDD Type 2 Pipe 2 SIDD Type 3 Pipe 1 Thermocouple array Reference survey points 9 m from pipe centerline 7.5 m from pipe centerline Initial survey points
Figure 2 – Site Plan of Instrumented Concrete Pipe
4. DISCUSSION OF FIELD PERFORMANCE Pressures
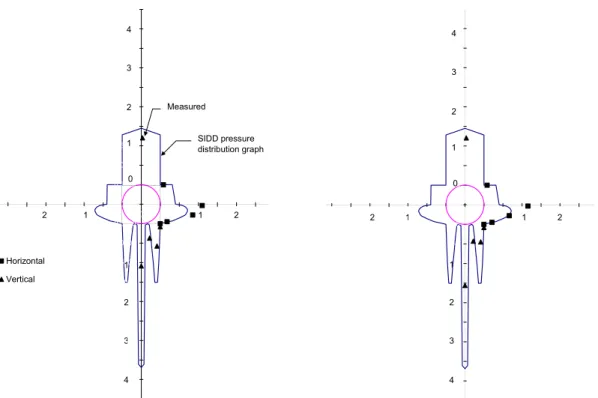
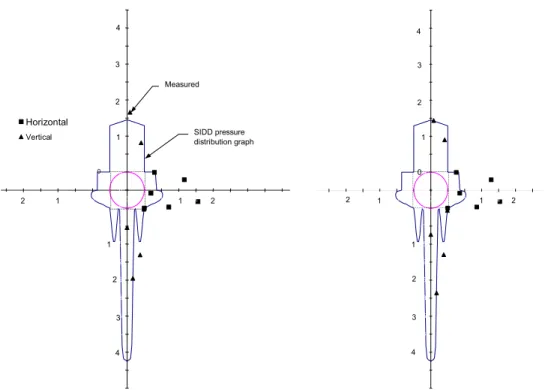
The field pressures were recorded and compared to the calculated SIDD values. Comparisons of the Type 2 and Type 3 pressure coefficients are presented in Figures 3 & 4. In general terms, the field pressures compared well to the pressures calculated for the top and springline locations. Measured field values for the pipe bottom for the Type 2 installation were 50% of the expected. Differences between the values were attributed to variations in installation. Of note was the variation in compaction effort. The Type 2 and Type 3 installations had compaction levels identified as 90% and 85%, standard proctor density respectively, however, the Region required the backfill material to be compacted to 100%. This effort may have resulted in higher than expected compaction of the haunch and bedding material. For example, the pressure measured for the Type 2 installation at the pipe bottom was closer to what would be expected for a Type 1 installation.
The measured values of Type 3 installation at the pipe bottom had greater variations than Type 2. This could be attributed to a need to re-set the instrumented pipe twice to ensure proper line and grade. The elevation was adjusted for the pipe by adding granular bedding by hand shovelling, which may have created less uniformity of contact between the pipe and the bedding. It is noteworthy that after the first winter, a redistribution of pressure occurred below the springline of the pipe, resulting in pressures more consistent with calculated values (see Fig. 5).
To summarize, although great care was taken to ensure an installation consistent with SIDD, the variability of results due to field installation was observed. In addition, the combined effects of temperature (frost) and groundwater conditions also created concerns relative to the field performance versus calculated SIDD values. Notwithstanding these issues, the installation showed favourable results when compared to calculated values.
SIDD Type 2, Sept.30, 2000, 1.5 months after Installation -5 -4.5 -4 -3.5 -3 -2.5 -2 -1.5 -1 -0.5 0 0.5 1 1.5 2 2.5 3 3.5 4 4.5 5 -3 2 -2 1 -1 0 1 1 2 2 3 1 2 3 4 0 1 2 3 4
SIDD Type 2, Feb 18, 2001, 6 months after Installation -5 -4.5 -4 -3.5 -3 -2.5 -2 -1.5 -1 -0.5 0 0.5 1 1.5 2 2.5 3 3.5 4 4.5 5 -3 2 -2 1 -1 0 1 1 2 2 3 1 2 3 4 0 1 2 3 4
Type 2, Aug. 18, 2001, 1 year after Installation and long term coefficeints -5.0000 -4.5000 -4.0000 -3.5000 -3.0000 -2.5000 -2.0000 -1.5000 -1.0000 -0.5000 0.0000 0.5000 1.0000 1.5000 2.0000 2.5000 3.0000 3.5000 4.0000 4.5000 5.0000 -3 -2 -1 0 1 2 3 4 Horizontal Vertical Long term Hor. Long term Ver.
1 1 1 2 2 2 3 4 0 1 2 3 4
SIDD Type 2, Aug. 18, 2000, Just after Installation
-5.0000 -4.5000 -4.0000 -3.5000 -3.0000 -2.5000 -2.0000 -1.5000 -1.0000 -0.5000 0.0000 0.5000 1.0000 1.5000 2.0000 2.5000 3.0000 3.5000 4.0000 4.5000 5.0000 -3 -2 -1 0 1 2 3 Horizontal Vertical 1 1 2 2 1 2 3 4 0 1 2 3 4 Measured SIDD pressure distribution graph
Aug. 18, 2000. Just after installation Sept. 30, 2000. 1.5 months after installation
Feb. 18, 2001. 6 months after installation Aug. 18, 2001. 1 year after installation and long-term coefficients
SIDD Type 3, Sept. 30, 2000, 1.5 months after Installation -5.5 -5 -4.5 -4 -3.5 -3 -2.5 -2 -1.5 -1 -0.5 0 0.5 1 1.5 2 2.5 3 3.5 4 4.5 5 -3 -2 -1 0 1 2 3 1 1 1 2 2 2 3 4 1 2 3 4 0
SIDD Type 3 , Feb 18, 2001, 6 months after Installation
-5.5 -5 -4.5 -4 -3.5 -3 -2.5 -2 -1.5 -1 -0.5 0 0.5 1 1.5 2 2.5 3 3.5 4 4.5 5 -3 -2 -1 0 1 2 3 1 1 1 2 2 2 3 4 1 2 3 4 0
SIDD Type 3 , Aug. 18, 2001, 1 year after Installation and final valu
-5.5 -5 -4.5 -4 -3.5 -3 -2.5 -2 -1.5 -1 -0.5 0 0.5 1 1.5 2 2.5 3 3.5 4 4.5 5 -3 -2 -1 0 1 2 3 Vertical Horizontal Final value Hor. Final value Ver.
1 1 1 2 2 2 3 4 1 2 3 4 0
SIDD Type 3, Aug. 18, 2000, Just after Installation
-5.5 -5 -4.5 -4 -3.5 -3 -2.5 -2 -1.5 -1 -0.5 0 0.5 1 1.5 2 2.5 3 3.5 4 4.5 5 -3 -2 -1 0 1 2 3 4 Horizontal Vertical 1 1 1 2 2 2 3 4 1 2 3 4 0 Measured SIDD pressure distribution graph
Aug. 18, 2000. Just after installation Sept. 30, 2000. 1.5 months after installation
Feb. 18, 2001. 6 months after installation Aug. 18, 2001. 1 year after installation and final value
Moments and Thrusts
Moments and thrusts occur in the wall of the concrete pipe as load is applied. In general terms, the moment at the top and bottom of the pipe will be positive and at the springline it will be negative. A negative thrust indicates the wall of the pipe is in compression.
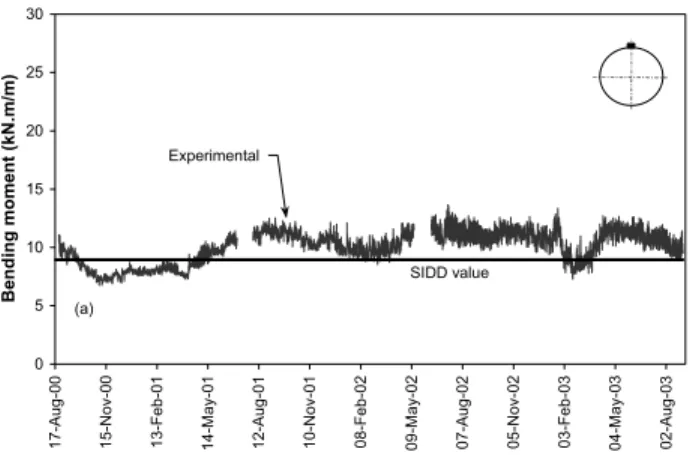
The measured values for moment in the Type 2 installation ranged from 11% to 36% of the SIDD values and in general, there was good agreement between field and calculated values. The comparison of the moments for the top of pipe is presented in Figure 6. For the Type 3 installation, the measured values ranged from 3% to 61% of the SIDD values, after the redistribution experienced after the first winter (Fig. 5).
The average values of thrust for the Type 2 installation ranged from 76% to 248% of calculated values, and for the Type 3 installation ranged from 44% to 125%. The comparison between measured values of thrust and calculated values was not good. Thrust calculations were corrected for concrete curing, shrinkage and creep.
In addition to a comparison between field values and calculated SIDD values, the installed values were compared to calculated values based on Marston-Spangler. The measured values showed better agreement, with moment values of 13% to 67% and thrust values of 29% to 96%. This demonstrates that installations following the SIDD method compare favourably to the tradition method, with less compaction effort. -20 -15 -10 -5 0 5 10 15 20 25 30 17- Aug-00 17-Nov -00 17-F eb-01 20-May -01 20- Aug-01 20-Nov -01 20-F eb-02 23-May -02 23- Aug-02 23-Nov -02 23-F eb-03 26-May -03 26- Aug-03 Time (Date) B e ndi ng mome nt ( k N .m/ m) (c) SIDD value Experimental
Figure 5 – Comparison of Moments at Bottom of Pipe for SIDD Type 3
0 5 10 15 20 25 30 17-A ug-00 15-N o v-00 13-F eb-01 14- May-01 12-A ug-01 10-N o v-01 08-F eb-02 09- May-02 07-A ug-02 05-N o v-02 03-F eb-03 04- May-03 02-A ug-03 Be nding m o m e nt (k N.m /m ) Experimental SIDD value (a)
Road Survey
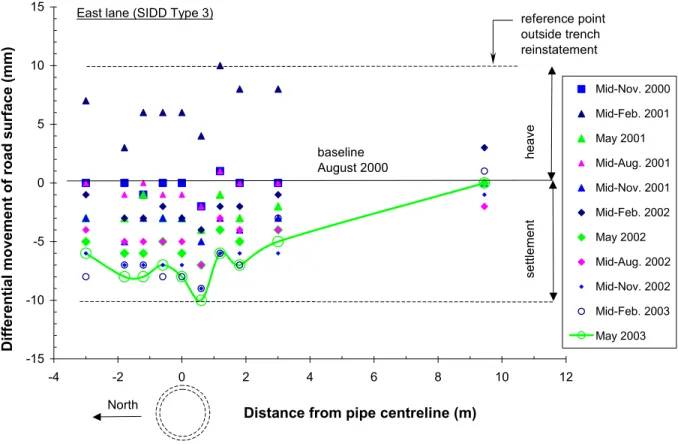
The summary of the road survey over the Type 3 installation is presented in Figure 7. In understanding the movement of road surface for Canada, consideration of the effects of frost and the culvert installation is required. The City of Ottawa survey personnel undertook field surveys on 3-month intervals. The east lane, under which the Type 3 installation is located, showed surface settlements and heaves within +/- 10mm and the west lane showed surface settlements and heaves of 8mm and 6mm, respectively. A reference pin located outside of the construction area indicated a 2mm settlement and 3mm heave. The magnitude of the movement is comparable to another experimental site in Ottawa, and is within the City of Ottawa By-Law governing road repairs of 12.5mm.
-15 -10 -5 0 5 10 15 -4 -2 0 2 4 6 8 10 12
Distance from pipe centreline (m)
Differential movement of road surface (mm)
Mid-Nov. 2000 Mid-Feb. 2001 May 2001 Mid-Aug. 2001 Mid-Nov. 2001 Mid-Feb. 2002 May 2002 Mid-Aug. 2002 Mid-Nov. 2002 Mid-Feb. 2003 May 2003 East lane (SIDD Type 3)
heave settlement baseline August 2000 reference point outside trench reinstatement North
Figure 7 - Differential Vertical Movement of Ground Surface, East Lane, SIDD Type 3
5. BENEFITS OF STANDARD INSTALLATIONS
Based on the experience gained on the Regional Road 19 project, the benefits derived from the use of Standard Installations were validated. These benefits include:
• The pipe-soil interaction is not currently recognized in the OPS design and the Regional Road 19
project determined the benefits related to this structure can be significant.
• The replacement of shaped bedding with uncompacted bedding for the centre-third of the pipe
• The design procedure of SIDD is aided by the use of software, and an indirect design method using the four Standard Installations is a practical method to determine the required pipe strength according to the installations under consideration.
• The Marston-Spangler method, when compared to SIDD has been found to be conservative. The
approach proposed in ACPA Design Data 40 results in pipe selection that is more adapted to the project under consideration.
• The SIDD method does not introduce any Health and Safety issues to the installation of culverts.
In addition to the items identified above, three factors may render the SIDD method more cost effective, including;
o Pipe manufacture,
o Bedding and backfill, and
o Installation and quality control.
The design of reinforced concrete pipe installations using SIDD has demonstrated a reduction of pipe strength requirements. This leads to the selection of a lower-class pipe resulting in savings of the materials used to manufacture the pipe.
Savings related to bedding and backfill material are anticipated due to the promotion of reuse of native soils and design based on the soils to be used. The current practice of imported granular materials for bedding material could be modified to take advantage of the SIDD design.
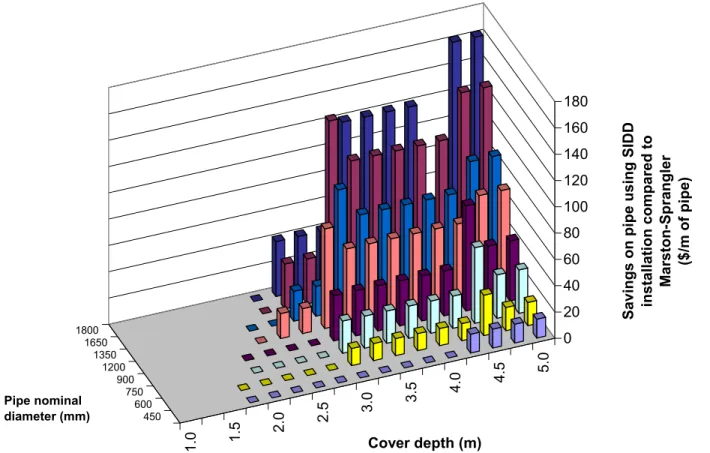
The installation of reinforced concrete pipe using SIDD removes the requirement to shape bedding and generally reduces compaction effort. This would result in savings to the contactor in the installation of the pipe. The cost savings for a trench installation using the SIDD method is illustrated in Figure 8.
Notwithstanding the benefits identified above, issues related to the impact of frost on underground installations need to be considered and addressed in current installation practice where shallow burial depths are encountered. The impact of frost was partially addressed in the regional Road 19 project; however, failure of pressure cells limited the knowledge that could have been gained. In Ontario, contractors have historically believed the more the compaction, the better the performance. SIDD does not follow this theory, and training will be required to ensure the compaction effort identified for the installation is followed.
6. CONCLUSIONS
The MTO, NRC, Region of Ottawa-Carleton and OCPA initiated to SIDD pilot project on region Road 19 in Ottawa to validate the SIDD design method for concrete pipe. The installation of a 1350mm reinforced concrete culvert was instrumented to determine the impacts of soil-pipe interaction, which is the basis of the theory used in the development of SIDD.
The pilot project demonstrated two Standard Installations, Type 2 and Type 3. The performance monitoring conducted over a three-year period showed, in general, good correlation of measured pressures and moments with the SIDD theory and demonstrated the adequacy of the design method. The measured performance of the pipe from the test site compared to the predicted performance for SIDD has resulted in some very informative findings on the interaction between pipe and soil, and provides the owners of infrastructure with design options for concrete pipe. This research is of interest to designers, engineers, and others involved in the design and construction of underground infrastructure.
The current practice, using the Marston-Spangler Method is conservative, and when compared to the SIDD method, benefits in pipe manufacture, bedding and backfill and installation were apparent for the SIDD method.
1.0 1.5 2.0 2.5 3.0 3.5 4.0 4.5 5.0 450 600 750 900 1200 1350 1650 1800 0 20 40 60 80 100 120 140 160 180
Savings on pipe using SIDD installation compared to
Marston-Sprangler
($/m of pipe)
Cover depth (m)
Pipe nominal diameter (mm)
Figure 8 – Savings on pipe cost using SIDD standard installation (trench condition)
7. REFERENCES
ASCE/ANSI. 1993. Standard Practice for Direct Design of Buried Precast Concrete Pipe Using Standard
Installations (SIDD). ANSI/ASCE 15-93. American Society of Civil Engineers/American National
Standards Institute.
ACPA 1993. Design Data (DD) 40 Standard Installations and Bedding Factors for the Indirect Design
Method. American Concrete Pipe Association, Irving, Texas, USA.
ACPA 1998. Concrete Pipe Handbook. American Concrete Pipe Association, Irving, Texas, USA.
CSA 2000. Canadian Highway Bridge Design Code, CAN/CSA-S6-00. Canadian Standards Association. CSA International, Toronto.
Daigle, L. 2004. Concrete Pipe Bedding Alternative to OPS - Final Report. Client Report B-5116.5, Institute for Research in Construction, National Research Council Canada, 70 pp.
OPSD 807.01. 1992. Specified Minimum Class of Pipe, Reinforced Concrete Pipe – Confined Trench
Class: 50-D; 65-D; 100-D; 140-D. Ontario Provincial Standard, ON., Canada.
OPSD 807.03. 1992. Specified Minimum Class of Pipe, Reinforced Concrete Pipe – Embankment Class: