Publisher’s version / Version de l'éditeur:
Procedia Manufacturing, 3, pp. 3745-3752, 2015
READ THESE TERMS AND CONDITIONS CAREFULLY BEFORE USING THIS WEBSITE. https://nrc-publications.canada.ca/eng/copyright
Vous avez des questions? Nous pouvons vous aider. Pour communiquer directement avec un auteur, consultez la première page de la revue dans laquelle son article a été publié afin de trouver ses coordonnées. Si vous n’arrivez pas à les repérer, communiquez avec nous à [email protected].
Questions? Contact the NRC Publications Archive team at
[email protected]. If you wish to email the authors directly, please see the first page of the publication for their contact information.
NRC Publications Archive
Archives des publications du CNRC
This publication could be one of several versions: author’s original, accepted manuscript or the publisher’s version. / La version de cette publication peut être l’une des suivantes : la version prépublication de l’auteur, la version acceptée du manuscrit ou la version de l’éditeur.
For the publisher’s version, please access the DOI link below./ Pour consulter la version de l’éditeur, utilisez le lien DOI ci-dessous.
https://doi.org/10.1016/j.promfg.2015.07.813
Access and use of this website and the material on it are subject to the Terms and Conditions set forth at
Data processing and analysis for the 2012 Canadian Forces 3D
anthropometric survey
Shu, Chang; Xi, Pengcheng; Keefe, Allan
https://publications-cnrc.canada.ca/fra/droits
L’accès à ce site Web et l’utilisation de son contenu sont assujettis aux conditions présentées dans le site LISEZ CES CONDITIONS ATTENTIVEMENT AVANT D’UTILISER CE SITE WEB.
NRC Publications Record / Notice d'Archives des publications de CNRC:
https://nrc-publications.canada.ca/eng/view/object/?id=828ecbbf-d18d-48ae-970e-9f8ffa9c453b https://publications-cnrc.canada.ca/fra/voir/objet/?id=828ecbbf-d18d-48ae-970e-9f8ffa9c453b
2351-9789 Crown Copyright © 2015 Published by Elsevier B.V. This is an open access article under the CC BY-NC-ND license (http://creativecommons.org/licenses/by-nc-nd/4.0/).
Peer-review under responsibility of AHFE Conference doi: 10.1016/j.promfg.2015.07.813
Procedia Manufacturing 3 ( 2015 ) 3745 – 3752
ScienceDirect
6th International Conference on Applied Human Factors and Ergonomics (AHFE 2015) and the
Affiliated Conferences, AHFE 2015
Data processing and analysis for the 2012 Canadian Forces 3D
anthropometric survey
Chang Shu
a,*, Pengcheng Xi
a, Allan Keefe
ba
National Research Council of Canada, Ottawa, Canada
b
Defence Research and Development Canada, Toronto, Canada
Abstract
The 2012 Canadian Forces Anthropometric Survey (CFAS 2012) is the first major 3D anthropometric survey of Canadian Forces personnel. 2200 full-body scans were conducted, together with traditional anthropometric measurements. This survey aims at providing accurate, detailed, and up-to-date body shape information for equipment design and procurement. In this paper, we describe the data processing and analysis of this dataset. This includes de-noising, template fitting, landmark identification, and statistical shape analysis. We also compare the military personnel with the general North American population using the CAESAR dataset.
© 2015 The Authors. Published by Elsevier B.V. Peer-review under responsibility of AHFE Conference.
Keywords: 3D anthropometry; Digital human modeling; Design tools
1. Introduction
Many procurement and acquisition problems in the armed forces, such as optimal fit of clothing, personal protective equipment, and workspace, rely on accurate anthropometric information [9, 10]. The last major anthropometric survey the Royal Canadian Air Force (RCAF) was conducted in 1985 and it only includes male pilots and aircrews [11]. Another survey was done in 1997 for the Land Forces [5]. With the exception of 611 head scans obtained in the 1997 survey, none of these surveys have 3D data. In 2012, taking advantage of the recent
* Corresponding author. Tel.: +1-613-993-0109; fax: +1-613-952-0215.
E-mail address: [email protected]
Crown Copyright © 2015 Published by Elsevier B.V. This is an open access article under the CC BY-NC-ND license (http://creativecommons.org/licenses/by-nc-nd/4.0/).
3746 Chang Shu et al. / Procedia Manufacturing 3 ( 2015 ) 3745 – 3752
development of 3D imaging technology, Defence Research and Development Canada (DRDC) conducted the first comprehensive 3D anthropometric survey for the CAF, scanning over 2200 subjects at different locations across Canada. In addition to the full-body scans, traditional 1-D measurements were also conducted.
3D body scanning allows us to represent detailed and accurate human shapes in a digital form. However, raw 3D scan data is not readily usable for extracting shape information for a population. Unlike traditional anthropometric data which consist of one-dimensional measurements, 3D anthropometric data come from digitizing the surface of the human body and are typically represented as surface meshes. Due to the limitations of the optical sensors, for example, occlusion and lighting conditions, the raw 3D mesh data are noisy and incomplete. Much processing is needed before any statistical analysis can be performed. In this work, we present geometry processing tools for preparing the raw data for shape analysis. Most of these tools were developed in computer graphics, computer vision, and pattern recognition [1, 7, 8, 15-20]. We show here that they are effective in characterizing human shape for applications that involve accommodation of human body shapes.
The fundamental measurements of the 3D anthropometry are 3D points represented as the x, y, and z coordinates in certain coordinate frames. These points represent the shape implicitly. However, different scans have different number of points and the points are not ordered in the same way. Performing statistical analysis requires a set of consistent measurements. In other words, we need to compare likewise measurements. This means that the data models have to be parameterized such that all of the models have the same number of points and points representing the same anatomical parts correspond to each other. This process is called data registration. Once we have a parameterization, multivariate statistics is applicable [4, 6, 21].
An effective way of establishing a correspondence among all the models is to fit a generic mesh model to each scan such that the key anatomical features are in correspondence [1]. Anthropometric landmarks placed on the subjects prior to scanning can be used to guide the deformation of the generic model to the scan. The problem can be formulated as a large-scale nonlinear optimization problem. Modern computer hardware and numerical algorithms allow us to solve this problem efficiently.
Finally, we perform principal component analysis (PCA) on the parameterized dataset. The main mode of variation of the body shape is analyzed. Through these analyses, we show that the space of the human body shape is spanned by a small number of basis vectors. Furthermore, the main mode of variations can be visualized through animating the shape changes along the PCA axes.
2. CFAS 2012 dataset
CFAS 2012 survey was conducted between February and December of the year. All together 2205 subjects were selected from all three service groups: the Combat Arms (CA), Royal Canadian Air Force (RCAF), and Royal Canadian Navy (RCN). Female represents 14.3% of the sample. Table 1 summarizes the number of samples from each group. The Human Solution’s Vitus XXL scanner was used for the full-body scans.
Table 1. Number of samples from each group.
Group CA RCAF RCN Male Female Anglophone Francophone
Number of Scans 847 876 482 1890 315 1574 576
4 standing and 2 seated postures were used for scanning every subject. 47 traditional 1-D measurements were also taken. These measurements can be used to compare with past surveys.
3. Landmarks
Anthropometric landmarks are stable locations on the human body that are selected to delimit the linear measurements in traditional anthropometry. They usually locate at the joints and other salient positions. Trained human operators can locate them by palpating the subject. In 3D anthropometry, landmarks can serve as the first level of correspondence across a population.
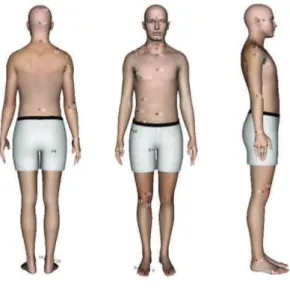
Fig. 1. CFAS 2012 landmarks.
CFAS 2012 dataset contains 38 landmarks. Fig. 1 shows these landmarks. Some landmarks were only placed on one side of the body. These landmarks were placed by human operators prior to the scanning of the subjects. To use the landmarks for registration, the 3D coordinates of the landmarks have to be extracted from the scan data where the texture data show the location of the landmarks on the 3D scan. Unfortunately, the texture data are too noisy to be useful in an automatic detection algorithm. To alleviate this problem, a machine learning approach has been adopted, where a small set of landmarks were manually placed as a training set, and the landmarks for the rest of the models were predicted by an algorithm.
We start with a small set of training models on which we placed landmarks manually. The models in this set were selected based on the height distribution. They are used to train a probabilistic graphical model for predicting landmarks for the rest of the dataset [3]. Two other types of landmarks that depend on the specific postures can also be extracted automatically.
3.1. Extreme-point landmark identification
Certain landmarks can be identified reliably from the geometric configurations of the models. We take advantage of the assumptions that all of the scans are in a small number of known postures Fig. 2 shows these landmarks for the standing posture. There are 8 landmarks of this kind: tips of the fingers, tips of the toes, back of the heels, tip of the nose, and top of the head. These are geometric extreme points on the models.
To find these points, we first make a rough segmentation of the whole body into six parts: head, two arms, two legs, and torso. The goal is not to create an accurate segmentation. Rather, the goal is to isolate the body parts so that landmarks can be found in a reduced space.
Once the segmentation is obtained, individual landmarks can be found by sweeping planes to find the extreme points. For example, the tip of the nose is the first point that touches the sweeping plane that is parallel to the front of the body. The tip of the middle fingers can also be identified as the lowest points of the arms.
3748 Chang Shu et al. / Procedia Manufacturing 3 ( 2015 ) 3745 – 3752
Fig. 2. Segmentation and feature points.
Fig. 3. Patch-based feature point. 3.2. Patch-based landmark identification
Certain parts of the human body have special surface characteristics and are easily identifiable by using local surface features. The crotch area is such an example. As shown in Fig. 3, the surface patch around the crotch point is unique. To find the crotch point, we can take a reference patch with the crotch point pre-defined on it, and then move this patch over each candidate point on the target mesh, looking for the best-fit point. The candidate point sets can be obtained by a spherical nearest-neighbor search around an estimated point obtained by the probabilistic graphical model approach.
4. Data registration
The goal of data registration is to establish a correspondence among the models. An early attempt to solve this problem adopts a volumetric approach. Each model is embedded in a regular grid. By carefully orienting and normalizing the models, a correspondence in the ambient space and thus a correspondence among the models is established. The main advantage of this method is that it does not require landmarks. It is also easy to implement.
The drawback, however, is that the correspondence it produces is not accurate. Holes have to be filled before a model can be embedded into a grid. This proved to be a difficult task because certain parts of the model, for example, under the arms, have large holes. In some parts, like the hands and ears, up to 50% of the information is missing.
A better approach is to fit a generic mesh model to each data scan [1, 12, 13, 17]. This model is complete and has well-shaped and well-distributed triangles. The fitting deforms the generic model to each scan such that the two models are made geometrically equivalent. When deforming the generic model, the correspondence between the anatomical parts has to be maintained. This is achieved by using landmarks, which serves as the initial conditions of the problem. When deforming the generic model, we have to be careful that the smoothness of the surface has to be maintained. Otherwise, the triangles can go into each other, causing invalid meshes and consequently leading to the failure of the deformation algorithm.
Deforming a generic mesh smoothly to a data scan can be formulated as an optimization problem. Here, the variables we need to solve are the x, y, and z coordinates of the generic model. The initial solution can be simply the generic model. Given a solution, the cost function is defined by estimating the difference between the solution and the target data model. This includes three kinds of errors: (1) the landmark error, which accounts for sum of the distances between the known corresponding landmarks; (2) the smoothness error, which quantifies the local smoothness at every mesh points; and (3) the data error, which measures the sum of the distances between every pair of corresponding points.
A typical scan consists of 100,000 to 300,000 points. Thus, our optimization problem involves the solving of a large number of variables. As the problem is nonlinear, it is difficult to find stable solutions and the algorithm tends to be stuck in the local minima. Allen et al. suggested a multi-resolution approach where low resolution meshes are deformed before the high-resolution meshes. This method improves the efficiency and resolves some of the convergence problem, but it involves the hand setting of several parameters. Xi et al [17] improved this method by first using Radial Basis Function (RBF) to deform the generic model to approximate the data model and then bringing the two models close together by the nonlinear optimization method of Allen et al. This simplifies the process and increases the speed by 50%. However, when there are few landmarks, the RBF-based method tends to generate non-human-like forms and makes the subsequent deformation unreliable. In this case, we found that the multi-resolution method works better. Fig. 1 shows the process of fitting a generic model to a scan.
3750 Chang Shu et al. / Procedia Manufacturing 3 ( 2015 ) 3745 – 3752
Fig. 5. Cumulative variability vs. number of principal components.
5. Statistical shape analysis
Having established the correspondence among all the models, we can perform statistical shape analysis. At this point, we have a set of parameterized models; each has the same number of points and the same mesh topology. The variables on which we perform statistics are the coordinates of the vertices on the meshes. A shape vector can be formed for each model and the mean vector and the covariance matrix can be computed. From the standard principal component analysis, the eigenvectors of the covariance matrix form a basis of the shape space. It transforms the data into a new coordinate system in which the modes of variations are ordered from large to small.
The absolute values of the eigenvalues determine the significance of the corresponding variations (principal components). Many of them are close to zero. Therefore, the space of the human shape can be represented by a small number of principal components (PC). Fig. 3 shows the relationship between the number of PCs and the percentage of variability they represent. The first 11 PCs explain 90.76% of the shape variability - enough for most practical applications.
6. Data exploration and comparison
One of the advantages of statistical shape analysis is that it provides intuitive visualization of the shape variation. Since we use a dense point set on the surface to perform PCA, each principal component can be visualized by an animation produced by varying the coefficient of the component. We have implemented a tool, called Shape Analyzer, for navigating the shape space. In the interface, each slider controls the coefficient of a principal component. We provide the control sliders for the first 50 components, which is more than enough for any practical application. The combination of these coefficients determines a shape that is shown in the display area. At any instance, the generated shape can be exported. Since PCA is a linear model, shapes along a PC axis form a Gaussian distribution. Therefore, boundary shapes of a population can be generated.
Fig. 6. Comparison using 1-D measurements.
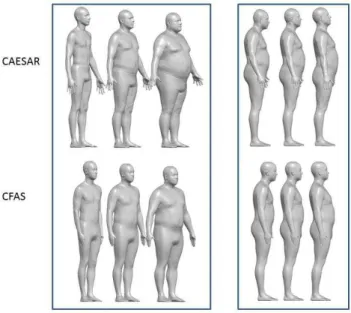
Fig. 7. Shape comparisons between CAESAR and CFAS. Left box: overall volume; right box: posture.
Another application of the statistical shape model is to compare shapes of different population groups [2, 21]. As a demonstration, we show in Fig. 6 and Fig. 7 comparisons of the male CFAS data with the general North American population using the CAESAR dataset [14]. Fig. 6 compares two measurements – weight and stature – in a scattered plot. It shows that the CAESAR dataset has a larger variation in the two measurements. This is confirmed in Fig. 7 (left box), where the 2nd principal components corresponding to the shape changes with respect to weight was compared. It shows visually that the CFAS shapes have less variation than the overall North American population.
More interestingly, the shape analysis results reveal differences that cannot be detected from 1-D measurements. Fig. 7 (right box) shows a posture variation. Again, the CFAS postures, being military, are more uniform than the general population.
3752 Chang Shu et al. / Procedia Manufacturing 3 ( 2015 ) 3745 – 3752
7. Conclusions
In this paper, we have discussed the data processing and analysis of the CFAS 2012 data, the most comprehensive 3D anthropometric survey of the Canadian Forces. We have shown that large dataset of 3D scans can be processed automatically using a number of algorithms including landmark and feature identification, data registration, and statistical shape analysis. A statistical shape model resulting from these processing opens up new opportunities for understanding human body shapes. From this model, effective tools can be created for specifying and designing products that optimally accommodate humans.
References
[1] B. Allen, B. Curless, and Z. Popovic, The space of human body shapes: reconstruction and parameterization, ACM Transactions on Graphics (SIGGRAPH'03) , 22 (3), 2003, pp. 587-594.
[2] R. Ball, C. Shu, P. Xi, M. Rioux, Y. Luximon, and J. Molenbroek, A comparison between Chinese and Caucasian head shapes, Applied Ergonomics, 41(6), 2010, pp. 832 – 839.
[3] Z. Ben Azouz, C. Shu and A. Mantel, Automatic locating of anthropometric landmarks on 3D human models. International Conference on 3D Data Processing, Visualization and Transmission (3DPVT), 2006.
[4] F. L. Bookstein, Morphometric Tools for Landmark Data: Geometry and Biology, Cambridge University Press, 1997.
[5] A. Chamberland, R. Carrier, F. Forest, and G. Hachez, 1997 Anthropometric Survey of the Land Forces. (DCIEM TR 98-CR-15) Defence and Civil Institute of Environmental Medicine. Downsview, Ontario, 1997.
[6] I. L. Dryden and K. V. Mardia, Statistical Shape Analysis, West Sussex, England, John Wiley and Sons Ltd., 1998.
[7] D. A. Hirshberg, M. Loper, E. Rachlin, A. Tsoli, A. Weiss, B. Corner and M. J. Black, Evaluating the Automated Alignment of 3D Human Body Scans, In 2nd International Conference on 3D Body Scanning Technologies, Hometrica Consulting, pages 76-86, Lugano, Switzerland. October 2011.
[8] D. Hirshberg, M. Loper, E. Rachlin and M. J. Black, Coregistration: Simultaneous alignment and modeling of articulated 3D shape, In European Conf. on Computer Vision (ECCV), Springer-Verlag, LNCS 7577, Part IV, pages 242-255, October 2012.
[9] P. Meunier, D. Tack, A. Ricci, L. Bossi, and H. Angel, Helmet accommodation analysis using 3D laser scanning, Applied Ergonomics , 31(4), 361-369, 2000.
[10] P Meunier, C Shu, P Xi, Revealing the internal structure of human variability for design purposes, Proceedings of the 17th World Congress on Ergonomics, 2009.
[11] L. E. Stewart, 1985 Anthropometric Survey of the Canadian Forces Aircrew. DCIEM TR. 85-12-01, 1985.
[12] M. Mochimaru and M. Kouchi, Statistics for 3D human body forms, SAE Digital Human Modeling for Design and Engineering. MI., 2000. [13] M. Mochimaru, M. Kouchi and M. Dohi, Analysis of 3D human foot forms using the FFD method and its application in grading shoe last,
Ergonomics , 43, 1301-1313, 2000.
[14] K. Robinette, S. Blackwell, D. Daanen, S. Fleming, M. Boehmer, T. Brill, Civilian American and European Surface Anthropometry Resource (CAESAR), Final Report. Air Force Research Laboratory, Human Effectiveness Directorate, Bioscience and Protection Division. AFRL-HE-WP-TR-2002-0169, vol I., 2002.
[15] C. Shu, S. Wuhrer, and P. Xi, 3D Anthropometric Data Processing, International Journal of Human Factors Modelling and Simulation, 3(2):133-146, 2012.
[16] P. Xi and C. Shu, Consistent parameterization and statistical analysis of human head scans, The Visual Computer, 25 (9), 863-871, 2009. [17] P. Xi, W.-S. Lee and C. Shu, Analysis of segmented human body scans, Graphic Interface, Montreal, Quebec, Canada, 2007.
[18] S. Wuhrer, C. Shu, and P. Bose, Automatically Creating Design Models from 3D Anthropometry Data, Journal of Computing and Information Science in Engineering, 12(4):041007, 2012.
[19] S. Wuhrer and C. Shu, Estimating 3D Human Shapes From Measurements, Machine Vision and Applications, 24(6):1133-1147, 2013. [20] S. Wuhrer, C Shu, P Xi, Landmark-free posture invariant human shape correspondence, The Visual Computer 27 (9), 843-852, 2011. [21] M. Zelditch, D. Swiderski, D. Sheets, and W. Fink, Geometric Morphometrics for Biologists, Academic Press, 2004.