HAL Id: hal-01303511
https://hal.archives-ouvertes.fr/hal-01303511
Submitted on 18 Apr 2016HAL is a multi-disciplinary open access archive for the deposit and dissemination of sci-entific research documents, whether they are pub-lished or not. The documents may come from teaching and research institutions in France or abroad, or from public or private research centers.
L’archive ouverte pluridisciplinaire HAL, est destinée au dépôt et à la diffusion de documents scientifiques de niveau recherche, publiés ou non, émanant des établissements d’enseignement et de recherche français ou étrangers, des laboratoires publics ou privés.
J.P. Balayssac, S. Laurens, Ginette Arliguie, M.A. Ploix, D Breysse, X
Dérobert, Bogdan Piwakowski
To cite this version:
J.P. Balayssac, S. Laurens, Ginette Arliguie, M.A. Ploix, D Breysse, et al.. Evaluation of concrete structures by combining non-destructive testing methods (SENSO project). 7th International Sym-posium on Non Destructive Testing in Civil Engineering (NDTCE’09), Jun 2009, Nantes, France. �hal-01303511�
Evaluation of concrete structures by combining non-destructive
testing methods (SENSO project)
J.P. BALAYSSAC1, S. LAURENS1, G. ARLIGUIE1, M.A. PLOIX2, D. BREYSSE3 X. DÉROBERT4, B. PIWAKOWSKI5,
1 LMDC Université de Toulouse ; UPS, INSA France
2 LCND Université de la Méditerranée, IUT d’Aix en Provence, France 3 GHYMAC Université Bordeaux 1, France
4 LCPC de Nantes, France
5 Groupe Electronique-Acoustique, Ecole Centrale de Lille, France
Abstract
The management and maintenance of the built heritage is one of the main interests of the owners of concrete structures. The engineers wish to obtain quantitative information about concrete properties and their variability. Non-destructive testing (NDT) is very popular in this context as it quickly provides relevant information on the integrity and evolution of the material, but several kinds of indicators representative of the concrete condition need to be evaluated. A French Project, named SENSO, aims to develop methods for the non-destructive evaluation of concrete based on a multi-techniques approach. Several families of techniques are concerned (ultrasonic, electromagnetic, electrical, etc.). The main objective is to define the sensitivity of the techniques and the variability of the evaluation for each indicator concerned. To achieve this, a large experimental programme, involving a representative range of concretes and several indicators, has been carried out. A large database, linking the NDT observables and the indicators, allows the different observables to be distinguished in terms of quality (linked to the variability) and in terms of relevance for the characterisation of each indicator. The improvement of the indicator evaluation by means of technique combination has been explored by a data fusion procedure.
Résumé
La gestion et la maintenance des ouvrages construits est l’une des priorités des maîtres d’ouvrages de structures en béton. Les ingénieurs veulent obtenir des informations quantitatives sur les propriétés des bétons et sur leur variabilité. Les techniques non destructives sont très populaires dans ce contexte, en fournissant des informations utiles sur l’intégrité et l’évolution du matériau, toutefois plusieurs types d’indicateurs doivent encore être évalués. Un projet national Français, nommé SENSO, a pour objectif de développer des méthodes pour l’évaluation non destructive de bétons basée sur une approche multi-techniques. Plusieurs familles de techniques sont concernées(ultrasons, electromagnétique, électrique,…). L’objectif principal est de définir la sensibilité de ces techniques et la variabilité de chaque indicateur concerné. Pour réaliser cela, un large programme expérimental, incluant une grande quantité de bétons et plusieurs indicateurs, a été réalisé. Une base de données importante, liant les observables des techniques ND et les indicateurs, permet aux premiers de se distinguer en terme de qualité (liée à la variabilité) et en termes d’utilité pour la caractérisation de chaque indicateur. L’amélioration de l’évaluation de ces indicateurs au moyen de la combinaison de technique a été engagée par une procédure de fusion de données.
Keywords
NDT, concrete, observable, durability indicators, combination, data processing, data fusion
1 Introduction
This communication briefly presents the research tasks completed within the framework of a French project supported by the National Agency for Research, the project SENSO, “Strategy of non-destructive evaluation for the monitoring of concrete structures”. This project brings together several partners specialised either in the development of non-destructive testing methods, or in the inspection of structures, or in data processing.
The need for the non-destructive evaluation of structures results from increasing needs for diagnosis of pathologies and requalification of structures. However, although a large panel of potentially efficient non-destructive testing methods is available for characterising the condition of material, the relationship between the NDT observables and the indicators of the material's condition is not clearly defined. There are several reasons for this: the strong variability of material, the combined effects of the indicators and the difficulty of transposing laboratory results to the site [1].
Moreover, the usual investigation strategies result in measurements being accumulated but, in many cases, the information gathered is not fully explored, either because its degree of significance is unknown (many sources of uncertainty, intrinsic variability of the properties not taken into account), or because the measurements are simply juxtaposed rather than really exploited in combination and so no advantage is really drawn from the multiplicity of investigations [2]. The objective of SENSO is to propose a methodology for the non-destructive evaluation of some indicators related to the durability of concrete by means of a combination of NDT methods: electromagnetic (radar), acoustic (ultrasound), electrical sounding (capacitive technique and resistivity), infra-red thermography, surface permeability, etc. The selected indicators are: porosity, Young's modulus, compressive strength, water content, chloride content, and depth of carbonation. For each indicator, the objectives are to evaluate its value (average and degree of variability) and to estimate the degree of reliability of this evaluation.
A large experimental study on controlled samples was carried out. 135 slabs were built, in which the different indicators were controlled and measured. A large number of NDT methods were implemented on these slabs and about 200 000 data items were collected. All these data were analysed by means of descriptive statistics, data mining and data fusion. The aim was to propose a complete procedure able to merge the different data provided by a large variety of NDT methods for the characterisation of the indicators. The procedure is also being tested on real structures.
2 Presentation of the experimental programme
Laboratory tests were carried out on a representative range of concretes in the aim of establishing a complete set of empirical relationships between non-destructive measurements and indicators. The concrete was considered as a homogeneous material at this stage. Cross tests were performed by all the partners with all the NDT methods involved in the project and on the same samples with the intention of fusing the data [3].
About 135 slabs (50 cm x 25 cm x 12 cm), implementing 8 different compositions of concrete were built. The analysed concretes covered a sufficiently broad range of porosity to be representative of what is generally found in structures. The properties of the material in relation to the indicators (water content, Young's Modulus, porosity, carbonation depth, chloride content) were homogenised. The objective was to evaluate the indicators by traditional destructive methods and to determine relationships between the NDT observables and these indicators. The non-destructive investigations were divided into three benchmarks. The first one was intended for the characterisation of the porosity, water content, Young's modulus and compressive strength indicators. The second was for the characterisation of
carbonation and the last was dedicated to the characterisation of chloride content. The experimental programme was set up in order to be able to quantify the NDT variability at different levels.
Table 1 presents the details of the first benchmark, used for the following indicators: water content, Young's modulus, compressive strength and porosity.
Table 1. Presentation of concrete mixes used for the first laboratory benchmark
Aggregates Round Siliceous 0 – 14 mm Siliceous Round 0-20 mm Crushed Siliceous 0-14 mm Crushed limestone 0-14 mm W/C (Porosity) 0.30 0.45 0.55 0.65 0.80 0.55 0.55 0.55 Reference G1 G2 G3a G3 G7 G8 G4 G5 G6
The following parameters were chosen to vary: the nature of the aggregates (limestone or siliceous), the shape of the aggregates (round or crushed), the size of aggregates (Dmax = 14 or
20 mm) and the porosity, which was varied by means of the water to cement ratio (W/C) for five mixes (G1, G2, G3, G7 and G8). The composition G3 was used twice so as to analyse the influence of the variability of fabrication conditions.
This first benchmark was divided into three series of tests. The first and the second series (dry and saturated conditions of humidity) made it possible to carry out measurements on 8 slabs for each composition. The third and last series concerned intermediate degrees of saturation (40, 60 and 80%). In this series, the slabs were conditioned at different controlled moisture contents. For each series, all the NDT methods were implemented within the same short period so that the environmental conditions did not vary during the measurements.
A second benchmark was dedicated to the characterisation of chloride content and a third to the characterisation of carbonation depth. Before the different conditioning procedures, the slabs were water cured for 28 days to stabilise the hydration.
3 NDT measurements: example of results
All the NDT measurements were made during the same short period of time so as to keep the same environmental conditions for all the techniques. The following NDT methods were implemented: electrical resistivity, radar (velocity and attenuation of direct wave), capacitive method, ultrasonic surface waves (reception by laser vibrometer), ultrasonic surface waves (transducers without contact), ultrasonic waves in transmission, impact echo, and passive infra-red thermography. In parallel with the non-destructive tests, the indicators (essentially Young's modulus and porosity but also compressive strength and gas permeability) were measured by means of destructive tests. Usual semi-destructive tests were also carried out, such as the pull-out test.
20000 25000 30000 35000 40000 45000 50000 G1 G2 G3 G3a G7 G8 G5 G4 G6 Young M odul us (M Pa ) Dry Saturated
Figure 1. Young's modulus for the different concretes in both dry and saturated
conditions
Fig.1 presents an example of the results provided by destructive tests to characterise Young's modulus. These tests were done on cores extracted from a special slab. For each value, three samples were tested in order to estimate the variability of the measurement. For all the concretes, the Young's modulus measured in the dry condition was higher (to varying degrees) than the one measured in the saturated condition. Compositions G1 and G8, which had the lowest and highest water to cement ratios respectively, provided the highest and lowest Young's moduli respectively. This is in accordance with the literature [4], which usually links stiffness with porosity. In the present study, this could not be checked for all the concretes. Concretes G3, G4, G5 and G6, which had more or less the same porosity, did not provide the same Young's modulus. The highest value was measured for the concrete G6, which was made using limestone aggregates with higher stiffness. On the other hand, the compressive strength was not influenced by the nature of the aggregates; the results show that it was in the same range for all the concretes. This phenomenon was also emphasised by ultrasonic methods, for which high velocities and low attenuation were observed in this particular concrete. Fig.2 presents an example of NDT measurements. The graph plots the amplitude of radar direct wave versus the volumetric water content for all the concretes and all the saturation degrees. It is possible to draw a unique relationship between this observable provided by radar technique and one indicator of concrete. This kind of relationship has already been proposed in previous studies [5, 6, 7, 8, 9]. Porosity does not have a significant effect on the propagation of radar waves but the quantity of water influences the propagation of electromagnetic waves. This decreases the velocity of the waves and increases their attenuation.
R2 = 0,8841 0,30 0,40 0,50 0,60 0,70 0,80 0 2 4 6 8 10 12 14 16 18 2
Volumetric water content (%)
Ampl itu de o f di re ct w a ve (ua) 0
Figure 2. Amplitude of the radar direct wave versus concrete moisture
4 Data analysis (benchmark 1)
During the first benchmark test, the different techniques provided about 60 NDT observables and, after each series of tests, about 25 000 data points were available. The main purpose of the data analysis was to reduce this large set of values and to find the most relevant NDT technique for each indicator. Two ways were investigated: first, a statistical analysis of the variability of the measurement for each technique and, second, discrimination by means of data mining techniques (principle component analysis -PCA- for instance). For the first method, a quality index was defined from the different levels of variability of the NDT measurement [3]. The variability of the NDT observables was established by calculating the variance at four levels:
- variability of the measurement (variance V1): 10 measurements were made at the same point on one sample
- variability within a sample (variance V2): 10 measurements were made on the same sample
- variability within a composition (variance V3): 8 samples of the same batch were characterised for the dry and the fully saturated conditions, and three for the intermediate saturation degrees. Another variance (V3a) was also defined between batches G3 and G3a, which can be linked to the variability of fabrication.
- variability among the different batches (V4): this variability is linked to the ability of the methods to differentiate among the different batches.
A first approach for the estimation of the quality of the observables took these different levels of variability into account by means of a quality index (QI) calculated by the relation (1).
QI =– log (V1/V2) – log (V2/V3) (1) A second approach was based on the quality of the correlations between NDT observables and indicators. A multi-linear correlation between each observable and both porosity and saturation degree was performed. In this case, the quality index QI was assimilated to the coefficient of correlation R². The higher the quality index was, the better the quality of the measurement was considered to be. The second method of the data analysis aimed to evaluate
the reliability of the observables with respect to each indicator, by comparing the variances V3 and V4 calculated for each observable. An index of relevance was calculated for each
observable with respect to each indicator (2).
IR = -log(V3/V4) (2)
The relevance of an observable depends on the indicator. For instance, concerning capacitive measurements or radar direct wave, the relevance is very good for the evaluation of the moisture content and very bad for the porosity. On the other hand, with acoustic surface waves or resistivity, the relevance is good for both indicators.
The combined use of both quality index and relevance index allowed us to discriminate among the NDT observables and thus to reduce their number. The two approaches, the first based on the analysis of the different levels of variability and the second based on the analysis of the multi-linear regressions, were confronted with the application of selection criteria. The final selection of the most relevant and reliable observables was achieved according to the opinion of experts in the techniques and also by taking into account the suitability of the technique for on-site implementation, the difficulty of extracting observables from the raw measurements, etc. Finally, eighteen observables were selected (7 for ultrasonic, 5 for radar, 4 for resistivity, 1 for the capacitive method and 1 for impact echo).
5 Data fusion
The strategy of data fusion within the framework of project SENSO is:
- to combine the 18 selected observables in order to estimate indicators such as the porosity, the water content, the carbonation, the contamination by chlorides…,
- to propose a degree of confidence in this estimation.
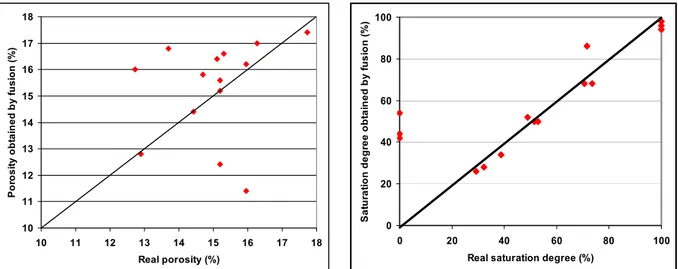
The correlations between NDT observables and indicators allow the indicator to be evaluated by any technique (ultrasound speed, electrical resistivity, radar amplitude…). The aim of data fusion is to merge the different values in order to improve the quality of the evaluation and to link this evaluation to a confidence index. Within the SENSO project, the fusion is performed through possibility theory [10]. This procedure uses the indexes of quality and relevance provided by the data processing to compute a confidence index of the evaluation. Figure 3 presents an example of results obtained by the fusion of five observables for the evaluation of both porosity and saturation degree. The data plotted on the graphs concern four different concretes and, for each value, the confidence index is always higher than 0.65. The fusion gives good quality for the evaluation of the saturation degree, except for 0% but this value cannot be encountered on site. On the other hand, the evaluation of porosity is not so reliable, as many points are divergent.
10 11 12 13 14 15 16 17 18 10 11 12 13 14 15 16 17 18 Real porosity (%) P o ro si ty obt ai ned by f u si o n ( % )
Figure 3. Evaluation of porosity (left) and saturation degree (right) by fusion of observables 0 20 40 60 80 100 0 20 40 60 80 10
Real saturation degree (%)
S a tu ra ti o n d e g re e o b ta in e d b y fu s io n (% ) 0 6 Conclusions
This communication has briefly presented the objectives and a part of the results of the SENSO project. The experimental programme used for drawing the correlation laws between the NDT measurements and the targeted indicators has been described. Some examples of results obtained during this large experimental programme both by destructive characterisation and NDT have been presented. Moreover, we have described how the variability of the measurements, related on the one hand, to the precision of the techniques and, on the other, to the variability of the concrete, is taken into account in this work. The various levels of variability have been described in detail and exploited to highlight the level of quality of the techniques with respect to the indicators. For this purpose, an index of quality evaluated either from the variability of the observables or from the quality of multi-linear correlations between observables and indicators is proposed. An index of relevance is also defined from the sensitivity of the NDT observables with respect to an indicator. Lastly, we have briefly presented the methodology of fusion developed within the framework of this project and, through an example, shown how it is implemented to evaluate two indicators with a fixed confidence index.
Acknowledgements
The authors thank the participants in project SENSO for their contributions to this communication. All the participants in the project thank the French National Agency for Research (ANR) for its financial support.
References
1. OECD Nuclear Energy Agency, “Development priorities for Non-Destructive examination
of concrete structures in nuclear plant”, Nuclear Safety, NEA/CSNI/R(98) 6, 10-1998, pp. 25–397
2. D. Breysse, G. Klysz, X. Dérobert, C. Sirieix, J.F. Lataste, “How to combine several
non-destructive techniques for a better assessment of concrete structures”, Cement and Concrete Research, Volume 38, Issue 6, June 2008, Pages 783-793
3. Intermediate report, SENSO Project, ANR-05-PRGCU-O02, July 2007, 88p
4. J-K Kim, S.H. Han, Y.C. Song, "Effect of temperature and aging on the mechanical
properties of concrete Part I. Experimental results", Cement and Concrete Research, Vol. 32, 2007, pp1087-1094
5. Z.M. Sbartaï, S. Laurens, J.-P. Balayssac, G. Ballivy, G. Arliguie, “Experimental study of
concrete moisture effect on radar signal amplitude”, ACI Materials Journal, Vol.103, N°6, November 2006, pp 419-426
6. G. Klysz, J.P. Balayssac, “Determination of volumetric water content of concrete using ground-penetrating radar”, Cement and Concrete Research, Vol. 37, N° 8, August 2007, Pages 1164-1171
7. Soustos. M. N., Bungey J. H., Millard S. G., Shaw M. R., Patterson A., “Dielectric
properties of concrete and their influence on radar testing”, NDT&E International, vol. 34, 2001, pp 419-425
8. Barnes, Trottier and Forgeron, Improved concrete bridge deck evaluation using GPR by
accounting for signal depth – amplitude effects, NDT&E International Vol.41, 2008, pp 427– 433
9. Hugenschmidt J., Loser R., Detection of chlorides and moisture in concrete structures with
Ground penetrating radar, Materials and Structures, Vol. 41, 2008, 785-792
10. Ploix M.A., Garnier V., Moysan J., “Théorie des possibilités appliquée à l'END du