arXiv:0912.1066v2 [hep-ex] 18 May 2010
Search for single top quarks in the tau+jets channel using 4.8 fb
−1of p¯
p
collision data
V.M. Abazov37, B. Abbott75, M. Abolins65, B.S. Acharya30, M. Adams51, T. Adams49, E. Aguilo6, M. Ahsan59,G.D. Alexeev37, G. Alkhazov41, A. Alton64,a, G. Alverson63, G.A. Alves2, L.S. Ancu36, M. Aoki50, Y. Arnoud14,
M. Arov60, A. Askew49, B. ˚Asman42, O. Atramentov49,b, C. Avila8, J. BackusMayes82, F. Badaud13, L. Bagby50,
B. Baldin50, D.V. Bandurin59, S. Banerjee30, E. Barberis63, A.-F. Barfuss15, P. Baringer58, J. Barreto2,
J.F. Bartlett50, U. Bassler18, D. Bauer44, S. Beale6, A. Bean58, M. Begalli3, M. Begel73, C. Belanger-Champagne42,
L. Bellantoni50, J.A. Benitez65, S.B. Beri28, G. Bernardi17, R. Bernhard23, I. Bertram43, M. Besan¸con18,
R. Beuselinck44, V.A. Bezzubov40, P.C. Bhat50, V. Bhatnagar28, G. Blazey52, S. Blessing49, K. Bloom67,
A. Boehnlein50, D. Boline62, T.A. Bolton59, E.E. Boos39, G. Borissov43, T. Bose62, A. Brandt78, R. Brock65,
G. Brooijmans70, A. Bross50, D. Brown19, X.B. Bu7, D. Buchholz53, M. Buehler81, V. Buescher25, V. Bunichev39,
S. Burdin43,c, T.H. Burnett82, C.P. Buszello44, P. Calfayan26, B. Calpas15, S. Calvet16, E. Camacho-P´erez34,
J. Cammin71, M.A. Carrasco-Lizarraga34, E. Carrera49, W. Carvalho3, B.C.K. Casey50, H. Castilla-Valdez34,
S. Chakrabarti72, D. Chakraborty52, K.M. Chan55, A. Chandra54, E. Cheu46, S. Chevalier-Th´ery18, D.K. Cho62,
S.W. Cho32, S. Choi33, B. Choudhary29, T. Christoudias44, S. Cihangir50, D. Claes67, J. Clutter58, M. Cooke50,
W.E. Cooper50, M. Corcoran80, F. Couderc18, M.-C. Cousinou15, D. Cutts77, M. ´Cwiok31, A. Das46, G. Davies44,
K. De78, S.J. de Jong36, E. De La Cruz-Burelo34, K. DeVaughan67, F. D´eliot18, M. Demarteau50, R. Demina71,
D. Denisov50, S.P. Denisov40, S. Desai50, H.T. Diehl50, M. Diesburg50, A. Dominguez67, T. Dorland82, A. Dubey29,
L.V. Dudko39, L. Duflot16, D. Duggan49, A. Duperrin15, S. Dutt28, A. Dyshkant52, M. Eads67, D. Edmunds65,
J. Ellison48, V.D. Elvira50, Y. Enari17, S. Eno61, H. Evans54, A. Evdokimov73, V.N. Evdokimov40, G. Facini63,
A.V. Ferapontov77, T. Ferbel61,71, F. Fiedler25, F. Filthaut36, W. Fisher50, H.E. Fisk50, M. Fortner52, H. Fox43,
S. Fuess50, T. Gadfort70, C.F. Galea36, A. Garcia-Bellido71, V. Gavrilov38, P. Gay13, W. Geist19, W. Geng15,65,
D. Gerbaudo68, C.E. Gerber51, Y. Gershtein49,b, D. Gillberg6, G. Ginther50,71, G. Golovanov37, B. G´omez8,
A. Goussiou82, P.D. Grannis72, S. Greder19, H. Greenlee50, Z.D. Greenwood60, E.M. Gregores4, G. Grenier20,
Ph. Gris13, J.-F. Grivaz16, A. Grohsjean18, S. Gr¨unendahl50, M.W. Gr¨unewald31, F. Guo72, J. Guo72,
G. Gutierrez50, P. Gutierrez75, A. Haas70,d, P. Haefner26, S. Hagopian49, J. Haley63, I. Hall65, R.E. Hall47, L. Han7,
K. Harder45, A. Harel71, J.M. Hauptman57, J. Hays44, T. Hebbeker21, D. Hedin52, J.G. Hegeman35, A.P. Heinson48,
U. Heintz62, C. Hensel24, I. Heredia-De La Cruz34, K. Herner64, G. Hesketh63, M.D. Hildreth55, R. Hirosky81,
T. Hoang49, J.D. Hobbs72, B. Hoeneisen12, M. Hohlfeld25, S. Hossain75, P. Houben35, Y. Hu72, Z. Hubacek10,
N. Huske17, V. Hynek10, I. Iashvili69, R. Illingworth50, A.S. Ito50, S. Jabeen62, M. Jaffr´e16, S. Jain75, K. Jakobs23,
D. Jamin15, R. Jesik44, K. Johns46, C. Johnson70, M. Johnson50, D. Johnston67, A. Jonckheere50, P. Jonsson44,
A. Juste50, E. Kajfasz15, D. Karmanov39, P.A. Kasper50, I. Katsanos67, V. Kaushik78, R. Kehoe79, S. Kermiche15,
N. Khalatyan50, A. Khanov76, A. Kharchilava69, Y.N. Kharzheev37, D. Khatidze77, M.H. Kirby53, M. Kirsch21,
J.M. Kohli28, A.V. Kozelov40, J. Kraus65, A. Kumar69, A. Kupco11, T. Kurˇca20, V.A. Kuzmin39, J. Kvita9,
F. Lacroix13, D. Lam55, S. Lammers54, G. Landsberg77, P. Lebrun20, H.S. Lee32, W.M. Lee50, A. Leflat39,
J. Lellouch17, L. Li48, Q.Z. Li50, S.M. Lietti5, J.K. Lim32, D. Lincoln50, J. Linnemann65, V.V. Lipaev40, R. Lipton50,
Y. Liu7, Z. Liu6, A. Lobodenko41, M. Lokajicek11, P. Love43, H.J. Lubatti82, R. Luna-Garcia34,e, A.L. Lyon50,
A.K.A. Maciel2, D. Mackin80, P. M¨attig27, R. Maga˜na-Villalba34, P.K. Mal46, S. Malik67, V.L. Malyshev37,
Y. Maravin59, B. Martin14, J. Mart´ınez-Ortega34, R. McCarthy72, C.L. McGivern58, M.M. Meijer36,
A. Melnitchouk66, L. Mendoza8, D. Menezes52, P.G. Mercadante4, M. Merkin39, A. Meyer21, J. Meyer24,
N.K. Mondal30, R.W. Moore6, T. Moulik58, G.S. Muanza15, M. Mulhearn81, O. Mundal22, L. Mundim3, E. Nagy15,
M. Naimuddin29, M. Narain77, R. Nayyar29, H.A. Neal64, J.P. Negret8, P. Neustroev41, H. Nilsen23, H. Nogima3,
S.F. Novaes5, T. Nunnemann26, G. Obrant41, D. Onoprienko59, J. Orduna34, N. Osman44, J. Osta55, R. Otec10,
G.J. Otero y Garz´on1, M. Owen45, M. Padilla48, P. Padley80, M. Pangilinan77, N. Parashar56, V. Parihar62,
S.-J. Park24, S.K. Park32, J. Parsons70, R. Partridge77, N. Parua54, A. Patwa73, B. Penning50, M. Perfilov39,
K. Peters45, Y. Peters45, P. P´etroff16, R. Piegaia1, J. Piper65, M.-A. Pleier73, P.L.M. Podesta-Lerma34,f,
V.M. Podstavkov50, Y. Pogorelov55, M.-E. Pol2, P. Polozov38, A.V. Popov40, M. Prewitt80, S. Protopopescu73,
J. Qian64, A. Quadt24, B. Quinn66, M.S. Rangel16, K. Ranjan29, P.N. Ratoff43, I. Razumov40, P. Renkel79, P. Rich45,
M. Rijssenbeek72, I. Ripp-Baudot19, F. Rizatdinova76, S. Robinson44, M. Rominsky75, C. Royon18, P. Rubinov50,
L. Sawyer60, T. Scanlon44, D. Schaile26, R.D. Schamberger72, Y. Scheglov41, H. Schellman53, T. Schliephake27,
S. Schlobohm82, C. Schwanenberger45, R. Schwienhorst65, J. Sekaric58, H. Severini75, E. Shabalina24, M. Shamim59,
V. Shary18, A.A. Shchukin40, R.K. Shivpuri29, V. Simak10, V. Sirotenko50, P. Skubic75, P. Slattery71, D. Smirnov55,
G.R. Snow67, J. Snow74, S. Snyder73, S. S¨oldner-Rembold45, L. Sonnenschein21, A. Sopczak43, M. Sosebee78,
K. Soustruznik9, B. Spurlock78, J. Stark14, V. Stolin38, D.A. Stoyanova40, J. Strandberg64, M.A. Strang69,
E. Strauss72, M. Strauss75, R. Str¨ohmer26, D. Strom51, L. Stutte50, S. Sumowidagdo49, P. Svoisky36, M. Takahashi45,
A. Tanasijczuk1, W. Taylor6, B. Tiller26, M. Titov18, V.V. Tokmenin37, I. Torchiani23, D. Tsybychev72,
B. Tuchming18, C. Tully68, P.M. Tuts70, R. Unalan65, L. Uvarov41, S. Uvarov41, S. Uzunyan52, P.J. van den Berg35,
R. Van Kooten54, W.M. van Leeuwen35, N. Varelas51, E.W. Varnes46, I.A. Vasilyev40, P. Verdier20,
L.S. Vertogradov37, M. Verzocchi50, M. Vesterinen45, D. Vilanova18, P. Vint44, P. Vokac10, R. Wagner68,
H.D. Wahl49, M.H.L.S. Wang71, J. Warchol55, G. Watts82, M. Wayne55, G. Weber25, M. Weber50,g, A. Wenger23,h,
M. Wetstein61, A. White78, D. Wicke25, M.R.J. Williams43, G.W. Wilson58, S.J. Wimpenny48, M. Wobisch60,
D.R. Wood63, T.R. Wyatt45, Y. Xie77, C. Xu64, S. Yacoob53, R. Yamada50, W.-C. Yang45, T. Yasuda50,
Y.A. Yatsunenko37, Z. Ye50, H. Yin7, K. Yip73, H.D. Yoo77, S.W. Youn50, J. Yu78, C. Zeitnitz27, S. Zelitch81,
T. Zhao82, B. Zhou64, J. Zhu72, M. Zielinski71, D. Zieminska54, L. Zivkovic70, V. Zutshi52, and E.G. Zverev39 (The DØ Collaboration)
1Universidad de Buenos Aires, Buenos Aires, Argentina 2LAFEX, Centro Brasileiro de Pesquisas F´ısicas, Rio de Janeiro, Brazil
3Universidade do Estado do Rio de Janeiro, Rio de Janeiro, Brazil 4Universidade Federal do ABC, Santo Andr´e, Brazil
5Instituto de F´ısica Te´orica, Universidade Estadual Paulista, S˜ao Paulo, Brazil 6University of Alberta, Edmonton, Alberta, Canada; Simon Fraser University,
Burnaby, British Columbia, Canada; York University, Toronto, Ontario, Canada and McGill University, Montreal, Quebec, Canada 7University of Science and Technology of China, Hefei, People’s Republic of China
8Universidad de los Andes, Bogot´a, Colombia 9Center for Particle Physics, Charles University, Faculty of Mathematics and Physics, Prague, Czech Republic 10Czech Technical University in Prague, Prague, Czech Republic
11Center for Particle Physics, Institute of Physics,
Academy of Sciences of the Czech Republic, Prague, Czech Republic 12Universidad San Francisco de Quito, Quito, Ecuador 13LPC, Universit´e Blaise Pascal, CNRS/IN2P3, Clermont, France
14LPSC, Universit´e Joseph Fourier Grenoble 1, CNRS/IN2P3, Institut National Polytechnique de Grenoble, Grenoble, France 15CPPM, Aix-Marseille Universit´e, CNRS/IN2P3, Marseille, France
16LAL, Universit´e Paris-Sud, IN2P3/CNRS, Orsay, France 17LPNHE, IN2P3/CNRS, Universit´es Paris VI and VII, Paris, France
18CEA, Irfu, SPP, Saclay, France
19IPHC, Universit´e de Strasbourg, CNRS/IN2P3, Strasbourg, France
20IPNL, Universit´e Lyon 1, CNRS/IN2P3, Villeurbanne, France and Universit´e de Lyon, Lyon, France 21III. Physikalisches Institut A, RWTH Aachen University, Aachen, Germany
22Physikalisches Institut, Universit¨at Bonn, Bonn, Germany 23Physikalisches Institut, Universit¨at Freiburg, Freiburg, Germany
24II. Physikalisches Institut, Georg-August-Universit¨at G¨ottingen, G¨ottingen, Germany 25Institut f¨ur Physik, Universit¨at Mainz, Mainz, Germany
26Ludwig-Maximilians-Universit¨at M¨unchen, M¨unchen, Germany 27Fachbereich Physik, University of Wuppertal, Wuppertal, Germany
28Panjab University, Chandigarh, India 29Delhi University, Delhi, India
30Tata Institute of Fundamental Research, Mumbai, India 31University College Dublin, Dublin, Ireland
32Korea Detector Laboratory, Korea University, Seoul, Korea 33SungKyunKwan University, Suwon, Korea
34CINVESTAV, Mexico City, Mexico
35FOM-Institute NIKHEF and University of Amsterdam/NIKHEF, Amsterdam, The Netherlands 36Radboud University Nijmegen/NIKHEF, Nijmegen, The Netherlands
37Joint Institute for Nuclear Research, Dubna, Russia 38Institute for Theoretical and Experimental Physics, Moscow, Russia
39Moscow State University, Moscow, Russia 40Institute for High Energy Physics, Protvino, Russia 41Petersburg Nuclear Physics Institute, St. Petersburg, Russia
42Stockholm University, Stockholm, Sweden, and Uppsala University, Uppsala, Sweden 43Lancaster University, Lancaster, United Kingdom
44Imperial College London, London SW7 2AZ, United Kingdom 45The University of Manchester, Manchester M13 9PL, United Kingdom
46University of Arizona, Tucson, Arizona 85721, USA 47California State University, Fresno, California 93740, USA
48University of California, Riverside, California 92521, USA 49Florida State University, Tallahassee, Florida 32306, USA 50Fermi National Accelerator Laboratory, Batavia, Illinois 60510, USA
51University of Illinois at Chicago, Chicago, Illinois 60607, USA 52Northern Illinois University, DeKalb, Illinois 60115, USA
53Northwestern University, Evanston, Illinois 60208, USA 54Indiana University, Bloomington, Indiana 47405, USA 55University of Notre Dame, Notre Dame, Indiana 46556, USA
56Purdue University Calumet, Hammond, Indiana 46323, USA 57Iowa State University, Ames, Iowa 50011, USA 58University of Kansas, Lawrence, Kansas 66045, USA 59Kansas State University, Manhattan, Kansas 66506, USA 60Louisiana Tech University, Ruston, Louisiana 71272, USA 61University of Maryland, College Park, Maryland 20742, USA
62Boston University, Boston, Massachusetts 02215, USA 63Northeastern University, Boston, Massachusetts 02115, USA
64University of Michigan, Ann Arbor, Michigan 48109, USA 65Michigan State University, East Lansing, Michigan 48824, USA
66University of Mississippi, University, Mississippi 38677, USA 67University of Nebraska, Lincoln, Nebraska 68588, USA 68Princeton University, Princeton, New Jersey 08544, USA 69State University of New York, Buffalo, New York 14260, USA
70Columbia University, New York, New York 10027, USA 71University of Rochester, Rochester, New York 14627, USA 72State University of New York, Stony Brook, New York 11794, USA
73Brookhaven National Laboratory, Upton, New York 11973, USA 74Langston University, Langston, Oklahoma 73050, USA 75University of Oklahoma, Norman, Oklahoma 73019, USA 76Oklahoma State University, Stillwater, Oklahoma 74078, USA
77Brown University, Providence, Rhode Island 02912, USA 78University of Texas, Arlington, Texas 76019, USA 79Southern Methodist University, Dallas, Texas 75275, USA
80Rice University, Houston, Texas 77005, USA
81University of Virginia, Charlottesville, Virginia 22901, USA and 82University of Washington, Seattle, Washington 98195, USA
We present the first direct search for single top quark productionusing reconstructed tau leptons in the final state. The search is based on 4.8 fb−1of integrated luminosity collected in p¯p collisions at√s=1.96 TeV with the D0 detector at the Fermilab Tevatron Collider. We select events with a final state including an isolated tau lepton, missing transverse energy, two or three jets, one or two of them being identified as b quark jet. We use a multivariate technique to discriminate signal from background. The number of events observed in data in this final state is consistent with the signal plus background expectation. We set in the tau+jets channel an upper limit on the single top quark cross section of 7.3 pb at the 95% C.L. This measurement allows a gain of 4% in expected sensitivity for the observation of single top production when combining it with electron+jets and muon+jets channels already published by the D0 collaboration with 2.3 fb−1of data. We measure a combined cross section of 3.84+0.89
−0.83 pb, which is the most precise measurement to date.
PACS numbers: 14.65.Ha; 14.60.Fg; 13.85.Rm
INTRODUCTION
At the Fermilab Tevatron Collider, top quarks can be produced either in pairs by the strong interaction or
singly by the electroweak interaction. Single top quark production can be used to directly measure the CKM matrix element |Vtb| [1], to determine the top quark
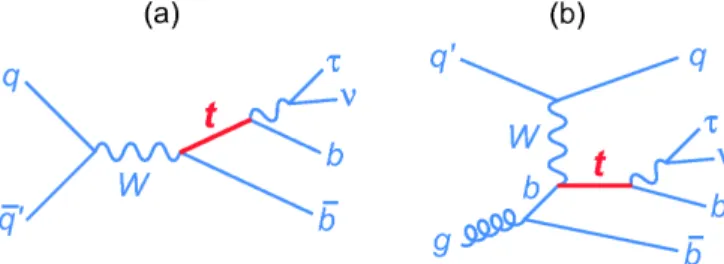
par-tial decay width and lifetime [2], to study top quark polarization and to probe physics beyond the standard model (SM) [3]. The production of a single top quark is accompanied by a b quark in the s-channel mode or by both a b quark and a light quark in the t-channel mode, as illustrated in Fig. 1. Besides the s- and
t-Figure 1: Diagrams for single top quark production in (a) s-channel and (b) t-s-channel production showing the top quark decays of interest.
channels, single top quarks can also be produced in an associated tW process via bg → tW . At the Tevat-ron, this channel has a negligible cross section compared to s- and t-channel production [4]. The s-channel pro-cess is referred to as “tb” production, where tb includes both t¯b and ¯tb states. The t-channel process is abbre-viated as “tqb”, where this includes tq¯b, t¯q¯b, ¯tqb, and ¯
t¯qb states. Considering the SM decay modes of the top quark and W boson, single top production and decay results in four channels: electron+jets, muon+jets, tau lepton+jets (tau+jets), and all-jets. Evidence [5–7] and observation [8, 9] of single top quark production in the electron+jets and muon+jets channels and the first dir-ect measurement of |Vtb| [5] have been published recently.
However, the tau+jets channel has not been measured so far due to the overwhelming jet background at the Tevatron, although signatures involving tau leptons have been explored by D0, for example, in the measurement of the Z → τ τ cross section [10] and, more recently, in the context of Higgs searches [11]. The measurement of the single top quark cross section in the electron and muon channels is still limited by statistical uncertaties. In this analysis, adding the tau+jets channel in-creases the signal acceptance by 32% compared to the D0 observation [8]. In addition, the tau+jets channel is a statistically independent channel with different domin-ant backgrounds and different systematic contributions compared to the electron and muon channels. As such, the tau channel provides an independent measurement of the single top production cross section. In addition, the approach developed in the analysis could be extended to other studies, such as Higgs searches in tau+jets chan-nels, where the cross section to be measured is low and multijet background is dominant.
In this Letter, we report the first direct search for single top quarks in the tau+jets channel. Since the
dominant background source is multijet events, which are poorly modeled by Monte Carlo (MC) simulations, we build most of our background model from an independent sample of multijet data. We then model several smaller background sources using MC and combine them with the multijet sample to complete the background model. We then train a multivariate discriminant to separate the simulated single top signal from the background model. Finally, we extract the single top cross section and com-bine the result with the existing electron and muon chan-nel measurements.
OBJECT IDENTIFICATION AND EVENT SELECTION
The upgraded D0 detector is described in detail in Ref. [12]. A right-handed coordinate system is used in the analysis. In the system, the z-axis is along the proton direction, φ is the azimuthal angle, η is the pseudorapid-ity, − ln [tan θ/2], where θ is the polar angle, and the true rapidity is defined as, 1/2 ln [(E + pzc)/(E − pzc)] [12].
This analysis is based on a sample of D0 Run II data col-lected between August 2002 and April 2009. Run IIa and Run IIb data are defined as two sub-datasets correspond-ing to integrated luminosities of 1.0 fb−1and 3.8 fb−1
re-spectively. A new inner layer of silicon microstrip track-ing detectors was added to the detector between Run IIa and Run IIb. The additional tracking detectors and the increased instantaneous luminosity in Run IIb change the b-jet identification performance.
The sample considered contains events which have passed one of a list of specialized trigger conditions. The most important ones either set a threshold on the total scalar sum of transverse momenta of the jets in the event, require a minimum transverse momentum of all jets, or select events based on the acoplanarity of the two leading jets sorted in transverse energy. The trigger efficiency in this analysis is ≈45%.
A hadronically decaying tau lepton appears as a nar-row jet in the D0 detector. A tau candidate is a calorimeter cluster reconstructed from all the towers with energy above a threshold within a cone R ≡ p(∆φ)2+ (∆η)2 <0.5 (where φ is the azimuthal angle
and η is the pseudorapidity) around a seed tower. The tau candidate must have at least one track associated with the cluster, and possibly an additional energetic subcluster of cells in the electromagnetic (EM) section of the calorimeter [10]. Hadronic tau candidates are separated in three types according to the tracking and EM calorimeter information: (1) single track with no EM subclusters, (2) single track with EM subclusters, and (3) two or three associated tracks. The classifica-tion is motivated by the decay modes: (1) τ± → π±ν
(2) τ± → ρ±ν and (3) τ± → π±π±π∓(π0)ν. We
re-quire the tau transverse momentum, pτ
than 10, 5, 10 GeV for Type 1, 2 and 3 tau leptons. We also require the transverse momentum of the asso-ciated track, ptrk
T , to be larger than 7 GeV (5 GeV) for
Type 1 (2) tau leptons. For Type 3, the transverse mo-mentum of at least one track, ptrk
T , has to be larger than
5 GeV and the sum of the associated track transverse mo-menta,P
trkptrkT , has to be greater than 7 GeV.
Hadron-ically decaying tau leptons are distinguished from other types of jets using variables such as isolation (defined as (Eτ
T − ETcore)/EcoreT where ETτ and ETcore are the
trans-verse energy in a cone with radius R = 0.5 and a smaller cone with radius R = 0.3 defined about the same axis), shower width, and shower profiles (a ratio of the ET’s
of the two most energetic calorimeter towers with size ∆φ × ∆η = 0.1 × 0.1 over ET of the tau candidate). As
there is no single tau identification variable which can provide the required background rejection, a multivari-ate technique is used to combine these features into a single discriminant. Tau identification is then performed by applying kinematic selections as well as a requirement on the multivariate discriminant output.
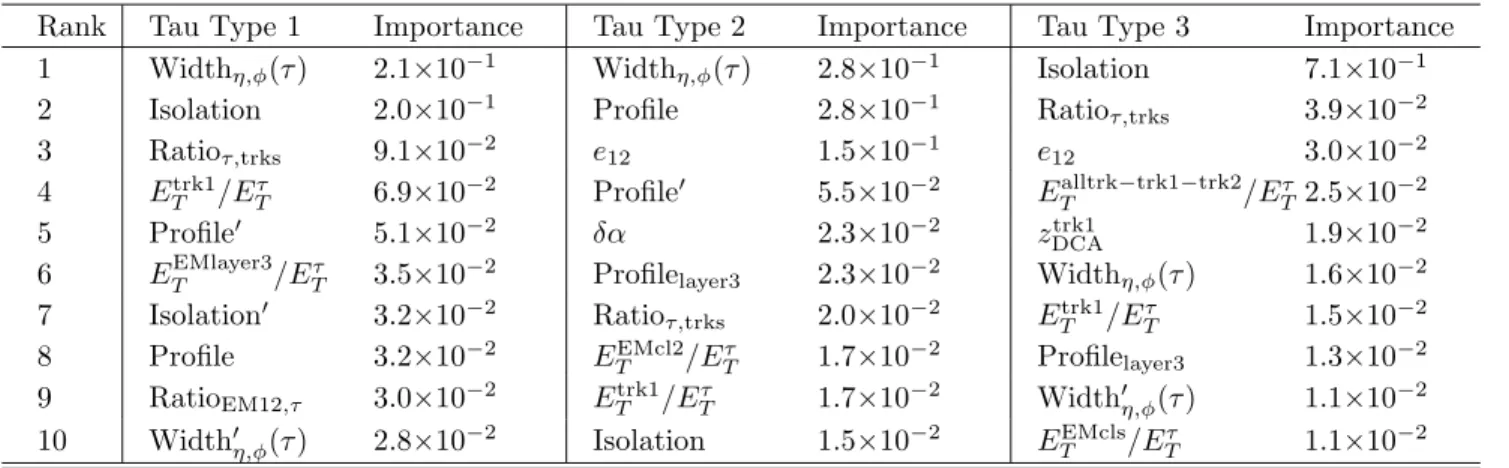
All other analyses at D0 that use hadronic tau de-cays except the one reported in this Letter use tau iden-tification relying on a neural network (NN) trained on Z → τ τ decays and background samples suitable for that signal [10]. In contrast, the multivariate technique used in this analysis for tau identification relies on boosted decision trees (BDT). The BDT technique has been used in previous D0 single top quark analyses [5, 8] and is de-scribed in Ref. [6]. In brief, a decision tree is an algorithm which combines selection requirements on a large num-ber of variables with varying discriminating power into a single, more powerful, multivariate discriminant [13, 14]. It can be “boosted” by building the multivariate discrim-inant through a weighted average score from many de-cision trees instead of a single tree [15]. A total of 25 well-modeledkinematic variablesfor each tau typeserve as the inputs to BDTs. Table I shows the 10 most dis-criminative variables with their normalized importance values for tau Types 1, 2 and 3. The importance is de-rived by an algorithm in which variable usage frequency, separation gains and numbers of events in the splitting nodes are considered [16]. A set of trees is created based on a simulated tau sample from single top quark MC events, and realistic background strongly dominated by fake tau leptons. This fake tau background is extrac-ted from data by requiring events to pass tau jet triggers and applying the kinematic selections given above. Both the signal and background have different kinematics from the standard NN training samples. By changing the tech-nique from neural networks to boosted decision trees we gain ≈3%, ≈8% and ≈2% (for Types 1, 2 and 3) signal efficiency for the same background rejection rate (98%). By changing both the technique and the signal and back-ground samples to match the busy single top environment with extra jets we gain ≈8%, ≈20% and ≈8% (for Types
1, 2 and 3) signal efficiency yielding ≈76%, ≈69% and ≈59% for the same rejection. We require exactly one tau lepton per event.
Jets are reconstructed by an iterative cone algorithm with radius R = 0.5 in rapidity-azimuth space [17]. The highest-pT jet must have pT > 25 GeV and the second
highest-pT jet pT > 20 GeV while any additional jet must
have pT > 15 GeV. The highest-pT jet must have
pseu-dorapidity |η| < 2.5 and all other jets |η| < 3.4. The jets and the tau lepton must be isolated by requiring for their spatial separation in pseudorapidity-azimuth space be larger than 0.5. In order to identify b jets, a neural network is trained on the outputs of three b-jet identi-fication algorithms: secondary vertex, jet lifetime prob-ability, and counting signed impact parameter [18]. All three of these algorithms discriminate b jets from light quark jets by exploiting the signatures of the relatively long lifetime of b hadrons. If the neural network output of a jet is larger than 0.775, the jet is tagged as a b jet. This operating point corresponds in our selected sample to a b-tagging efficiency of 40% and a light-quark tagging rate of 0.4%. We select events with two or three jets, in-cluding at least one b jet, in order to enhance the signal-to-background ratio. We also require 20 < /ET< 200 GeV
where /ET is the missing transverse energy which is equal
to the negative of the vectorial sum of the transverse energy deposited in the calorimeter by all particles. A tau energy scale correction has been applied and /ET has
been corrected for the presence of the tau leptons. We do not exclude electrons that satisfy the tau identification requirement since these electron events provide >50% of our signal acceptance. However, we veto events with one isolated electron or one isolated muon to make sure the tau+jets sample has no overlap with the electron and muon samples in order to be able to combine the meas-urements. The data have been split by tau (Types 1 and 2 combined and Type 3), jet multiplicity (two jets and three jets), number of b jets (one b jet and two b jets) and running period, for a total of 16 analysis channels.
We select 3845 b-tagged tau+jets candidate events, among which we expect 72 single top quark events. Table II shows the event yields for all channels combined. About 85% of single top quark events in this sample come from tau Types 1 and 2 and 86% are events with only one b jet. The acceptance times efficiency is 3.0% when considering only hadronic tau leptons.
SIGNAL AND BACKGROUND MODELING Single top quark events are simulated by the next-to-leading order (NLO) event generator singletop [19], which is based on comphep [20, 21].
Table I: The 10 most discriminative variables with their normalized importance values in the training of the tau identification BDT. The variables listed are explained in Appendix I.
Rank Tau Type 1 Importance Tau Type 2 Importance Tau Type 3 Importance
1 Widthη,φ(τ ) 2.1×10⁻¹ Widthη,φ(τ ) 2.8×10⁻¹ Isolation 7.1×10⁻¹
2 Isolation 2.0×10⁻¹ Profile 2.8×10⁻¹ Ratio
τ,trks 3.9×10⁻² 3 Ratioτ,trks 9.1×10⁻² e12 1.5×10⁻¹ e12 3.0×10⁻² 4 Etrk1 T /ETτ 6.9×10⁻² Profile′ 5.5×10⁻² ETalltrk−trk1−trk2/ETτ 2.5×10⁻² 5 Profile′ 5.1×10⁻² δα 2.3×10⁻² ztrk1 DCA 1.9×10⁻² 6 ETEMlayer3/Eτ
T 3.5×10⁻² Profilelayer3 2.3×10⁻² Widthη,φ(τ ) 1.6×10⁻²
7 Isolation′ 3.2×10⁻² Ratio
τ,trks 2.0×10⁻² ETtrk1/ETτ 1.5×10⁻²
8 Profile 3.2×10⁻² EEMcl2
T /EτT 1.7×10⁻² Profilelayer3 1.3×10⁻²
9 RatioEM12,τ 3.0×10⁻² ETtrk1/ETτ 1.7×10⁻² Width′η,φ(τ ) 1.1×10⁻²
10 Width′
η,φ(τ ) 2.8×10⁻² Isolation 1.5×10⁻² ETEMcls/ETτ 1.1×10⁻²
Table II: Expected and observed events in 4.8 fb−1 of integ-rated luminosity shown in tau Types 1 and 2, Type 3 channels and all analysis combined. The uncertainties include both statistical and systematic components.
Source Types 1 and 2 Type 3 Sum
tb+tqb 61 ± 11 11 ± 2 72 ± 12 W +jets 573 ± 68 107 ± 12 680 ± 104 Z+jets 43 ± 8 17 ± 3 60 ± 10 Dibosons 30 ± 5 7 ± 1 37 ± 6 t¯t 170 ± 35 60 ± 12 230 ± 44 Multijets 1444 ± 38 1182 ± 21 2626 ± 98 Total prediction 2321 ± 94 1384 ± 28 3705 ± 153 Data 2372 1473 3845
Since tau leptons are observed as narrow jets of particles in the calorimeter, the main background to single top quark events in the tau+jets channel is mul-tijet production. This is unlike the other leptonic single top channels in which W +jets events are the main back-ground [8, 9]. We have developed a method to model the multijet background directly from data. The principal steps in this method can be summarized as:
1. Derive a tag rate function (TRF) to describe the probability to b-tag any individual jet in the sample.
2. Apply this TRF to the data sample that has no b-tagged jets.
3. Using simulated events for other physics sources, subtract them from the sample derived in Step 2 to get “pure-multijets”.
4. Normalize the sample derived in Step 3 to data. 5. Combine the derived background sample,
pure-multijets, with simulations of other background
sources: t¯t, W +jets, Z+jets, dibosons.
In Step 1, we take the ratio of the number of b-tagged jets in our data sample to the total number of jets to define a tag rate: the average probability that a jet is identified as a b jet. We measure the tag rate as a function of jet pT and η and jet multiplicity.
In Step 2, we apply these TRFs to those events that have no b-tagged jets. This TRFed sample is kinematic-ally similar to our analysis sample, but there is no overlap since we require at least one b-tagged jet in our analysis sample.
In Step 3, we remove physics background sources such as t¯t, W +jets, Z+jets and dibosons. In this procedure, we subtract from the zero-tagged TRFed multijet sample the contaminations of t¯t, W +jets, Z+jets and dibosons. Other background sources are modeled through simu-lations. These simulations, except the tau decay, have been described in [8]. The program tauola [22] (version 2.5) was used to model the decays of tau leptons includ-ing polarization effects. We normalize the W +jets back-ground to match data by the scale factors that are derived from the study in the electron+jets and muon+jets chan-nels [8]. We apply TRFs to the zero-tagged MC samples to estimate the contamination mentioned above. A sim-ilar procedure is used to ensure that any small single top signal contamination in the background data sample is also subtracted.
In Step 4, the multijet events after contamination moval are normalized to data in a multijets-enriched re-gion, as defined by the background-dominated region of the multivariate discriminant described below.
In addition to multijet events modeled by the proced-ure described above, our background model includes t¯t, W +jets, Z+jets and dibosons modeled directly from sim-ulation. In Step 5, we combine these simulated samples with the data-derived multijet sample.
At the end of the background modeling procedure, we investigate approximately 150 topological variables to
confirm that data and the background model are in good agreement since it is expected that the single top quark events represent only a small fraction, ≈2%, of the selec-ted data sample. The variables can be categorized in four classes: object kinematics, jet reconstruction, top quark reconstruction and angular correlations. Figure 2 shows four discriminating variables: W boson transverse mass, tau transverse momentum, azimuthal angle between the second-highest-pT jet and /ET, and cosine of the angle
between the tau lepton and a jet candidate that is used to reconstruct the best top quark mass (defined as closest to 170 GeV). These variables are shown for the most sens-itive channel: Types 1 and 2, two jets, one of them b tagged.
BOOSTED DECISION TREES
It is expected that single top quark events are only a small fraction of the selected data sample. We use the BDT technique to separate the signal from the back-ground. We also employ the Kolmogorov-Smirnov (KS) test [23] to verify the compatibility of discriminating variables in shape between data and background model. From the ≈150 variables studied, 44 to 70 of them are selected as input variables to train BDTs depending on the individual analysis channels. We select only variables which have a KS probability > 0.1. The KS values of the selected variables are uniformly distributed above this value.
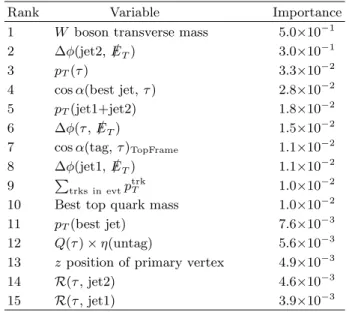
Separate sets of BDTs are built with these variables for each analysis channel. Table III lists the 15 most discrim-inative variables with their normalized importance values in the most sensitive channel. Figure 3 shows the BDT output with all channels combined, in the region between 0.5 to 1.0, i.e. where the single top quark signal events are expected. Data and the background model are in good agreement in the region. The background-dominated re-gion from 0.0-0.2 is used to define the multijets-enhanced region used in Step 4 of the multijet background model-ing procedure.
SYSTEMATIC UNCERTAINTIES
We consider systematic uncertainties from correction factors applied when modeling the signal and back-ground [6]. “Normalization” uncertainty components from the correction factors affect the signal efficiency and the normalization of the background samples, while “shape” uncertainties change the shapes of the distribu-tions for the background and the expected signal. The largest uncertainties arise from W +jets normalization to data, tau identification efficiency, tag rate functions, and jet-flavor correction in W +jets and Z+jets events. Other uncertainties include multijets normalization, integrated
Table III:The 15 most discriminative BDT training variables with their normalized importance values in the most sensitive channel. ∆φ(obj1, obj2) is the azimuthal angle between obj1 and obj2. cos α(obj1, obj2) is cosine of the angle between obj1 and obj2. “jet1” and “jet2” are the highest-pT jet and
the second-highest-pT jet, respectively. “jet1+jet2” is a
sys-tem consisting of “jet1” and “jet2”. The subscript, “Top-Frame”, indicates that the reference frame is the rest frame of a top quark which is reconstructed using a b-tagged jet, while the subscript “tag” (“untag”) refers to the jet passing (failing) the b-jet identification algorithm. P
trks in evtp trk T is
the transverse momentum of the vectorial sum of all tracks with a cut on the distance of closest approach (DCA) to the primary vertex.
Rank Variable Importance
1 W boson transverse mass 5.0×10⁻¹
2 ∆φ(jet2, /ET) 3.0×10⁻¹
3 pT(τ ) 3.3×10⁻²
4 cos α(best jet, τ ) 2.8×10⁻²
5 pT(jet1+jet2) 1.8×10⁻²
6 ∆φ(τ , /ET) 1.5×10⁻²
7 cos α(tag, τ )TopFrame 1.1×10⁻²
8 ∆φ(jet1, /ET) 1.1×10⁻²
9 P
trks in evtp trk
T 1.0×10⁻²
10 Best top quark mass 1.0×10⁻²
11 pT(best jet) 7.6×10⁻³
12 Q(τ ) × η(untag) 5.6×10⁻³
13 z position of primary vertex 4.9×10⁻³
14 R(τ , jet2) 4.6×10⁻³
15 R(τ , jet1) 3.9×10⁻³
luminosity, MC statistics, jet energy scale, jet identific-ation, jet energy resolution, initial- and final-state radi-ation, jet fragmentradi-ation, theoretical cross sections, the reweighting of the jet angular distributions in W +jets events, signal contamination removal, non-multijets con-tamination, branching fractions, instantaneous luminos-ity reweighting, parton distribution functions, primary vertex selection, and tau energy scale. The total uncer-tainty on the background model is 4.2%–19% depending on the analysis channel. Table IV summarizes all sources of uncertainties considered.
Some of the uncertainties are common with the study in the electron and muon channels and have been presen-ted in Ref. [6]. Below are the uncertainties specific to this analysis:
(i) W +jets normalization to data (normalization) The uncertainty is on the scale factors applied to normalize W +jets to match data. Since we use the scale factors derived from the electron+jets and muon+jets study [8], we consider the difference between these two channels as the uncertainty in
(W) [GeV] T M 0 20 40 60 80 100 120 Events/[3 GeV] 0 50 100 150 200 DØ Run II 4.8 fb-1 (W) [GeV] T M 0 20 40 60 80 100 120 Events/[3 GeV] 0 50 100 150 200 Data tau+jets → tb+tqb W/Z+jets, diboson t t Multijets (a) [GeV] T τ p 0 10 20 30 40 50 60 70 80 Events/[2 GeV] 10 2 10 -1 DØ Run II 4.8 fb [GeV] T τ p 0 10 20 30 40 50 60 70 80 Events/[2 GeV] 10 2 10 Data tau+jets → tb+tqb W/Z+jets, diboson t t Multijets (b) ) [rad] T E (Jet2, φ ∆ 0 0.5 1 1.5 2 2.5 3 Events/[0.08 rad] 0 50 100 150 -1 DØ Run II 4.8 fb ) [rad] T E (Jet2, φ ∆ 0 0.5 1 1.5 2 2.5 3 Events/[0.08 rad] 0 50 100 150 Data tau+jets → tb+tqb W/Z+jets, diboson t t Multijets (c) ) τ (BestJet, α cos -1 -0.8 -0.6 -0.4 -0.2 0 0.2 0.4 0.6 0.8 1 Events/[0.08] 0 50 100 150 200 -1 DØ Run II 4.8 fb ) τ (BestJet, α cos -1 -0.8 -0.6 -0.4 -0.2 0 0.2 0.4 0.6 0.8 1 Events/[0.08] 0 50 100 150 200 Data tau+jets → tb+tqb W/Z+jets, diboson t t Multijets (d)
Figure 2: Comparison between data and background distributions in the most sensitive channel: two jets, one b tag, tau Types 1 and 2 combined. (a) W boson transverse mass (b) tau transverse momentum (c) azimuthal angle between the second-highest-pT jet and /ET, and (d) cosine of the angle between the tau andthe best jet candidatethat is used to reconstruct the best top quark mass (defined as closest to 170 GeV). In (b), the double-peak structure is caused by different pT threshold for tau types 1 and 2.
the tau+jets channel.
(ii) Multijets normalization (normalization)
The statistical uncertainty of the multijet sample in the BDT region [0.0, 0.2] is used.
(iii) Tag rate functions (shape and normalization) This uncertainty consists of two components: those on the multijet background sample and those on the MC samples related to b-tag modeling. The former is evaluated by raising and lowering the tag rate by one standard deviation of its experimental determination. Uncertainties considered in the lat-ter are from several sources: statistics of the simu-lated events; the assumed heavy flavor fractions in the simulated multijet sample used for the mistag rate determination; and the choice of
parameteriz-ations [6].
(iv) Tau identification efficiency (normalization) This uncertainty is estimated by the difference in tau identification efficiency between data and MC as derived in a tau-enriched data sample.
(v) Signal contamination removal (shape and normal-ization)
In Step 3 of the background modeling, we reweight single top quark events to remove any small sig-nal contamination. The uncertainty is evaluated by raising and lowering the weighting function by one standard deviation.
(vi) Non-multijets contamination removal (shape) In Step 3 of the background modeling, we subtract
tb+tqb boosted decision tree output 0.5 0.6 0.7 0.8 0.9 1 Events/[0.02] 0 100 200 300 DØ Run II 4.8 fb-1
tb+tqb boosted decision tree output
0.5 0.6 0.7 0.8 0.9 1 Events/[0.02] 0 100 200 300 Data tau+jets → tb+tqb W/Z+jets, diboson t t Multijets
Figure 3: Distribution of BDT output with all channels com-bined in the signal region (BDT>0.5). The single top quark signal (tb + tqb →tau+jets) is normalized to the measured cross section.
the non-multijets contamination from the zero-tagged TRFed multijet sample by weighting events. The uncertainty is evaluated by raising and lowering the weighting function by one standard deviation. (vii) Tau energy scale (normalization)
The energy of hadronic tau candidates with low energy is corrected using the energy in the calor-imeter and the momentum of the tracks associated to the tau leptons using parameterized single pion response functions. The uncertainty on the scale is estimated by varying these parameterizations.
RESULTS
The number of events observed in data and the shape of the BDT discriminant are consistent with the sum of the signal and background predictions. To estimate the statistical significance of the signal observation we use the same Bayesian approach as in Refs. [5, 6, 8]. This in-volves forming a binned likelihood as a product over all bins and channels. When measuring a cross section, its central value is defined by the position of the peak in the posterior density, and the 68% interval about the peak is taken as the uncertainty. The posterior density is integ-rated from 0 until 95% of the posterior area is contained and the upper limit is set at this point. Systematic un-certainties, including all correlations, are reflected in this posterior interval. Assuming a single top quark cross sec-tion of 3.46 pb for a top quark mass of 170 GeV [4], we estimate the expected sensitivity to the standard model signal by calculating the ratio of the position of the peak of the expected posterior density to its lower half width.
Table IV: A summary of the relative systematic uncertain-ties for each of the correction factors or normalizations. The uncertainty shown is the relative error on the correction or the efficiency, before it has been applied to the MC or data samples. We do not show relative systematic uncertainties of the components for shape since they depend on distribution binning.
Relative Systematic Uncertainties Components for Normalization
b-jet fragmentation 2.0%
Branching fractions 1.5%
Diboson cross sections 5.8%
Instantaneous luminosity reweighting 1.0%
Integrated luminosity 6.1%
Initial- and final-state radiation (0.6–8.0)%
Jet energy resolution 4.0%
Jet energy scale (4.0-14.0)%
Jet fragmentation 5.0%
Jet identification 1.0%
MC statistics (0.5–16.0)%
Parton distribution functions 3.0%
(signal acceptances only)
Primary vertex selection 1.4%
Multijets normalization (3.0–14.0)%
Tau energy scale (1.0–1.5)%
Tau identification efficiency 11.0%
Triggers 5.5%
t¯t cross section 12.7%
W +jets heavy-flavor fraction 13.7%
W +jets normalization to data (7.0–15.0)%
Z+jets cross section 3.6%
Z+jets heavy-flavor fraction 13.7%
Components for Shape
Alpgenreweighting on W +jets sample —
Non-multijets contamination removal —
Components for Shape and Normaliza-tion
Signal contamination removal —
Tag rate functions —
This yields a ratio of 1.8, i.e. a sensitivity corresponding to approximately 1.8 standard deviation.
In order to test the linearity of our procedure with respect to the single top quark cross section, we gen-erate several ensembles of pseudodatasets by randomly sampling from background model events. We specify five input signal cross sections: 2.0 pb, 3.46 pb, 6.0 pb, 8.0 pb and 10.0 pb and generate ensembles at each value. Each ensemble contains ≈2000 pseudodatasets with all system-atic uncertainties considered. We then measure the cross
Signal Cross Section [pb] 0 2 4 6 8 10 12 14 ] -1 Posterior Density [pb 0 0.02 0.04 0.06 0.08 0.1 0.12 0.14 0.16 0.18 0.2 0.22 0 2 4 6 8 10 12 14 0 0.02 0.04 0.06 0.08 0.1 0.12 0.14 0.16 0.18 0.2 0.22 -1 D0 Run II 4.8 fb pb -1.8 +2.0 = 3.4 measured σ 95% C.L. Upper Limit=7.3 pb 2.2 pb ± = 3.7 expected σ 95% C.L. Upper Limit=8.5 pb 0 2 4 6 8 10 12 14 0 0.02 0.04 0.06 0.08 0.1 0.12 0.14 0.16 0.18 0.2 0.22
Figure 4: Expected SM and measured Bayesian posterior probability densities for the tb+tqb cross section. The shaded regions illustrate ± one standard deviation from the peak loc-ations.
section in each of the 2000 pseudodatasets at each input value and assess linearity. A linear fit to the measured vs. input cross section gives a slope of 0.99±0.01 and intercept of −0.14 ± 0.05. Therefore, over the range con-sidered, there is no significant evidence of bias in the measurement procedure.
We obtain an observed posterior density that is used to define an upper limit on the cross section assuming no signal. We can use the same technique to determine an observed cross section and its uncertainty. Assuming no signal, we extract an upper limit of 7.3 pb at 95% C.L. If we perform a cross section measurement, we ob-tain 3.4+2.0
−1.8 pb. The measured sensitivity, a ratio of the
position of the peak of the measured posterior density to its lower half width, is 1.9. Figure 4 shows the expec-ted and measured posterior densities with shaded regions corresponding to ± one standard deviation from the peak locations.
t¯t CROSS CHECK
As an additional cross check of our background model, we have measured the top quark pair production cross section in the same data sample, including systematic uncertainties and using the same background model and the same techniques as we use to measure the single top quark cross section. We measure a top quark pair pro-duction cross section of 10.0+2.3−1.6 pb, in good agreement
with the theoretical expectation, 7.91+0.61
−0.56 pb, from the
next-to-next-to-leading-order calculation for a top quark mass of 170 GeV [24], and a recent D0 experimental res-ult, 8.18+0.98
−0.87 pb, also for the same top quark mass [25].
COMBINATION WITH OTHER CHANNELS As this data sample has no overlap with that used in [8], it is straightforward to combine the results. In the combination, the tau channel and the (elec-tron,muon)+jets channels are treated as two independ-ent channels using the same Bayesian approach used to combine different tau channels above. The ratio of the position of the peak of the expected posterior density to its lower half width is 4.7, compared to 4.5 in the elec-tron+jets and muon+jets channels combined. We gain 4.4% in expected sensitivity by adding the tau+jets chan-nel. The observed posterior density is also calculated and yields a combined cross section of:
σ(p¯p → tb + X, tqb + X) = 3.84+0.89 −0.83pb
Figure 5 shows several recent measurements of single top quark production compared to the theoretical SM predic-tion [4], 3.46±0.18 pb, calculated for a top quark mass of 170 GeV [4]. tb+X, tqb+X) [pb] → p (p σ 0 1 2 3 4 5 6 tb+X, tqb+X) [pb] → p (p σ CDF+D0 combination 2.76 -0.47+0.58 pb ) -1 CDF combination (3.2 fb 2.30 -0.50+0.60 pb combination τ + µ D0 e+ 3.84 -0.83+0.89 pb ) -1 +jets (4.8 fb τ D0 pb -1.80 +2.00 3.40 ) -1 combination (2.3 fb µ D0 e+ pb -0.88 +0.88 3.94
Theoretical SM prediction at top quark mass 170 GeV
Figure 5: Summary of several recent measurements of single top quark production cross section. The theoretical SM pre-diction [4] at a top quark mass of 170 GeV is included as a shaded band. The “D0 e+µ combination” result is taken from [8] while the “CDF combination” result comes from [9] and the “CDF+D0 combination” result from [26].
SUMMARY
In summary, we have presented the first direct study for single top quark production in the tau+jets channel using 4.8 fb−1 of integrated luminosity at the D0
experi-ment. Due to different dominant backgrounds and differ-ent systematic uncertainties from the electron and muon channels, the tau+jets channel serves as a channel to in-dependently search for single top quarks. To increase sensitivity, electron+jets events not entering the meas-urement in the electron+jets channel and where the
elec-tron satisfies tau identification criteria are also included in the tau+jets sample. An upper limit of 7.3 pb at the 95% C.L. for the cross section is obtained. The expected sensitivity of the tau+jets channel alone is 1.8 stand-ard deviations. Adding the tau+jets channel increases the signal acceptance by 32% compared to the D0 ob-servation analysis, which was based on electron+jets and muon+jets channels. The expected sensitivity of the elec-tron+jets, muon+jets and tau+jets combined analysis is 4.7 standard deviations, to be compared to 4.5 standard deviations in electron+jets and muon+jets alone. The measured cross section in all three combined channels is found to be 3.84+0.89−0.83pb. This is the most precise meas-urement to date of the single top quark production cross section.
Acknowledgements
We thank the staffs at Fermilab and collaborating institutions, and acknowledge support from the DOE and NSF (USA); CEA and CNRS/IN2P3 (France); FASI, Rosatom and RFBR (Russia); CNPq, FAPERJ, FAPESP and FUNDUNESP (Brazil); DAE and DST (In-dia); Colciencias (Colombia); CONACyT (Mexico); KRF and KOSEF (Korea); CONICET and UBACyT (Argen-tina); FOM (The Netherlands); STFC and the Royal Society (United Kingdom); MSMT and GACR (Czech Republic); CRC Program, CFI, NSERC and WestGrid Project (Canada); BMBF and DFG (Germany); SFI (Ire-land); The Swedish Research Council (Sweden); and CAS and CNSF (China).
Appendix I: Tau Identification Variable Definitions δα: p(∆φ)2+ (∆η)2, where ∆φ and ∆η are differences
between the vector sums of tau tracks and of all EM subclusters [10].
e12: qEτtrk
T · ETEMcls/ETτ, where Eτ
trk
T is the sum over
all tau-associated tracks’ ET, ETEMcls is ET of the
sum over EM subclusters. For a system of tau-associated tracks and EM subclusters, the observed tau transverse mass is e12× ETτ × δα in the small
angle approximation [10].
Ealltrk−trk1−trk2
T : transverse energy of tracks except
the first two highest-pT tracks.
EEMcl2
T : transverse energy of the second-highest-pT
EM subcluster.
EEMlayer3
T :transverse energy deposited in the 3rd layer
of the EM calorimeter within a cone R < 0.5. Etrk1
T : transverse energy of the highest-pT track.
Isolation: P ptrk T P pτtrkT , where P ptrk T is the sum of pT of
non-tau-associated tracks within a cone size 0.5 and P pτtrk
T is the sum over all tau-associated tracks’ pT.
Isolation′: if |ηdet| 6 1.0, where ηdet is tau’s detector pseudorapidity, which is defined with respect to the center of the detector, Isolation′ = Isolation. If
|ηdet| > 1.0, Isolation′ = Isolation/(1.5 × |ηdet| −
0.5).
Profile: ET 1+ET 2
Eτ
T where ET 1 and ET 2 are the trans-verse energies of the two highest-pT calorimeter
towers in a tau object.
Profile′: if |ηdet| 61.5, Profile′=Profile. If |ηdet| >1.5, Profile′= Profile × (0.67 + 0.22 × |η
det|).
Profilelayer3: a ratio of ET of the highest pT EM sub-cluster over ET deposited in the 3rd layer of the
EM calorimeter within a cone R < 0.5. RatioEM12,τ: EEM1+EEM2
Eτ where EEM1 and EEM2 are energies deposited in the 1st and 2nd layers of the
EM calorimeter. Ratioτ,trks: E τ T Eτ T+ P pτtrkT
Widthη,φ(τ ): tau shower width, the root sum of squares of the ET-weighted η-φ distance of all
calori-meter towers with respect to the tau axis, i.e., q
Pn
i=1(∆η2i + ∆φ2i)
ET i
ET where i is the index of calorimeter towers and ET =PiET i.
Width′
η,φ(τ ): Widthη,φ(τ )/(1.0 + 0.29 × |ηdet|).
ztrk1
DCA: z position of the highest-pT track at DCA.
[1] G.V. Jikia and S.R. Slabospitsky, Phys. Lett. B 295, 136 (1992).
[2] D.O. Carlson, C.-P. Yuan arXiv:hep-ph/9509208 [3] T.M.P. Tait, C.-P. Yuan, Phys. Rev. D 63, 014018 (2000). [4] N. Kidonakis, Phys. Rev. D 74, 114012 (2006).
[5] V.M. Abazov, et al., (D0 Collaboration), Phys. Rev. Lett. 98, 181802 (2007).
[6] V.M. Abazov, et al., (D0 Collaboration), Phys. Rev. D 78, 012005 (2008).
[7] T. Aaltonen, et al., (CDF Collaboration), Phys. Rev. Lett. 101, 252001 (2008).
[8] V.M. Abazov, et al., (D0 Collaboration), Phys. Rev. Lett. 103, 092001 (2009).
[9] T. Aaltonen, et al., (CDF Collaboration), Phys. Rev. Lett. 103, 092002 (2009).
[10] V.M. Abazov, et al., (D0 Collaboration), Phys. Rev. D 71, 072004 (2005).
[11] V. M. Abazov, et al., (D0 Collaboration), Phys. Rev. Lett. 102, 251801 (2009).
[12] V. M. Abazov, et al., (D0 Collaboration), Nucl. Instrum. Meth. Phys. Res. A565, 463 (2006).
[13] L. Breiman, J. Friedman, C. J. Stone, and R. A. Olshen, Classification and Regression Trees (Wadsworth, Stam-ford, 1984).
[14] D. Bowser-Chao and D. L. Dzialo, Phys. Rev. D 47, 1900 (1993).
[15] Y. Freund and R. E. Schapire, in Machine Learning: Proceedings of the Thirteenth International Conference, edited by L. Saitta (Morgan Kaufmann, San Fransisco, 1996), p. 148.
[16] A. Hocker et al., TMVA - Toolkit for Multivariate Data Analysis, Users Guide (2009); L. Breiman et al., Classi-fication and Regression Trees, Wadsworth (1984). [17] Jets are defined using the iterative seed-based cone
al-gorithm with radiusp(∆φ)2+ (∆y)2 = 0.5, including midpoints as described on pp. 47–77 in G. C. Blazey et al., in Proceedings of the Workshop on QCD and Weak Boson Physics in Run II, edited by U. Baur, R.K. Ellis,
and D. Zeppenfeld (FERMILAB-PUB-00-297, 2000). [18] T.P. Scanlon, FERMILAB-THESIS-2006-43.
[19] E.E. Boos, et al., Phys. Atom. Nucl. 69, 1317 (2006). We use singletop version 4.2p1.
[20] E.Boos et al., Nucl. Instrum. Meth. A 534, 250 (2004). [21] A.Pukhov et al., INP MSU report 98-41/542.
[22] S. Jadach, et al., Comput. Phys. Commun. 76, 361 (1993).
[23] F. James, Statistical Methods in Experimental Physics 2nd edition, New Jork: World Scientific (2006).
[24] N. Kidonakis and R. Vogt, Phys. Rev. D 68, 114014 (2003).
[25] V. M. Abazov, et al., (D0 Collaboration), Phys. Rev. D80, 071102(R) (2009).
[26] Tevatron Electroweak Working Group, for the CDF Col-laboration and the D0 ColCol-laboration, arXiv:0908.2171v1 [hep-ex]; FERMILAB-TM-2440-E.


![Figure 5 shows several recent measurements of single top quark production compared to the theoretical SM predic-tion [4], 3.46±0.18 pb, calculated for a top quark mass of 170 GeV [4]](https://thumb-eu.123doks.com/thumbv2/123doknet/14024716.457710/10.918.519.800.491.711/figure-recent-measurements-single-production-compared-theoretical-calculated.webp)
