HAL Id: pasteur-03207908
https://hal-pasteur.archives-ouvertes.fr/pasteur-03207908
Submitted on 26 Apr 2021
HAL is a multi-disciplinary open access archive for the deposit and dissemination of sci-entific research documents, whether they are pub-lished or not. The documents may come from teaching and research institutions in France or abroad, or from public or private research centers.
L’archive ouverte pluridisciplinaire HAL, est destinée au dépôt et à la diffusion de documents scientifiques de niveau recherche, publiés ou non, émanant des établissements d’enseignement et de recherche français ou étrangers, des laboratoires publics ou privés.
Antonio Gonçalves, Pauline Maisonnasse, Flora Donati, Mélanie Albert,
Sylvie Behillil, Vanessa Contreras, Thibaut Naninck, Romain Marlin, Caroline
Solas, Andres Pizzorno, et al.
To cite this version:
Antonio Gonçalves, Pauline Maisonnasse, Flora Donati, Mélanie Albert, Sylvie Behillil, et al.. SARS-CoV-2 viral dynamics in non-human primates. PLoS Computational Biology, Public Library of Sci-ence, 2021, 17 (3), pp.e1008785. �10.1371/journal.pcbi.1008785�. �pasteur-03207908�
primates
Antonio Gonc¸alvesID1*, Pauline MaisonnasseID2, Flora DonatiID3,4, Me´lanie AlbertID3,4, Sylvie BehillilID3,4, Vanessa Contreras2, Thibaut NaninckID2, Romain MarlinID2,
Caroline SolasID5, Andres PizzornoID6, Julien LemaitreID2, Nidhal KahlaouiID2, Olivier TerrierID6, Raphael Ho Tsong FangID2, Vincent Enouf3,4,7, Nathalie Dereuddre-Bosquet2, Angela Brisebarre3,4, Franck Touret
ID8, Catherine ChaponID2, Bruno Hoen9, Bruno Lina6,10, Manuel Rosa Calatrava6, Xavier de LamballerieID8, France Mentre´ID1, Roger Le GrandID2, Sylvie van der Werf3,4, Je´re´mie GuedjID1
1 Universite´ de Paris, IAME, INSERM, Paris, France, 2 Universite´ Paris-Saclay, Inserm, CEA, Center for Immunology of Viral, Auto-immune, Hematological and Bacterial diseases (IMVA-HB/IDMIT), Fontenay-aux-Roses & Le Kremlin-Bicêtre, France, 3 Unite´ de Ge´ne´tique Mole´culaire des VirusàARN, GMVR: Institut Pasteur, UMR CNRS 3569, Universite´ de Paris, Paris, France, 4 Centre National de Re´fe´rence des Virus des infections respiratoires (dont la grippe), Institut Pasteur, Paris, France, 5 Aix-Marseille Univ, APHM, Unite´ des Virus Emergents (UVE) IRD 190, INSERM 1207, Laboratoire de Pharmacocine´tique et Toxicologie, Hoˆ pital La Timone, Marseille, France, 6 CIRI, Centre International de Recherche en Infectiologie, (Team VirPath), Univ Lyon, Inserm, U1111, Universite´ Claude Bernard Lyon 1, CNRS, UMR5308, ENS de Lyon, Lyon, France, 7 Plate-forme de microbiologie mutualise´ e (P2M), Pasteur International Bioresources Network (PIBnet), Institut Pasteur, Paris, France, 8 Unite´ des Virus Emergents, UVE: Aix Marseille Univ, IRD 190, INSERM 1207, IHU Me´ diterrane´e Infection, Marseille, France, 9 Emerging Diseases Epidemiology Unit, Institut Pasteur, Paris, France, 10 Laboratoire de Virologie, Centre National de Re´fe´rence des Virus des infections respiratoires (dont la grippe), Institut des Agents Infectieux, Groupement Hospitalier Nord, Hospices Civils de Lyon, Lyon, France
Abstract
Non-human primates infected with SARS-CoV-2 exhibit mild clinical signs. Here we used a mathematical model to characterize in detail the viral dynamics in 31 cynomolgus macaques for which nasopharyngeal and tracheal viral load were frequently assessed. We identified that infected cells had a large burst size (>104virus) and a within-host reproductive basic number of approximately 6 and 4 in nasopharyngeal and tracheal compartment, respec-tively. After peak viral load, infected cells were rapidly lost with a half-life of 9 hours, with no significant association between cytokine elevation and clearance, leading to a median time to viral clearance of 10 days, consistent with observations in mild human infections. Given these parameter estimates, we predict that a prophylactic treatment blocking 90% of viral production or viral infection could prevent viral growth. In conclusion, our results provide estimates of SARS-CoV-2 viral kinetic parameters in an experimental model of mild infection and they provide means to assess the efficacy of future antiviral treatments.
Author summary
Non-human primates infected with SARS-CoV-2 develop a mild infection resembling asymptomatic human infection. Here we used viral dynamic modelling to characterize
a1111111111 a1111111111 a1111111111 a1111111111 a1111111111 OPEN ACCESS
Citation: Gonc¸alves A, Maisonnasse P, Donati F,
Albert M, Behillil S, Contreras V, et al. (2021) SARS-CoV-2 viral dynamics in non-human primates. PLoS Comput Biol 17(3): e1008785. https://doi.org/10.1371/journal.pcbi.1008785
Editor: Roland R. Regoes, ETH Zurich,
SWITZERLAND
Received: September 16, 2020 Accepted: February 11, 2021 Published: March 17, 2021
Peer Review History: PLOS recognizes the
benefits of transparency in the peer review process; therefore, we enable the publication of all of the content of peer review and author responses alongside final, published articles. The editorial history of this article is available here: https://doi.org/10.1371/journal.pcbi.1008785
Copyright:© 2021 Gonc¸alves et al. This is an open access article distributed under the terms of the Creative Commons Attribution License, which permits unrestricted use, distribution, and reproduction in any medium, provided the original author and source are credited.
Data Availability Statement: All relevant data are
within the manuscript and itsSupporting Informationfiles.
Funding: This work was funded by the French
the nasopharyngeal and tracheal viral loads. We found that viral load rapidly declined after peak viral load despite the absence of association between model parameters and immune markers. The within-host reproductive basic reproduction number was approxi-mately equal to 6 and 4 in nasopharynx and trachea suggesting that a prophylactic therapy blocking viral entry or production with 90% efficacy could be sufficient to prevent viral growth and peak viral load.
Introduction
The severe acute respiratory syndrome coronavirus 2 (SARS-CoV-2) which originated in Wuhan, China, at the end of December 2019, has spread rapidly around the world, resulting at the end of December 2020 in more than 1,600,000 deaths [1]. Fortunately, the majority of infections do not lead to hospitalizations [2], and the vast majority of subjects infected with SARS-CoV-2 will experience asymptomatic or pauci-symptomatic infection characterized by specific (anosmia) or general symptoms (fever, fatigue) [3–5]. In other acute or chronic viral diseases (HIV, HCV, influenza), the characterization of viral load kinetics has played an important role to understand the pathogenesis of the virus and design better antiviral drugs [6–8]. In the case of SARS-CoV-2, viral kinetics has been found to be associated with mortality in hospitalized patients [9] but the association in less severe patients is unclear. This is due to the fact that many studies rely on large cross-sectional analyses with few patients having serial data points or, in contrary, on detailed small series of patients [10–12]. In that perspective, the analysis of data generated in non-human primates is a unique opportunity to characterize in detail the viral dynamics during natural infection, and to study the effects of antiviral therapy [13–15].
Here, we used data generated on nonhuman primates (NHP) and treated with hydroxy-chloroquine (HCQ)± azithromycine (AZTH) in either pre- or post-exposure prophylaxis [16] to develop a mathematical model of SARS-CoV-2 infection. Although our analysis did not reveal any significant antiviral efficacy of HCQ, the large data generated (31 cynomolgus macaques with frequent measurements of both nasopharyngeal and tracheal viral loads) allowed us to characterize in detail the key parameters driving the viral dynamics and to evalu-ate putative immune response mechanisms during the infection.
Methods
Ethics statement
Cynomolgus macaques aged 37–40 months and originating from Mauritian AAALAC certi-fied breeding centers were used in this study. Animals were housed under BSL-2 and BSL-3 containment when necessary (Animal facility authorization #D92-032-02, Prefecture des Hauts de Seine, France) and in compliance with European Directive 2010/63/EU, the French regulations and the Standards for Human Care and Use of Laboratory Animals, of the Office for Laboratory Animal Welfare (OLAW, assurance number #A5826-01, US).
The protocols were approved by the institutional ethical committee “Comite´ d’Ethique en Expe´rimentation Animale du Commissariatà l’Energie Atomique et aux Energies Alterna-tives” (CEtEA #44) under statement number A20-011. The study was authorized by the “Research, Innovation and Education Ministry” under registration number APAFIS#24434-2020030216532863v1.
TheraCoV ANR-20-COVI-0018 (JG) and also by the Bill & Melinda Gates Foundation through INV-017335 (JG). The funders had no role in study design, data collection and analysis, decision to publish, or preparation of the manuscript.
Competing interests: I have read the journal’s
policy and the authors of this manuscript have the following competing interests: A.G. PhD grant has been provided by ROCHE Company. J.G. has worked as consultant for ROCHE Company.
Experimental procedure
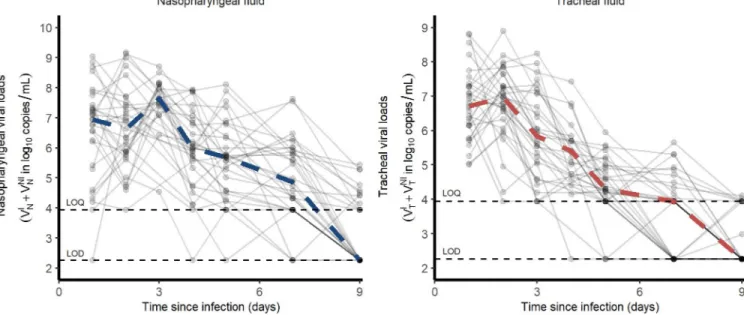
Our study includes 31 cynomolgus macaques (16 male, 15 female) infected with 106pfu (corre-sponding to 1010total RNA copies) of a primary isolate of SARS-CoV-2 (BetaCoV/France/ IDF/0372/2020). Each animal received 5 mL of the total inoculum: 90% (4.5 mL) were injected by the intra-tracheal route and 10% (0.5 mL) by the intra-nasal route [17,18]. Nasopharyngeal and tracheal swabs were collected longitudinally at days 1, 2, 3, 4, 5, 7, 9, 11, 13, 16 and 20 post-infection (pi) and eluted in 3 mL of Universal transport medium (Copan) or Viral Trans-port Medium (CDC, DSR-052-01). Viral RNA levels were assessed in each sample using a real-time PCR, with 8540 and 180 copies/mL as quantification and detection limits, respectively (Fig 1)
The original study included 6 groups treated either by a high dosing regimen (Hi) of HCQ (90 mg/kg loading dose and 45 mg/kg maintenance dose)± AZTH (36 mg/kg of at 1 dpi, fol-lowed by a daily maintenance dose of 18 mg/kg), a low dosing regimen (Lo) of HCQ (30 mg/ kg loading dose and 15 mg/kg maintenance dose) or a vehicle (water) as a placebo. Among the 23 treated animals, 14 were treated at 1 dpi with a Lo (n = 4), Hi (n = 5) dose of HCQ or HCQ +AZTH (n = 5). A late treatment initiation was also investigated in 4 animals receiving a Lo dosing regimen. Finally, 5 animals received HCQ at the Hi dose starting at day 7 prior to infec-tion as a pre-exposure prophylaxis (PrEP) (seeS1 Data)
Viral dynamic model of SARS-CoV-2
Model describing nasopharyngeal and tracheal swabs. Given that HCQ was not
associ-ated to any antiviral effect [16], we pooled the data from either treated and untreated groups. Thus, we consider all animals as controls in our primary analysis but we also investigated a potential effect of HCQ (see details inS1 Text). Nasopharynx and trachea were considered as two distinct compartments of the upper respiratory tract (URT) where each one is described by a target cell limited model [13,19,20]. In this model, susceptible cells (T) are infected by an infectious virus (VI) at a rateβ and generate non-productive infected cells (I1). After an eclipse
Fig 1. Nasopharyngeal and tracheal SARS-CoV-2 viral loads in infected cynomolgus macaques treated by a placebo or
hydroxychloroquine± azithromycin. Dashed lines represent the lower limit of detection (LOD) and lower limit of quantification (LOQ).
phase of duration 1/k on average, infected cells start to be productive (I2) and produce both
infectious and non infectious viruses at a rateμp and (1-μ)p respectively. Productive infected cells die at a rateδ and viruses are cleared at a rate c (seeS2 Text). The model is given by ordi-nary differential Eqs (1) to (5) where subscript X denotes the compartment of interest either nasopharynx or trachea. The basic reproduction number isR0 ¼
bpT0m
cd and the burst-size is
N ¼pd. dTX dt ¼ bXTXV I X ð1Þ dI1;X dt ¼ bXTXV I X kI1;X ð2Þ dI2;X dt ¼kI1;X dXI2;X ð3Þ dVI X dt ¼pXI2;Xm cV I X ð4Þ dVNI X dt ¼pXI2;Xð1 mÞ cV NI X ð5Þ
Fixed parameters. Because not all parameters can be estimated when only total viral RNA
are measured, some parameters had to be fixed based on the experimental setting or the cur-rent literature. As only the productp×T0is identifiable, we chose to fixT0,the initial
concen-trations of susceptible cells, as follows. We measured the surfaces (S) and volumes (V) of the nasopharynx and the trachea in one euthanized animal and obtainedVN= 6.3mL; VT= 1.2 mL; SN= 50 cm2;ST= 9 cm2. Assuming an apical surface of one epithelial cell ofs = 4 10−7
cm2/cell [21], the number of target cells exposed to the virus in the nasopharynx and the tra-chea are SN s�VN ¼ 1:98 � 10 7 cells=mL and ST s�VT¼ 1:88 � 10 7
cells=mL, respectively. Only a
frac-tion of these cells expresses both angiotensin-converting enzyme 2 (ACE2) and the type II transmembrane serine protease (TMPRSS2), and we fixed this proportion to 0.1% i.e.TN,0=
1.98×10⁴andTT,0= 1.88×10⁴cells in nasopharynx and trachea, respectively. Also, we supposed
that the eclipse phase duration was equal in the nasopharynx and in the trachea, and we set
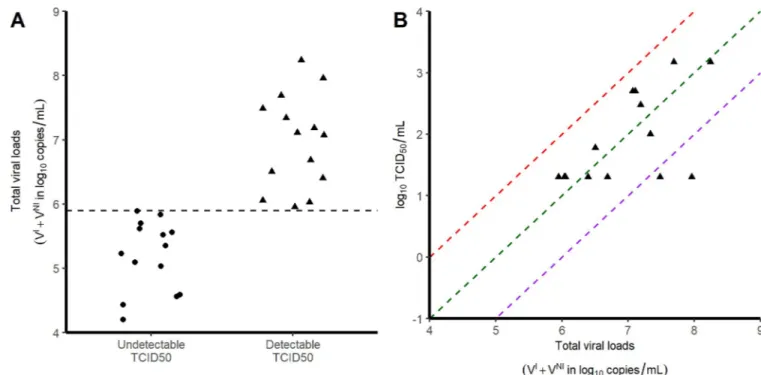
k = 3 d-1based onin vitro studies showing that virus release occurs 8 hours after infection [22]. Third, we supposed the proportion of infectious virusμ remained constant over time. TCID50
is a proxy for the infectious viruses.Fig 2Bshows that the ratio TCID50/total viral loads is 10−5
(range 10−6–10−4). However, not all the infectious viruses present in the samples may be detected in Vero-E6 cells experiments. Hence, we fixedμ to 10−4, the upper bound of the observed ratio of infectious virus. Finally the viral clearancec was fixed to 10 d-1, consistent with the rapid viral clearance rate of influenza virus [20]. Sensitivity analyses exploring the consequences of those different assumptions were performed, withc in a range 5–20 d-1,μ in a
range 10−5–10−3and the proportion of target cells being equal to 1% (seeS3 Text). Thus, the estimated parameters in each compartment were V0, p,β and δ.
Statistical model. The structural model used to describe the observed log10viral loadsYijk
for tracheal) is
Yijk¼f ðyik;tijkÞ þeijk ð6Þ
Wheref is the function describing the total viral loads dynamics over time (VI(t)+VNI(t));
θikis the vector of parameters of subjecti in the kthcompartment andeijkis the additive
resid-ual error. Individresid-ual parametersθikare supposed to follow a log-normal distribution with a
median value that depends on the compartment:
yik¼ g �expðZiÞ �exp ða � Ik¼2Þ ð7Þ
whereγ indicates the fixed effects andηithe individual random effects, which are supposed to
follow a normal distribution of mean zero and standard deviationω, and exp(α) is the vector of the ratio values between the nasal and tracheal compartments. The residual error eijkis
assumed to follow a normal distribution of mean zero and constant standard deviationσk.
Standard errors were calculated by drawing parameters in the asymptotic distribution of the parameter estimators. For each parameter, we calculated the 2.5 and 97.5% percentile to derive the 95% confidence interval.
Modelling strategy. As a first step, we considered nasopharynx and trachea parameters as
two distinct compartments and we then tested whether the virus could migrate from one com-partment to the other at a constant first order migration rate g. Parameter g was set to 0 if it did not improve the fit to the data or could not be precisely estimated. In order to reduce the number of remaining parameters, we fixed the ratio of effective inoculum,V0,T/V0,N, to 9.
Then we tested the possibility for estimated parameters to be equal in both nasopharynx and trachea (e.g.,α = 0) and tested then if their variances could be set to 0 (e.g., ω = 0). To do this,
Fig 2. Relationship between TCID50and viral loads. Each symbol corresponds to a tracheal swab obtained at 3 dpi. A) Viral load levels in samples with no
detectable infectious virus (circles) and those with detectable infectious virus (triangles). B) Correlation between the viral loads and the infectious virus, as measured by TCID50. Red, green and purple dashed lines represent putative ratios of infectious virus of 10−4; 10−5and 10−6respectively.
we used a backward selection procedure and stopped once the BIC did not decrease anymore. Lastly, based on the Empirical Bayes Estimates (EBE), we screened the random effects for cor-relations. Only correlations with a Pearson’s coefficient >0.8 were implemented in the model. All models tested are presented and compared inS4 Text.
Viral titers determination on Vero-E6 cells
Vero-E6 cells (mycoplasma-free) were seeded in 24-well plates (2×10⁵cells/well) and cultured in DMEM (Thermo Fisher Scientific) containing 1% PS (Penicillin 10,000 U/mL; Streptomy-cin 10,000μg/mL) supplemented with 5% FBS (Foetal Bovine Serum) and incubated at 37˚C in the presence of 5% CO2. The next day, cells were inoculated in triplicate with 100μL per well of the tracheal swab dilutions (1:2, 1:10, 1:50,1:250) in DMEM, 1% PS, 0.1% TPCK trypsin and incubated for 1 hour at 37˚C. After removal of the inoculum, 1mL of DMEM, 1% PS, 0.1% TPCK trypsin was added in each well before incubation at 37˚C in the presence of 5% CO2for
72 hrs. The presence of a cytopathic effect (CPE) was visualized under the microscope and the TCID50i.e. the tissue culture infective dose leading to 50% of the maximal cytopathic effect,
was calculated using the method of Reed and Mu¨nch. All experiments were conducted under strict BSL3 conditions.
Plasma cytokine analysis
In all 31 macaques, the concentration of 30 cytokines were measured at 0, 2, 5, 7 and 9 dpi. Among them, CCL11, CCL2, IFN-α, Il-15, Il-1Ra and Il-2 were of particular interest as their kinetic changed during the infection. To identify the cytokines to be incorporated in the model, we correlated the are under the cytokine curve (AUC, calculated by the linear trapezoi-dal method) with the AUC of log10viral loads predicted by the model.
Models assuming a compartment for the innate immune response
We considered additional models incorporating a compartment for an antigen-dependent immune response, F, given bydFX
dt ¼qI2;X dFFX. In these models, F could either i) reduce
viral infectivity ii) and iii) put target cells into a refractory state, iv) reduce viral production and v) increase the loss of infected cells (seeS5 Text).
Simulations of a prophylactic treatment
We used the median estimated parameter values of the model to simulate the effects of an anti-viral treatment, initiated before infection, on the anti-viral kinetics. We explored the effects of 10 to 100 fold lower viral inoculum (corresponding to doses of 105and 104pfu) as well as the effects of drugs acting on viral production, viral entry or the proportion of infectious virus. For each scenario, we also calculated the 95% confidence interval of the median time to viral clearance, using the method described above.
Parameter estimation
Parameters were estimated with the SAEM algorithm implemented in MONOLIX software version 2018R2 allowing to handle the left censored data [23]. Likelihood was estimated using the importance sampling method and the Fisher Information Matrix (FIM) was calculated by stochastic approximation. Graphical and statistical analyses were performed using R version 3.4.3.
Results
SARS-CoV-2 viral kinetics
In our experiment, cynomolgus macaques developed a rapid infection, with viral loads peaking 2 days post infection (dpi) in both nasopharyngeal and tracheal compartments. Afterwards, both nasopharyngeal and tracheal viral loads rapidly declined exponentially, with a similar median rate of 1.9 d-1, corresponding to a daily reduction of 0.8 log10copies/mL (Fig 1).
Because the viral load peaked later and higher in in the nasopharynx than in the trachea (7.9 and 7.2 log10, respectively), the median time to unquantifiable viral load nonetheless occurred
later in the nasopharynx than in the trachea (9 and 7 dpi, respectively).
Overall, the area under the viral load curve (AUC) was larger in the nasopharynx than in the trachea (45 vs 38 log10copies.day/mL,p<10−4). In addition to viral RNA, we also measured
virus titers in Vero-E6 cells using tracheal swabs obtained at 3 dpi (seeMethods). All samples contained more than 4 log10copies/mL however viral growth was observed only in those
hav-ing more than 6 log10copies/mL (Fig 2A). In those for which viral culture could be obtained,
the ratio of TCID50(median tissue culture infective dose) to the total number of RNA copies
ranged between 10−4to 10−6(Fig 2B).
Viral dynamic model
Importantly, there was no antiviral effect in animals receiving various doses of HCQ compared to those receiving vehicles, even after adjustment on the mean HCQ exposure [16]. Thus, the effect of treatment was neglected as a first approximation. We later challenged this hypothesis but found no significant effect of HCQ in reducing viral production or viral infectivity (seeS1 Text).
Physiologically, viruses can migrate from the nasopharynx to the trachea through respira-tion and movements of ciliary cells at the mucosal surface. Thus, we tested the possibility for viruses to move from nasopharyngeal to tracheal compartment andvice versa by linking both
with a bidirectional rate constantg. However, possibly due to data paucity, the parameter g
was not significantly different from 0 (CI95%included 0) and was therefore set to 0 in the
fol-lowing. Then, using a backward selection procedure we found that the infectivity rateβ and the viral productionp were different between nasopharyngeal and tracheal compartments
(Table 1). The final model well fitted the data and allowed the estimation of several parameters of the infection (Fig 3). We estimated the effective initial viral load to 1.7×10⁶and 8.0×10⁷ cop-ies/mL in tracheal and nasal compartments, respectively, which corresponds to a total inocu-lum of approximately 108total RNA, i.e., about 1% of the total injected dose (seeMethods).
We found estimates ofβ of 1.2×10⁻³(CI95%0.5×10⁻³−2.8×10⁻³) and 1.8×10⁻³(CI95%0.6×10 −-3
−5.6×10⁻³) mL/virion/day (p<10−4) in nasopharynx and trachea, respectively, whilep was
estimated to 4.8×10⁴(CI95%1−8.8×10⁴) and 2.2×10⁴(CI95%0.7−4.1×10⁴) virions/cell/day
(p<0.05). Consequently the product p×T0was equal to 9.5×10⁸(CI95%2.0–17×108) and
3.9×10⁸(CI95%1.2–17.7×10⁸) virions/mL/day in nasopharynx and trachea, respectively.
The loss rate of infected cells,δ, was not found different between the two compartments and estimated to 1.9 (CI95%1.6–2.3) d-1corresponding to an infected cell half-life of 9 (CI95%
7–13) hours. These parameter estimates allow us to derive the basic reproduction numberR0
corresponding to the number of infected cells generated by a single infected cell at the begin-ning of the infection. We foundR0,Nequal to 5.6 (CI95%1.3–21) andR0,Tequal to 3.8 (CI95%
0.7–18) in the nasopharynx and the trachea, respectively. One can also derive the viral burst
sizeN corresponding to the number of viruses produced by an infected cell over its lifespan.
We foundNN= 25,000 (CI95%5,900–72,000) virions andNT= 11,000 (CI95%4,000–19,000)
Sensitivity analysis
In our main analysis, the viral clearance c and the proportion of infectious virusμ were fixed.
We tested the robustness of our results to different values of these parameters (seeS3 Text) and we used model averaging (MA) to compute the averaged parameters values following a methodology presented in [24]. Overall, models were broadly undistinguishable as they pro-vided a Bayesian Information Criterion within a 4 points range. Model averaged parameter estimates ofδ, R0,Nand R0,Twere equal to 1.9 (CI95%1.5−2.3) d-1, 6.8 (CI95%1.3−29) and 4.4
(CI95%1−26), respectively.
Immune markers during SARS-CoV-2 infection
Among the 30 cytokines tested, 6 greatly varied during the infection and peaked at 2 dpi (namely CCL11, CCL2, IFN-α, IL-15, IL-1RA and IL-2) but there was no association between cytokine and viral loads (Fig 4). A model assuming an effect of the immune response in cell protection resulted in a reduced BIC of 6 points. However, the gain in fitting criterion was entirely due to 3 individuals (seeS5 Text) and led to more uncertainty in parameter estimates due to increased complexity (see Table B inS5 Text). Moreover none of the cytokines mea-sured during the experiments, including IFN-a, showed a correlation with viral dynamics (Fig 5). Thus, overall, there was no clear evidence in these data that a more complex model improved the understanding of viral dynamics over a simple target cell model.
Expected profiles with prophylaxis treatments
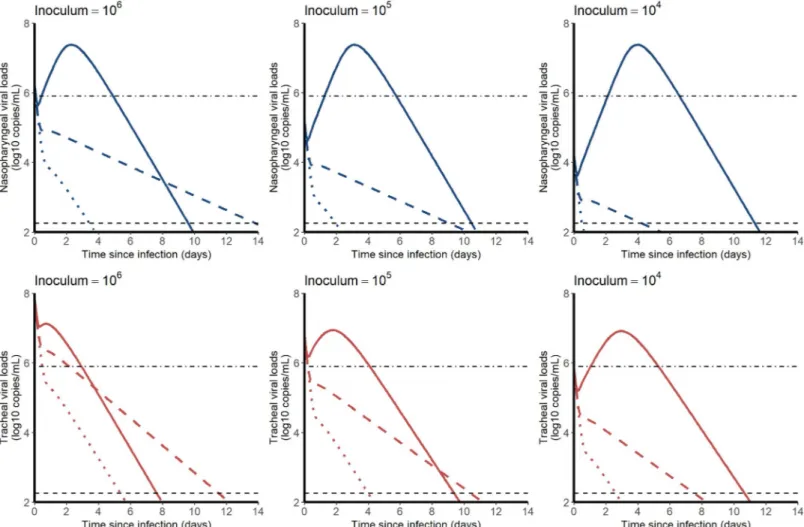
We used estimated parameter values of the model to simulate the effects of an antiviral treat-ment, initiated before infection, on the viral kinetics. We explored different viral inoculum (ranging from 104to 106pfu), drugs mechanisms of action (blocking viral production, viral entry, or infectious virus production), with different levels of antiviral efficacy. As the conclu-sions were not sensitive to the mechanism of action, we present below the results for a prophy-lactic drug blocking viral entry (Fig 6). Other mechanisms of action are presented inS6 Text.
In both compartments, the median time to viral clearance increased with lower doses of inoculum, and ranged from 10.1 (CI95%8.4–14.7) days with 106pfu to 11.7 (CI95%9.5–19.0)
Table 1. Population parameter estimates of the final model described by Eq (1) to (5). Numbers in parenthesis are
the relative standard error expressed in percentage (RSE%) associated either to the fixed or the standard deviation (SD) of random effects.
Parameters (units) Fixed effects (RSE%) SD of random effects (RSE%)
βT(mL.copie/d) 1.8×10⁻³(42) 0.3 (33) βN(mL.copie/d) 1.2×10⁻³(12) pT(copies/cell/d) 2.2×10 4 (49) 1.0 (27) pN(copies/cell/d) 4.8×10⁴(40) VT,0(copies/mL) 8.0×10⁷(9) -VN,0(copies/mL) 1.7×10⁶(9) -δ (1/d) 1.9 (9) 0.2 (37) c (1/d) 10 (fixed) -μ (unitless) 10−3(fixed) -k (1/d) 3 (fixed) -TT,0(cells/mL) 1.88×10 4 (fixed) -TN,0(cells/mL) 1.98×10⁴(fixed) σT 1.06 (6) -σN 1.19 (6) -https://doi.org/10.1371/journal.pcbi.1008785.t001
days with 104pfu in the nasopharynx. A 90% effective antiviral treatment administered upon infection would dramatically reduce peak viral load in all scenario and maintain virus below the threshold level of infectivity of 6 log10copies/mL (Fig 2A). A 99% effective antiviral
treat-ment could in addition abrogate viral load viral load, with time to viral clearance ranging from
Fig 3. Nasopharyngeal (blue) and tracheal (red) individual predicted dynamics by the model described in Eqs (1) to (5). Full dots are the quantifiable viral loads and crosses the observation below the limit of quantification. The dotted line represents the limit of quantification and the dashed line the limit of detection.
3.5 (CI95%1.9–6.2) days with 106pfu to 0.5 (CI95%0.2–2.5) days with 104pfu in the
nasopharynx.
Discussion
We here developed a mathematical model for SARS-CoV-2 viral dynamics using nasopharyn-geal and tracheal swabs obtained in 31 infected macaques. Using this model we could estimate key parameters of virus pathogenesis, in particular the viral infectivity rate (equal to 1.2×10⁻³ and 1.8×10⁻³in tracheal and nasopharyngeal compartments, respectively), and the loss rate of infected cells, estimated to 1.9 d-1in both compartments (e.g., a half-life of 9 hours). Conse-quently, we estimated the number of secondary cell infection resulting from one infected cells,
R0, to approximately 4 and 6 in tracheal and nasopharyngeal compartments, respectively. This
value ofR0,together with the large viral inoculum used in this experimental model (106pfu),
explains that tracheal viral loads barely increased post-infection and that nasopharyngeal viral loads rapidly peaked at 3 dpi. After peak viral load, the rapid loss rate of infected cells was suffi-cient to explain that clearance of the virus occurred around day 10 in both compartments, and we did not find evidence in this model for a role of an immune response mediated by cytokines in accelerating the viral clearance.
Although the number of animals and the very detailed kinetic data allowed the precise esti-mation of several parameters, some limitations exist. First, animals were infected with a large inoculum (106pfu, i.e. 1010RNA copies) which rapidly saturate target cells making the estima-tion ofβ less robust and difficult to distinguish the processes of clearance of the inoculum from those ofde novo viral infections. In the future, the analysis of subgenomic RNA, that
quantifies intracellular viral transcription, will provide important information to distinguish these two processes and provide a more precise estimate of R0[25,26]. Second, a number of
unknown parameters were fixed to ensure identifiability, in particular the proportion of infec-tious virus,μ, and the number of target cells available in each compartment, T0. In this model,
p×T0is the only reliable quantity since the estimate of p depends on the number of susceptible
cells. We here estimated the number of alveolar type II cells by analysis of the size of the tissues of one euthanized animal and we assumed that 0.1% of these cells could be target for the virus. Although this value led to more coherent parameter estimates (seeS3 Text), this is higher than the value of 1% of cells expressing the ACE2 receptor and serine protease TMPRSS2 found in humans [27,28]. Specific experiments will be needed to estimate the proportion of target cells
Fig 4. Cytokine concentrations during SARS-CoV-2 infection.
in the URT of macaques. Third, we relied only on measures in both compartments of the upper respiratory tract, which may not reflect the kinetics in the lower respiratory tract. It is in particular possible that the kinetics of both the virus and the immune response may be differ-ent in the lung, and that both cytokine responses and the lesions as observed by CT scans may be associated with viral loads in the lungs. In our experiments the first viral load measurements in bronchoalveolar lavages (BAL) was made at 6 dpi, and were all below the limit of detection at the next available data point at day 14, precluding a more detailed analysis of the kinetics in the lungs.
We also aimed to evaluate whether more complex models including an antigen-dependent immune response could improve the data fitting. A model assuming that cells could be put in
Fig 5. Correlation between the individual predicted AUC log10viral load and cytokine AUC. None of the 6
cytokines that increased during the infection was significantly correlated with the predicted viral load AUC in the nasopharynx or the trachea.
an antiviral state improved the BIC (seeS4 Text), however this improvement was due to 3 individuals, and this came to the expense of a deteriorated precision of parameter estimates. Further, none of the observed cytokines were found associated with viral dynamics (Fig 5), suggesting that this improvement in data fitting was not supported by our data. In addition, none of the animals had detectable antibodies until day 7, and only 25% had detectable anti-bodies by day 14, suggesting that the humoral response played a minor role in viral clearance. The role of the immune response in this experimental model of mild infection is unclear, but our findings are consistent with data obtained in patients with an asymptomatic infection, in which the immune response and the cytokine response remained low throughout the infection period [29]. Accordingly our estimate of the duration of viral shedding was between 10 and 12 days in the nasopharynx, depending on the initial inoculum, very close to the values of 9 days
(Diamond Princess [30]) and 12 days [11] estimated in mild or asymptomatic individuals.
From an experimental setting, the analysis of viral dynamics in animals infected with different size of viral inoculum could also bring insights on the need to use more complex models [31].
Finally, we used the model to inform on the use of prophylactic drugs in this macaque model. Given our estimate of R0, a 90% effective treatment should be able to prevent virus
Fig 6. Median viral kinetic profiles in the nasopharynx (blue) and the trachea (red) according to the inoculum size and the level of an antiviral initiated in prophylaxis and blocking viral entryβ. Treatment efficacy of 0% (no treatment, solid line), 90% (dashed line) and 99% (dotted lines) were considered. Point-dotted line
represents the threshold below which no virus could be cultured in vitro (Fig 2). https://doi.org/10.1371/journal.pcbi.1008785.g006
growth and would maintain the viral load levels below 106copies/mL at all times, making the chance of detecting infectious virus very limited, consistent with our modeling predictions in humans ([32]).
Supporting information
S1 Text. Effects of hydroxychloroquine.
(DOCX)
S2 Text. Model file for Monolix.
(TXT)
S3 Text. Sensitivity analysis.
(DOCX)
S4 Text. Model building.
(DOCX)
S5 Text. Immune response models.
(DOCX)
S6 Text. Simulations.
(DOCX)
S1 Data. Nasaopharyngeal and tracheal swabs data file.
(TXT)
Acknowledgments
We thank Peter Czuppon (Collège de France & Sorbonne Universite´), Franc¸ois Blanquart (Collège de France & INSERM UMR1137) for critical reading and expertise on the analysis.
Author Contributions
Conceptualization: Antonio Gonc¸alves, Pauline Maisonnasse, Vanessa Contreras, Thibaut
Naninck, Romain Marlin, Caroline Solas, Xavier de Lamballerie, France Mentre´, Roger Le Grand, Sylvie van der Werf, Je´re´mie Guedj.
Data curation: Antonio Gonc¸alves, Pauline Maisonnasse, Flora Donati, Me´lanie Albert, Sylvie
Behillil, Vanessa Contreras, Thibaut Naninck, Romain Marlin, Caroline Solas, Andres Piz-zorno, Julien Lemaitre, Nidhal Kahlaoui, Olivier Terrier, Raphael Ho Tsong Fang, Vincent Enouf, Nathalie Dereuddre-Bosquet, Angela Brisebarre, Franck Touret, Catherine Chapon, Bruno Hoen, Bruno Lina, Manuel Rosa Calatrava, Xavier de Lamballerie, France Mentre´, Roger Le Grand, Sylvie van der Werf.
Formal analysis: Antonio Gonc¸alves, Pauline Maisonnasse, Vanessa Contreras, Thibaut
Naninck, Romain Marlin, Caroline Solas, Xavier de Lamballerie, Roger Le Grand, Sylvie van der Werf, Je´re´mie Guedj.
Funding acquisition: Je´re´mie Guedj.
Investigation: Antonio Gonc¸alves, Pauline Maisonnasse, Vanessa Contreras, Romain Marlin,
Caroline Solas, Julien Lemaitre, Nidhal Kahlaoui, Xavier de Lamballerie, France Mentre´, Roger Le Grand, Sylvie van der Werf, Je´re´mie Guedj.
Methodology: Antonio Gonc¸alves, Pauline Maisonnasse, Vanessa Contreras, Thibaut
Naninck, Romain Marlin, Caroline Solas, Xavier de Lamballerie, France Mentre´, Roger Le Grand, Sylvie van der Werf, Je´re´mie Guedj.
Project administration: Pauline Maisonnasse, Roger Le Grand, Sylvie van der Werf, Je´re´mie
Guedj.
Supervision: Raphael Ho Tsong Fang, Nathalie Dereuddre-Bosquet, Catherine Chapon,
France Mentre´, Sylvie van der Werf, Je´re´mie Guedj.
Writing – original draft: Antonio Gonc¸alves, Pauline Maisonnasse, Vanessa Contreras,
Thi-baut Naninck, Caroline Solas, Roger Le Grand, Sylvie van der Werf, Je´re´mie Guedj.
Writing – review & editing: Antonio Gonc¸alves, Pauline Maisonnasse, Vanessa Contreras,
Thibaut Naninck, Caroline Solas, Roger Le Grand, Sylvie van der Werf, Je´re´mie Guedj.
References
1. Weekly epidemiological update—22 December 2020. [cited 11 Jan 2021]. Available:https://www.who. int/publications/m/item/weekly-epidemiological-update—22-december-2020
2. Lapidus N, Paireau J, Levy-Bruhl D, de Lamballerie X, Severi G, Touvier M, et al. Do not neglect SARS-CoV-2 hospitalization and fatality risks in the middle-aged adult population. Infect Dis Now. 2021 [cited 21 Feb 2021].https://doi.org/10.1016/j.idnow.2020.12.007PMID:33521775
3. Chen N, Zhou M, Dong X, Qu J, Gong F, Han Y, et al. Epidemiological and clinical characteristics of 99 cases of 2019 novel coronavirus pneumonia in Wuhan, China: a descriptive study. The Lancet. 2020; 395: 507–513.https://doi.org/10.1016/S0140-6736(20)30211-7PMID:32007143
4. Yang X, Yu Y, Xu J, Shu H, Xia J, Liu H, et al. Clinical course and outcomes of critically ill patients with SARS-CoV-2 pneumonia in Wuhan, China: a single-centered, retrospective, observational study. The Lancet Respiratory Medicine. 2020; 8: 475–481.https://doi.org/10.1016/S2213-2600(20)30079-5
PMID:32105632
5. Wu F, Wang A, Liu M, Wang Q, Chen J, Xia S, et al. Neutralizing antibody responses to SARS-CoV-2 in a COVID-19 recovered patient cohort and their implications. medRxiv. 2020 [cited 2 Jun 2020].https:// doi.org/10.1101/2020.03.30.20047365
6. Guedj J, Bazzoli C, Neumann AU, Mentre´ F. Design evaluation and optimization for models of hepatitis C viral dynamics. Statistics in Medicine. 2011; 30: 1045–1056.https://doi.org/10.1002/sim.4191PMID:
21337592
7. Lovern M, Minton SK, Patel K, Xiong Y, Kirkpatrick CM, Smith PF. Applications of Influenza Viral Kinetic Modeling in Drug Development. Curr Pharmacol Rep. 2017; 3: 294–300.https://doi.org/10.1007/ s40495-017-0104-3
8. Hill AL, Rosenbloom DIS, Nowak MA, Siliciano RF. Insight into treatment of HIV infection from viral dynamics models. Immunol Rev. 2018; 285: 9–25.https://doi.org/10.1111/imr.12698PMID:30129208
9. Ne´ant N, Lingas G, Hingrat QL, Ghosn J, Engelmann I, Lepiller Q, et al. Modeling SARS-CoV-2 viral kinetics and association with mortality in hospitalized patients from the French COVID cohort. PNAS. 2021; 118.https://doi.org/10.1073/pnas.2017962118PMID:33536313
10. Zheng S, Fan J, Yu F, Feng B, Lou B, Zou Q, et al. Viral load dynamics and disease severity in patients infected with SARS-CoV-2 in Zhejiang province, China, January-March 2020: retrospective cohort study. BMJ. 2020; 369.https://doi.org/10.1136/bmj.m1443PMID:32317267
11. Young BE, Ong SWX, Kalimuddin S, Low JG, Tan SY, Loh J, et al. Epidemiologic Features and Clinical Course of Patients Infected With SARS-CoV-2 in Singapore. JAMA. 2020 [cited 29 Mar 2020].https:// doi.org/10.1001/jama.2020.3204PMID:32125362
12. Woelfel R, Corman VM, Guggemos W, Seilmaier M, Zange S, Mueller MA, et al. Clinical presentation and virological assessment of hospitalized cases of coronavirus disease 2019 in a travel-associated transmission cluster. medRxiv. 2020 [cited 2 Jun 2020].https://doi.org/10.1101/2020.03.05.20030502
13. Best K, Guedj J, Madelain V, de Lamballerie X, Lim S-Y, Osuna CE, et al. Zika plasma viral dynamics in nonhuman primates provides insights into early infection and antiviral strategies. Proceedings of the National Academy of Sciences. 2017; 114: 8847–8852.https://doi.org/10.1073/pnas.1704011114
14. Madelain V, Baize S, Jacquot F, Reynard S, Fizet A, Barron S, et al. Ebola viral dynamics in nonhuman primates provides insights into virus immuno-pathogenesis and antiviral strategies. Nat Commun. 2018; 9: 4013.https://doi.org/10.1038/s41467-018-06215-zPMID:30275474
15. Guedj J, Piorkowski G, Jacquot F, Madelain V, Nguyen THT, Rodallec A, et al. Antiviral efficacy of favi-piravir against Ebola virus: A translational study in cynomolgus macaques. PLOS Medicine. 2018; 15: e1002535.https://doi.org/10.1371/journal.pmed.1002535PMID:29584730
16. Maisonnasse P, Guedj J, Contreras V, Behillil S, Solas C, Marlin R, et al. Hydroxychloroquine in the treatment and prophylaxis of SARS-CoV-2 infection in non- human primates. Nature. 2020 [cited 3 Jun 2020].https://doi.org/10.21203/rs.3.rs-27223/v1
17. Kobasa D, Jones SM, Shinya K, Kash JC, Copps J, Ebihara H, et al. Aberrant innate immune response in lethal infection of macaques with the 1918 influenza virus. Nature. 2007; 445: 319–323.https://doi. org/10.1038/nature05495PMID:17230189
18. Cillo´niz C, Shinya K, Peng X, Korth MJ, Proll SC, Aicher LD, et al. Lethal influenza virus infection in macaques is associated with early dysregulation of inflammatory related genes. PLoS Pathog. 2009; 5: e1000604.https://doi.org/10.1371/journal.ppat.1000604PMID:19798428
19. Pawelek KA, Huynh GT, Quinlivan M, Cullinane A, Rong L, Perelson AS. Modeling within-host dynam-ics of influenza virus infection including immune responses. PLoS Comput Biol. 2012; 8: e1002588.
https://doi.org/10.1371/journal.pcbi.1002588PMID:22761567
20. Baccam P, Beauchemin C, Macken CA, Hayden FG, Perelson AS. Kinetics of influenza A virus infection in humans. J Virol. 2006; 80: 7590–7599.https://doi.org/10.1128/JVI.01623-05PMID:16840338
21. Fedoseev G, Geharev S. Basic defence mechanisms of bronchio-lung system. In Outov NV. Moscow, Russia; 1989.
22. Agostini ML, Andres EL, Sims AC, Graham RL, Sheahan TP, Lu X, et al. Coronavirus Susceptibility to the Antiviral Remdesivir (GS-5734) Is Mediated by the Viral Polymerase and the Proofreading Exoribo-nuclease. mBio. 2018; 9.https://doi.org/10.1128/mBio.00221-18PMID:29511076
23. Samson A, Lavielle M, Mentre´ F. Extension of the SAEM algorithm to left-censored data in nonlinear mixed-effects model: Application to HIV dynamics model. Computational Statistics & Data Analysis. 2006; 51: 1562–1574.https://doi.org/10.1016/j.csda.2006.05.007
24. Gonc¸alves A, Mentre´ F, Lemenuel-Diot A, Guedj J. Model Averaging in Viral Dynamic Models. AAPS J. 2020; 22: 48.https://doi.org/10.1208/s12248-020-0426-7PMID:32060662
25. Baum A, Ajithdoss D, Copin R, Zhou A, Lanza K, Negron N, et al. REGN-COV2 antibodies prevent and treat SARS-CoV-2 infection in rhesus macaques and hamsters. Science. 2020; 370: 1110–1115.
https://doi.org/10.1126/science.abe2402PMID:33037066
26. Chandrashekar A, Liu J, Martinot AJ, McMahan K, Mercado NB, Peter L, et al. SARS-CoV-2 infection protects against rechallenge in rhesus macaques. Science. 2020; 369: 812–817.https://doi.org/10. 1126/science.abc4776PMID:32434946
27. Muus C, Luecken MD, Eraslan G, Waghray A, Heimberg G, Sikkema L, et al. Integrated analyses of sin-gle-cell atlases reveal age, gender, and smoking status associations with cell type-specific expression of mediators of SARS-CoV-2 viral entry and highlights inflammatory programs in putative target cells. bioRxiv. 2020; 2020.04.19.049254.https://doi.org/10.1101/2020.04.19.049254
28. Bezara MEO, Thurman A, Pezzulo AA, Leidinger MR, Klesney-Tait JA, Karp PH, et al. Heterogeneous expression of the SARS-Coronavirus-2 receptor ACE2 in the human respiratory tract. Cell Biology; 2020 Apr.https://doi.org/10.1101/2020.04.22.056127PMID:32577664
29. Long Q-X, Tang X-J, Shi Q-L, Li Q, Deng H-J, Yuan J, et al. Clinical and immunological assessment of asymptomatic SARS-CoV-2 infections. Nat Med. 2020 [cited 26 Jun 2020].https://doi.org/10.1038/ s41591-020-0965-6PMID:32555424
30. Sakurai A, Sasaki T, Kato S, Hayashi M, Tsuzuki S, Ishihara T, et al. Natural History of Asymptomatic SARS-CoV-2 Infection. N Engl J Med. 2020; NEJMc2013020.https://doi.org/10.1056/NEJMc2013020
PMID:32530584
31. Li Y, Handel A. Modeling inoculum dose dependent patterns of acute virus infections. Journal of Theo-retical Biology. 2014; 347: 63–73.https://doi.org/10.1016/j.jtbi.2014.01.008PMID:24440713
32. Czuppon P, De´barre F, Gonc¸alves A, Tenaillon O, Perelson AS, Guedj J, et al. Predicted success of prophylactic antiviral therapy to block or delay SARS-CoV-2 infection depends on the targeted mecha-nism. PLoS Comput Biol 2021.https://doi.org/10.1371/journal.pcbi.1008752PMID:33647008