HAL Id: tel-02525330
https://tel.archives-ouvertes.fr/tel-02525330
Submitted on 30 Mar 2020HAL is a multi-disciplinary open access archive for the deposit and dissemination of sci-entific research documents, whether they are pub-lished or not. The documents may come from teaching and research institutions in France or abroad, or from public or private research centers.
L’archive ouverte pluridisciplinaire HAL, est destinée au dépôt et à la diffusion de documents scientifiques de niveau recherche, publiés ou non, émanant des établissements d’enseignement et de recherche français ou étrangers, des laboratoires publics ou privés.
Kisoo Kim
To cite this version:
Kisoo Kim. Interventional MR Elastography for the monitoring of thermal ablations. Medical Imag-ing. Université de Strasbourg, 2019. English. �NNT : 2019STRAD045�. �tel-02525330�
ÉCOLE DOCTORALE MSII
ICube – UMR 7357
THÈSE
présentée par :Kisoo KIM
pour obtenir le grade de :
Docteur de l’Université de Strasbourg
Discipline/ Spécialité: Imagerie physique
La date de soutenance :
26/11/2019
Interventional MR Elastography for the monitoring of
thermal ablations
THÈSE dirigée par :
VAPPOU Jonathan Chargé de Recherche, CNRS, Université de Strasbourg
GANGI Afshin Professeur, Hôpitaux Universitaires de Strasbourg
RAPPORTEURS :
PARKER Dennis L. Professeur, University of Utah, UT
SALAMEH Najat Professeur, University of Basel, CH
EXAMINATEURS :
BRETON Elodie Ingénieur de recherche, CNRS, Université de Strasbourg
i
Le cancer est récemment devenu la principale cause de décès dans les pays les plus développés. On estime à 3,9 millions le nombre de nouveaux cas de cancers et à 1,93 million le nombre de décès en 2018 en Europe. Parmi les procédures de traitement les plus répandues, les ablations thermiques des tumeurs (ou thermothérapie) présentent l’avantage de cibler précisément les zones à traiter tout en évitant le plus possible d’endommager les tissus sains environnants. La thermothérapie est souvent combinée à une méthode d’imagerie telle que la tomodensitométrie, l'échographie ou l'imagerie par résonance magnétique (IRM). Ce suivi par l’imagerie est nécessaire car il permet au radiologue de repérer les lésions, de décider d’une stratégie de traitement et de veiller au bon déroulement de la procédure. L’IRM est une modalité permettant d’étudier avec précision les tissus mous, fournissant des images avec un meilleur contraste comparées à celles obtenues par scanner ou échographie. De plus, il s’agit d’une technique d’imagerie non invasive et non ionisante permettant d’imager des organes profonds en trois dimensions et selon n’importe quelle orientation.
Le suivi des ablations thermiques par IRM a deux objectifs spécifiques : 1) le suivi en temps réel de l’évolution de la température dans la région traitée, afin de contrôler la quantité d’énergie déposée 2) l’évaluation en temps réel des effets du traitement sur les tissus. La thermométrie IRM (TRM) est couramment utilisée pour contrôler le dépôt d’énergie thermique et estimer les dommages infligés aux tissus au cours des ablations thermiques guidées par IRM. Plus récemment, l’élasticité ou la rigidité des tissus, pouvant être mesurée par élastographie IRM (ERM), a fait l’objet d’une attention croissante en tant que biomarqueur complémentaire de la température.
Bien que le suivi de l’évolution de la température et de l'élasticité des tissus soit une technique récente largement exploitée dans le domaine de la recherche, cette technique n'est pas encore adoptée en tant que standard clinique pour le suivi des thermothérapies. Sa limitation à certains types de tissus et son faible taux de rafraichissement d’images ne répondent pas encore aux conditions d'utilisation clinique standard.
Cette thèse de doctorat présente un ensemble de méthodes développées pour la thermométrie et l’ERM interventionnelle.
La première partie de ce travail est consacrée au développement d'une séquence ERM multicoupe rapide permettant une meilleure couverture spatiale de la région concernée par la thermothérapie. Un système d’ablation HIFU (ultrasons focalisés de haute intensité) compatible IRM a été utilisé dans le cadre de cette thèse. En effet, une couverture spatiale 3D complète de la zone d'ablation est privilégiée à un simple mode d'imagerie 2D pour deux raisons. Premièrement, les images 2D peuvent se retrouver décentrées par rapport à la région d’observation et ne pas rendre compte
ii
faussées. Deuxièmement, seule l’imagerie tridimensionnelle peut fournir avec précision la structure de la zone d'ablation, déterminée par la structure locale des tissus (flux sanguin, dépôt de chaleur, physiologie des tissus, etc.) que seule l’imagerie tridimensionnelle peut fournir. Le premier projet vise à proposer l'utilisation d’une séquence à double écho (« Simultaneous Echo Refocusing », SER) qui peut permettre l'encodage simultané ERM et l'acquisition de 2 coupes par TR, et à démontrer la faisabilité d'un suivi multi-coupe des changements de température et d'élasticité au cours des ablations thermiques. La validation de notre méthode s’est effectuée en trois étapes : une première expérience réalisée sur fantôme a d’abord permis de confronter notre nouvelle séquence d’ERM à la méthode standard. La deuxième expérience a eu pour but de valider l'utilisation de la méthode SER pour le suivi des changements de température et d'élasticité pendant une ablation HIFU. Troisièmement, l'expérience HIFU dans le tissu musculaire du poulet a eu pour but d´évaluer les variations de volume subies par le tissu pendant l'ablation HIFU.
La deuxième partie de cette thèse présente une nouvelle stratégie d'acquisition IRM rendant possible la thermométrie et l’élastographie simultanées pour le suivi des ablations thermiques dans tous les tissus mous, y compris en présence de graisse. D'un côté, la thermométrie PRFS référencée à la graisse permet de mesurer la température tout en corrigeant la dérive du champ magnétique principal. D'autre part, l’ERM permet de mesurer les propriétés mécaniques des tissus qui sont liées à des dommages structuraux tissulaires durant les ablations. La stratégie proposée offre une amélioration de la surveillance combinée ERM/TRM en temps réel des ablations thermiques, en élargissant sa précision dans les tissus mous, y compris les tissus contenant des graisses, tout en maintenant le temps d'acquisition similaire. Pour la validation, trois expériences sont effectuées. Premièrement, une mesure précise de la température est validée dans une expérience fantôme en utilisant des couples thermiques à fibres optiques. La deuxième expérience est effectuée pour valider les cartes d'élasticité obtenues comparées à celles reconstruites par la séquence d’ERM de référence. Troisièmement, des expériences HIFU dans du muscle de porc avec des fractions adipeuses homogènes sont menées pour évaluer la faisabilité clinique.
Dans cette thèse de doctorat, deux travaux différents auront un impact important sur les ERM/TRM interventionnelles en fournissant : 1) des ERM/TRM multicoupes rapides pour contrôler précisément le dépôt d’énergie; 2) une évaluation des lésions tissulaires dans les tissus mous en prenant en compte la présence de graisse.
Mots clés: imagerie par résonance magnétique (IRM), élastographie par résonance magnétique (ERM), ablation thermique, IRM interventionnelle
iii
In 2018, the cancer burden in Europe is estimated to 3.9 million of new cases and 1.93 million of cancer deaths. Thermal therapy has been adopted in the treatment of localized tumors over the last decade. Thermal energy is delivered in order to treat cancer tissue while minimizing normal tissue damage as much as possible. Thermal therapy is often performed in combination with Computed Tomography (CT), Ultrasound (US), and Magnetic Resonance Imaging (MRI). Radiologists rely on such real-time guidance in order to monitor the treatment response and avoid complications. MRI provides rich soft tissue contrasts compared to CT and US. Furthermore, MRI can take an image in any scan orientation and employs non-ionizing and non-invasive measures.
MR Imaging for thermal therapy has two specific aims: 1) real-time temperature monitoring that can control energy deposition. 2) assessment of tissue damage that can provide the treatment response. MR Thermometry (MRT) is commonly used to control heat deposition and to estimate tissue damage during MR-guided thermal ablations. Recently, tissue elasticity, which can be measured by MR Elastography, has received increasing attention as a biomarker that would be complementary to temperature because thermal tissue damage can affect the mechanical properties of tissue, for example, through tumor necrosis or protein coagulation.
Although temperature-elasticity monitoring for thermal ablation is already developed, this technique has not yet reach clinical use. This Ph.D. thesis applies a set of different developments dedicated to interventional MRE/MRT.
The first part of this thesis is dedicated to the development of fast multislice MRE sequence for improved spatial coverage during thermal therapy. MR-compatible High Intensity Focused Ultrasound (HIFU) device is used for this Ph.D. work. Full spatial coverage of the ablation area is desirable compared to 2D imaging for two reasons. First, the 2D images may not be properly centered on the heated zone, hence maximum temperature increase and exact heat localization may be missed. Second, the geometry of the ablation area is shaped by local tissue configuration (blood flow, spatially varying heat deposition, tissue physiology, etc.), that only 3D coverage can provide. The first project aims to propose the use of simultaneous echo refocusing (SER) that can permit simultaneous MRE encoding and acquisition of 2 slices in a single acquisition, and to demonstrate the feasibility of multislice monitoring of temperature and elasticity changes during thermal ablations. For the validation, three experiments are conducted: First, a phantom experiment is prepared for comparison with regular MRE sequence. The second experiment is conducted to validate the use of the SER method for monitoring temperature and elasticity changes during HIFU ablation. Third, HIFU experiment in chicken muscle tissue is carried out to monitor the volumetric change of tissue structure during HIFU ablation.
iv
including fat containing tissues. On one side, fat referenced PRFS thermometry makes it possible to measure temperature while enabling field-drift correction. On the other side, MRE enables measuring the mechanical properties of the tissue that are related to tissue structural damage during ablations. The proposed strategy offers a refinement of the combined MRT/MRE real-time monitoring of thermal ablations, extending its accuracy in soft tissues including fat containing tissues, while keeping the acquisition time similar. For the validation, three experiments are conducted: First, accurate temperature measurement is validated in a phantom experiment by using fiber optic thermal couples. The second experiment is conducted to validate elasticity maps as compared to those reconstructed with the regular MRE sequence. Third, HIFU experiments in pig rib tissue with homogenous fat fractions are conducted to evaluate the clinical feasibility.
In this Ph.D. thesis, two different works will have substantial impact on interventional MRE/MRT by providing: 1) Fast multislice MRE/MRT to control precise energy deposition. 2) Assessment of tissue damage in all types of soft tissues.
Keywords: Magnetic resonance imaging, MR Elastography, thermal ablation, interventional MRI
v
Acknowledgements
I would like to express my sincere thanks to Dr. E. Breton, CNRS and Dr. J. Vappou, CNRS for giving me scholarly criticism, unconditional support, and constant encouragement. I could not have completed my Ph.D. without their dedicated efforts.
I would also like to thank people who have kindly helped me in preparing materials regarding this Ph.D. project: Prof. A. Gangi, Hôpitaux Universitaires de Strasbourg, Dr. P. Cabras, CNRS, and MSc. K. Choquet, University of Strasbourg.
I am grateful to my parents, my sister and brother for their endless love and supports. Dear parents, I know you sacrifice all your life to give us a better life. I would like to give you all this glory. Thank you very much for your dedication. Dear my sister and brother, thank you so much for encouraging me. I could overcome hard time thanks to you.
Lastly, I wish to express here, thanks to my wife, Gieun Ji for loving and management of our household activities while I completed this Ph.D.
vi
Contents
Résumé ... i Abstract ... iii Acknowledgements ... v Contents ... vi Abbreviations ... ix 1. Introduction ... 1 1.1 Cancer ... 2 1.1.1 Cancer epidemiology ... 2 1.1.2 Cancer treatment ... 31.2 Thermal therapy in cancer ... 5
1.2.1 Mechanisms of thermal therapy ... 5
1.2.2 Clinical devices ... 6
1.3 MR monitoring of thermal therapy ... 12
1.3.1 Biomarkers reliable for thermal tissue damage ... 12
1.3.2 Mechanical properties as biomarker ... 16
1.4 Research objective ... 20
1.5 Outline ... 21
2. General background ... 22
2.1 Magnetic Resonance Imaging ... 23
2.1.1 NMR signals and image reconstruction ... 23
2.2 MR Thermometry ... 25
2.2.1 Temperature dependent MR parameters ... 25
2.2.2 Proton Resonance Frequency Shift based MR Thermometry ... 27
2.3 MR Elastography ... 30
2.3.1 Introduction ... 30
vii
3. Fast multislice MR Elastography and MR Thermometry using Simultaneous Echo Refocusing
... 44
3.1 Introduction ... 45
3.2 Methods ... 47
3.2.1 Simultaneous Echo Refocusing (SER) ... 47
3.2.2 SER simultaneous MR Elastography and MR Thermometry ... 48
3.2.3 Comparison experiment in a phantom ... 49
3.2.4 HIFU-ablation experiment in a phantom ... 51
3.2.5 HIFU-ablation experiment in ex-vivo chicken tissue ... 52
3.3 Results ... 54
3.3.1 Comparison experiment in a phantom ... 54
3.3.2 HIFU-ablation experiment in a phantom ... 58
3.3.3 HIFU-ablation experiment in ex-vivo chicken tissue ... 61
3.4 Discussion... 63
4. Simultaneous fat referenced PRFS Thermometry and MR Elastography ... 65
4.1 Introduction ... 66
4.1.1 Limits of PRFS MR Thermometry ... 66
4.1.2 State of the art of temperature mapping using water/fat separation ... 66
4.1.3 Hierarchical IDEAL ... 69
4.1.4 Objective of this study ... 73
4.2 Theoratical framework ... 73
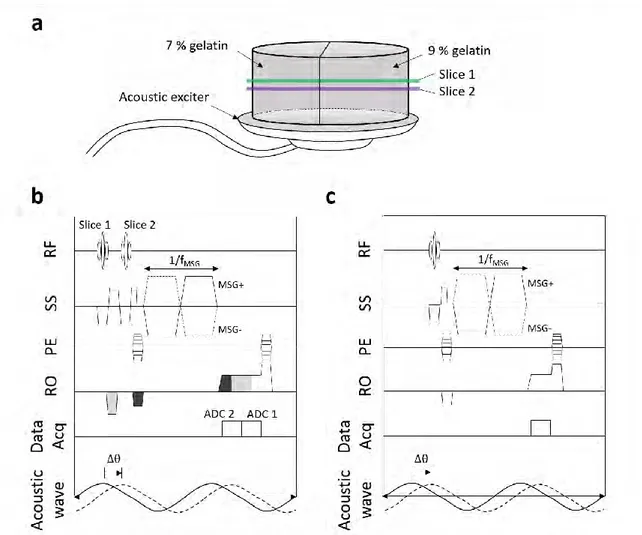
4.2.1 Pulse sequence ... 73
4.2.2 Fat-referenced PRFS Thermometry ... 76
4.2.3 MRE and water-fat separation ... 77
4.3 Methods ... 78
4.3.1 TE selection for MRE and IDEAL processing ... 78
4.3.2 Experiment 1: Temperature validation ... 81
4.3.3 Experiment 2: Comparison with single TE dataset ... 82
4.3.4 Experiment 3: Ex-vivo HIFU experiment ... 82
4.4 Results ... 84
4.4.1 Experiment 1: Temperature validation ... 84
4.4.2 Experiment 2: Comparison with single TE dataset ... 85
4.4.3 Experiment 3: Ex-vivo HIFU experiment ... 88
viii
List of Publications arising from this thesis ... 109
List of Figures ... 111
List of Tables ... 115
ix ADC Analog to Digital Converter 𝐵0 Main magnetic field
CAIPIRINHA Controlled Aliasing in Parallel Imaging Results in Higher Acceleration CEM43 Cumulative Equivalent Minutes at 43 ℃
CT Computed Tomography
EPI Echo Planar Imaging
FEM Finite Element Modeling
FRPRFS Fat Referenced Proton Resonance Frequency Shift GRAPPA GeneRalized Autocalibrating Partial Parallel Acquisition GRE Gradient Recalled Echo
HIFU High Intensity Focused Ultrasound
HT HyperThermia
IDEAL Iterative Decomposition of water and fat with Echo Asymmetry and Least squares estimation
LFE Local Frequency Estimation
LITT Laser-induced Interstitial Tumor Therapy
MRE MR Elastography
MRI Magnetic Resonance Imaging
MRT MR Thermometry
MSG Motion Sensitive Gradient MWA MicroWave Ablation
NMR Nuclear Magnetic Resonance NPV Non-Perfused Volume PNR Phase-to-Noise Ratio
PRFS Proton Resonance Frequency Shift RFA RadioFrequency Ablation
ROI Region Of Interest
RSC Relative Stiffness Changes SENSE SENSitivity Encoding
SER Simultaneous Echo Refocusing SMS Simultaneous MultiSlice SNR Signal-to-Noise Ratio
T1 Longitudinal relaxation time
T2 Spin-spin relaxation time
TD Thermal Dose
TE Echo Time
TR Repetition Time
US UltraSound
1
Chapter 1
1. Introduction
Contents
1. Introduction ...1 1.1 Cancer ...2 1.1.1 Cancer epidemiology ...2 1.1.2 Cancer treatment ...31.2 Thermal therapy in cancer ...5
1.2.1 Mechanisms of thermal therapy ...5
1.2.2 Clinical devices ...6
1.3 MR monitoring of thermal therapy...12
1.3.1 Biomarkers reliable for thermal tissue damage ...12
1.3.2 Mechanical properties as biomarker ...16
1.4 Research objective ...20
2
1.1 Cancer
1.1.1 Cancer epidemiology
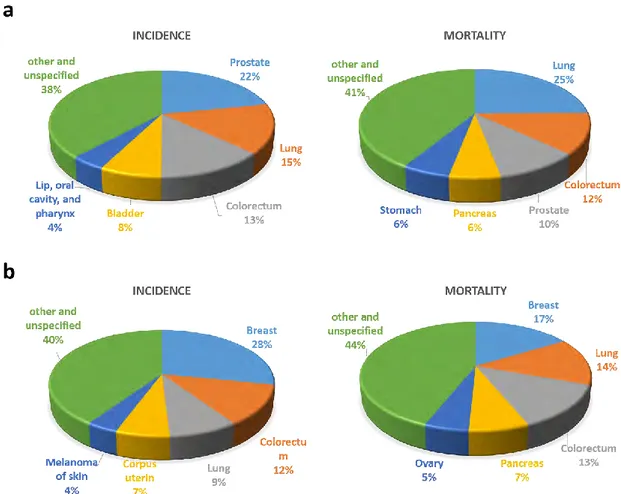
As reported by (Ferlay et al., 2018) in 2018, Europe accounts for 9 % of the total world population while representing 25 % of the global detected cancer cases. More specifically, the cancer burden in Europe is estimated to 3.9 million of new cases and 1.93 million of cancer deaths. As shown in Figure 1.1, the most common cancers in males were prostate (450,000 cases), lung (312,000 cases), and colorectal (274,000 cases) cancers. Causes of the death in males were lung (267,000 cases), colorectal (130,000 cases), and prostate (107,000 cases) cancers. The most frequently diagnosed cancer in females was breast cancer (523,000 cases), followed by colorectal (228,000 cases) and lung (158,000 cases) cancers. The causes of the death from cancer in females were breast (138,000 cases), lung (121,000 cases), and colorectal (113,000 cases) cancers.
Figure 1.1 Chart of the estimated incidence and death from cancers in males (a) and females (b) in Europe in 2018. Reproduced from (Ferlay et al., 2018).
3
1.1.2 Cancer treatment
Cancer management is continuously under progress. Various strategies for cancer treatment can be used depending on cancer type and size (Figure 1.2).
One of the most common treatments is surgical resection, which is obviously highly invasive and requires large incisions. Currently, minimally invasive interventions that require small incisions about 1 cm in diameter are also used in specific cases in order to reduce the side effects of conventional surgical resection.
Chemotherapy can be used as a primary and/or adjuvant therapy. Its goal is to treat all cancerous cells in the body (systemic therapy) and to restrain the cancer recurrence. Conventional chemotherapeutic agents are cytotoxic, i.e. they interfere with cell division via mitosis. Other systemic therapies are immunotherapy and hormonal therapy. Generally, immunotherapy helps the immune system recognize and attack cancer cells by using checkpoint inhibitors (Pardoll, 2012). Recently, immunotherapy combined with chemotherapy has shown a great potential in many cancer types (Lake and Robinson, 2005). Hormonal therapy is usually used for hormonally responsive tissues such as breast, prostate, endometrium, and adrenal cortex. Gene expression in certain cancer cells is sensitive to the levels of certain hormones. Hence, the change in the levels or activity of hormones can stop cancer growth or can even cause cell death (Decruze and Green, 2007).
Radiation therapy is used to treat localized cancer through the use of ionizing radiation that can damage the DNA of cancerous tissues leading to cell death. Radiation beams with different angles are geometrically combined to cross each other over the target in order to provide a much larger absorbed dose in cancer tissue than in the surrounding, healthy tissue (Nutting et al., 2000).
4 Figure 1.2 Diagram of common cancer treatments.
5
1.2 Thermal therapy in cancer
Thermal therapy has been increasingly used for treating localized tumors over the last decade. This approach relies on transferring thermal energy for the destruction of cancerous tissue, eradication or reduction of benign tumors and targeted tissue modification (Diederich, 2005). Many different types of ablation can be used, such as radiofrequency ablation, microwave ablation, laser ablation, cryoablation, and high intensity focused ultrasound. This chapter provides more details concerning the following aspects of thermal therapies: thermal bioeffects and heat or cold-delivery technologies.
1.2.1 Mechanisms of thermal therapy
Since its beginning, thermal therapy has been classified according to temperature range. Temperature below -20 ℃ can cause freezing injury in living cells. This approach is usually called cryoablation. On the contrary, heat-based thermal therapy is often referred to as hyperthermia (HT) or mild HT if applied in temperature ranges (39-45℃) and defined as thermal ablation if the applied temperature exceeds 45℃. Table 1.1 details typical physiological changes in soft tissues in response to temperature increases.
Cell damage can be achieved at temperature below -20 ℃, while temperatures below -40 ℃ will destroy all cells as a result of intracellular ice (Aarts et al., 2019; Baust et al., 2014). This is the basic principle of cryotherapy. Generally, cryotherapy employs a strategy including repeated freeze-thaw cycles in order to generate ice crystals in cells and/or in the extracellular space. A combination between direct rupture and destruction of the cell membrane, and cell death through dehydration resulting from osmotic effects, allows the destruction of cancerous cells.
In the range of temperature 39~45℃, living cells are affected by changes in their environment (Jain and Ward-Hartley, 1984; Tempel et al., 2016; Vaupel and Kallinowski, 1987). First, blood flow increases in response to heat (Vaupel et al., 1989). The vascular system of tumors has abnormal structure and function, which restrain tumors from meeting the requirements for oxygen level necessary to survive excessive heat (oxygenation). This temperature range can cause cell necrosis or cell death. Secondary, tumor vessels become more permeable. High temperature causes the fatty acid tails of the phospholipids to loosen and increases protein mobility within the membrane (Vígh and Maresca, 2002). The resulting increased vessel permeability results in higher chemotherapy-drug uptake in cancer cells (Lande et al., 1995; Tempel et al., 2016). Furthermore, heated tumor cells release exosomes and heat shock proteins, which makes them become more sensitive to NK cells and T cells. A recent study has proven that hyperthermia can contribute to the activation of the immune system (Toraya-Brown and Fiering, 2014).
6
Higher temperature (>45℃) causes ischemia, hypoxia, and microvascular thrombosis to tumor tissues (Brace, 2011). Protein denaturation is generated over 60℃, while temperatures over 100℃ vaporize tissue water, and carbonization occurs in tissues over 300℃.
Table 1.1 Physiological changes in response to temperature (Brace, 2011; Tempel et al., 2016).
Temperature range (℃) Physical & Biological effects
≤-40 • Intracellular ice
39 – 45
• Blood flow ↑
• Vessel permeability ↑
• Drug uptake ↑
• Activation of the immune system ↑
45-100 • Protein denaturation (>60℃)
• Coagulation, ablation
100-300 • Vaporization
>300 • Carbonization
1.2.2 Clinical devices
1) Radiofrequency ablation (RFA)
RFA was first introduced in 1891 by d’Arsonval (d’Arsonval, 1891). Currently, there are many examples of clinical RFA devices for treating tumors in liver, lung, kidney, bone, and glandular tissue, etc. (Brace, 2009; Hayashi et al., 2003; McGahan and Dodd, 2001). RFA relies on Joule heating by high RF current with frequencies ranging from 375 to 480 kHz (Clasen and Pereira, 2008).
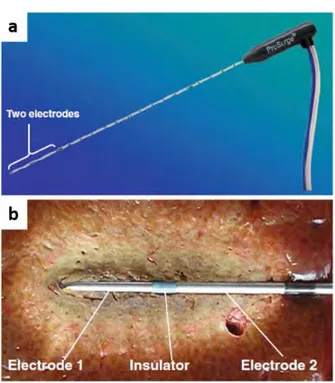
Monopolar RFA device use an insulated needle (electrode) and a grounding pad placed on the tissue. This device may induce thermal injuries caused by an electrical current flowing from the electrode to the grounding pad. To overcome the potential side effects, a bipolar RFA device uses two electrodes on a single probe which allows for limited current pathway within the treatment area (Figure 1.3) (Osaki et al., 2013).
7
Figure 1.3 An example of the bipolar RFA system. The applicator has two electrodes near its tip. Reproduced from (Osaki et al., 2013).
2) Microwave ablation (MWA)
MWA uses electromagnetic waves applied at high frequencies (915 MHz or 2.45 GHz) (Brace, 2009). The dipole moment of polar molecules, such as H2O, is rotated by aligning to the alternating
electromagnetic field. Thus, the localized EM field results in Dielectric heating inside tumors.
MWA can be a more efficient heat source than RFA in certain tissues with low or zero conductivity such as lung or bone (Lubner et al., 2010; Simon et al., 2005), because materials with low conductivity inhibit RF current flow while allowing EM wave propagations. In addition, MWA can treat larger tissue volume, typically faster than RFA, and does not require any grounding pads.
3) Laser-induced interstitial tumor therapy (LITT)
When high powered short-wavelength laser interacts with materials, the absorbed light is converted into heat. LITT relies on thermal effects of lasers, transmitted to tissue through an optical fiber. The size of active heating depends on the size of the optical fiber tip, laser wavelength, and thermal and optical properties of the tissue (Brace, 2011; Garnon et al., 2013). LITT treatment is reserved for
8
the treatment of small focal lesions (less than 9 mm in diameter), while multiple fibers can be used simultaneously to treat larger tumors (Wu et al., 2018).
LITT is easily compatible with imaging modalities, especially with MRI because of fiber materials, consisting of glass and plastic. Currently, LITT has been used in particular for the treatment of brain (Carpentier et al., 2012), prostate (Oto et al., 2013), liver (Dick et al., 2003), and bone (Hibst, 1992).
4) Cryoablation
During cryoablation, the tip of the probe reaches a temperature as low as -75 ℃, and then tissue is allowed to thaw. The freezing and thawing process is repeated several times in order to result in the formation of intracellular ice (Baust et al., 2014). The typical size of the inner core of the ice ball (reaching temperatures below -40°C) is 2 cm (Shah et al., 2016). One strong advantage of cryoablation is that multiple cryoprobes can be combined in order to treat larger tumors, the ice ball being shaped to cover the morphology of the lesion.
Imaging modalities such as CT and MRI are generally used to control cryoablations in order to evaluate the ice growth during the treatment. Figure 1.4 shows the MR-guided cryoablation system at the University hospital of Strasbourg. Low-signal area in T2-weighted images corresponds to the
9
Figure 1.4 (a) Interventional MR with cryoablation system (right) at University hospital of Strasbourg, France, (b) T2-weighted image for verification of the probes position, (c) monitoring of ice-ball during
cryotherapy (white-arrow). Reproduced from (Tsoumakidou et al., 2012).
5) High intensity focused ultrasound (HIFU)
Wood et al. first observed the biological effect of high-intensity ultrasound on ex-vivo tissues (Wood and Loomis, 1927). Fry et al. made thermal lesions within the central nervous system in several animal experiments (Fry et al., 1955). Clinical use of HIFU emerged in the 1990s thanks to progress in medical imaging that allowed better targeting and monitoring.
• HIFU transducer
A typical HIFU transducer is made of a piezoelectric array that can be concave for a natural pre-focusing as shown in Figure 1.5. Each piezoelectric element generates mechanical stress when an electric field is applied. The mechanical stress results in an ultrasound (US) wave propagating through the body. Typically, the HIFU transducer can be operated with acoustic compression pressures up to 70 MPa, peak rarefaction pressures of up to 20 MPa, and intensities of 100-10000 W/cm2 (Dubinsky et al.,
2008; Napoli et al., 2013a). In contrast, the pressure and the intensity of the diagnostic ultrasound transducer is generally used within the 0.001-0.003 MPa and 0.1-100 W/cm2 ranges, respectively.
Biological effects of ultrasound can be classified into two categories, depending on the ultrasonic waveform and the intensity range: Mechanical effects and thermal effects.
10 • Mechanical effects
Several mechanical phenomena resulting from intense ultrasonic fields have been observed (Dubinsky et al., 2008): 1) cavitation, 2) microstreaming, and 3) radiation forces. At very high pressures, ultrasonic wave rarefaction can result in the formation of an air bubble. These air bubbles obtained through cavitation will keep oscillating if the US propagation is continued. Stable cavitation occurs when such oscillations are stable and oscillate at specific modes. Unstable cavitation can be seen as an uncontrolled oscillation that can result in bubble expansion and tissue damage through implosion, yielding extremely high, localized pressure and heat. Fluid microstreaming can also occur under high amplitude acoustic oscillations. The fluid velocity due to microstreaming is associated with shear stresses that can have a biological effect. Fluid microstreaming can also occur around oscillating microbubbles. Lastly, radiation forces result from the interaction between the US wave and an absorbing medium. The radiation force can ‘push’ inside the medium, which can also have a biological effect.
• Thermal effects
High energy density can cause heat over a small volume. Such temperature increase is associated with the following parameters in the Bio-Pennes equation (Pennes, 1948):
𝜌𝐶𝑝
𝜕𝑇
𝜕𝑡 = ∇(𝑘∇𝑇) + 𝑞𝑝+ 𝑞𝑚− 𝑤𝐶𝑏(𝑇 − 𝑇𝑏) Equ. 1.1
Where 𝜌 is tissue density (≈1000 kg/m3), T is temperature (℃), 𝑇
𝑏 is the temperature of blood (℃), 𝐶𝑝
is specific heat, 𝐶𝑏 is the blood specific heat, w is the local blood perfusion rate (kg/m3/s), 𝑘 is the tissue
thermal conductivity (W/m/ ℃ ), 𝑞𝑝 is the energy deposition (W/m3), and 𝑞𝑚 is the heat due to
metabolism, which is often negligible compared to 𝑞𝑝 in cases of hyperthermia. In the case of HIFU
11
Figure 1.5 (a) photo and (b) illustration of a 256-element HIFU transducer (Image Guided Therapy, Inc., Pessac, France). A HIFU transducer consists of phased-array elements disposed so that the transducer can focus within a given spatial zone. Degassed water is used for ultrasound transmission.
• MR-guided HIFU ablation
Thermal ablations are often performed under Computed Tomography (CT), Ultrasound (US), or Magnetic Resonance Imaging (MRI) guidance. This guidance is essential for ensuring treatment safety and efficiency. MRI provides intrinsically rich soft tissue contrast compared to CT and US. It enables image acquisition in any scan orientation and employs non-ionizing radiation. Additionally, MRI can offer functional and metabolic imaging as well as quantitative assessment of temperature changes induced by thermal ablations. Owing to these advantages, MR-guided thermal therapy systems have been used in clinical practice as an alternative to conventional surgical ablation (Jolesz, 2009). In particular, MR-guided HIFU is particularly relevant, due to the fact that US HIFU technology can be made compatible with MR with relative ease, and that MR thermometry provides essential information in real time for ablation monitoring.
12
Figure 1.6 (a) MR-guided HIFU system (Image Guided Therapy, Inc., Pessac, France) at University hospital of Strasbourg, France, (b) an illustration of HIFU setup
1.3 MR monitoring of thermal therapy
MR Imaging for thermal therapy has two specific aims: 1) real-time temperature monitoring to control the energy deposition; 2) assessment of tissue damage that can provide information on treatment response.
MR Thermometry (MRT) is commonly used for temperature monitoring during thermal therapy. Several MR parameters are sensitive to temperature, such as proton density, T1 and T2 relaxation times,
diffusion coefficient, and the water proton resonance frequency shift (PRFS). In particular, PRFS-based MRT is the most commonly used method for monitoring thermal therapy because of its high sensitivity to temperature changes obtained during thermal therapies, and its high temporal resolution on the order of a few seconds (Rosenberg et al., 2013; Zhu et al., 2017). More details of the mechanisms of PRFS and other temperature-sensitive parameters will be described in Chapter 2 (page 22).
1.3.1 Biomarkers reliable for thermal tissue damage
In 1984, Sapareto and Dewey proposed the thermal dose model for damages from temperature-time history (Sapareto and Dewey, 1984). The cumulative Equivalent Minutes at 43 ℃ (CEM43) model is defined to estimate a thermal isoeffect dose through the exposure time (Sapareto and Dewey, 1984; van Rhoon et al., 2013):
13 𝐶𝐸𝑀43 = ∑ 𝑅(43−𝑇𝑖)∙ ∆𝑡 𝑖∙∆𝑡 𝑖=1 Equ. 1.2 𝑤𝑖𝑡ℎ 𝑅 = { 0.25 𝑇𝑖 < 43℃ 0.50 𝑇𝑖 ≥ 43℃
Where ∆𝑡 is the time interval, i is the measurement number, and Ti is the temperature of the ith
measurement.
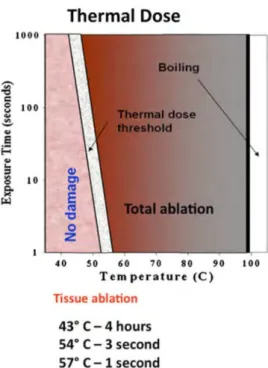
Therefore, the cumulative thermal dose (TD) represents an integration of temperature over time and has been shown to be a reliable marker of tissue damage. For example, if mild temperature ranges (~45℃) are maintained for a few minutes, it can induce protein coagulation (Figure 1.7). Recent studies have proposed improved thermal dose models including tissue characteristics such as tissue thickness, heat diffusion, and local blood perfusion rates, etc. (MacLellan et al., 2018; Napoli et al., 2013b). However, fundamental limitations when using TD alone for monitoring thermal ablations over time need to be mentioned, such as the fact that TD thresholds are still tissue-dependent (van Rhoon et al., 2013), and that TD is particularly sensitive to any uncertainty or bias due to its cumulative property (Vappou et al., 2018). TD has also been shown to be poorly correlated to non-perfused volume (NPV), a reliable marker of post-ablation tissue damage, showing potential errors of MR Thermometry due to long-term heat accrual (Bitton et al., 2016). In addition, PRFS thermometry in fat-containing tissues may result in significant temperature errors depending on echo time, fat fraction, and extent of temperature increase because the temperature dependent electron-screening constant in fat is negligible compared to the one of water protons (Rieke and Pauly, 2008a; Taylor et al., 2011).
14
Figure 1.7 Thermal dose depending on temperature and exposure time. Reproduced from (Napoli et al., 2013b).
MRI can provide additional biomarkers for tissue damage complementary to temperature. Table 1.2 shows several biomarkers that relate to thermal tissue damage. The measurement of T1 or T2
relaxation times can provide accurate temperature information in fat containing tissues and reflect the degree of tissue damage (Baron et al., 2014; Todd et al., 2014). Magnetization transfer ratio has also been shown to describe thermal damage through its analysis of protein levels (Peng et al., 2009). As reported by (Kwon et al., 2014), MR Electrical impedance tomography can be used for measuring the change in electrical conductivity of the ablated tissue.
15 Table 1.2 Biomarkers for thermal tissue damage.
Reference Biomarkers strength Field
[T]
Tissue type Application Temperature↑ vs.
(Todd et al., 2014) T1 (for fat), PRFS
(for water) 3.0 Ex-vivo porcine muscle HIFU T1↑
(Baron et al., 2014) T2 (for fat) 1.5 In-vivo porcine
liver HIFU T2↑
(Peng et al., 2009) Magnetic transfer ratio, PRFS 3.0 Ex-vivo porcine muscle HIFU Magnetic transfer ratio↑
(Kwon et al., 2014) conductivity Electrical 3.0 Ex-vivo bovine RFA 𝜎 ↑
(Kruse et al., 2000) Elasticity 1.5 Ex-vivo bovine skeletal muscle Themally regulated
holder Shear modulus↓
(Wu et al., 2001) Elasticity 1.5 Ex-vivo bovine HIFU (Shear modulus ↑ Shear modulus ↓
over 60℃)
(Chen et al., 2014) Elasticity 1.5 In-vivo porcine liver Laser Shear modulus ↑
(Corbin et al.,
16
1.3.2 Mechanical properties as biomarker
Thermal tissue damage can induce changes in the mechanical properties of tissues, for example, through tumor necrosis or protein coagulation. In 1998, Stafford et al. first investigated the use of US elastography to distinguish the extent of thermal damage in several lesions (Figure 1.8) (Stafford et al., 1998). Mariani et al. investigated thermal lesions in pig liver using US shear wave elastography (Mariani et al., 2014). RFA was performed for thermal ablation and the thermal lesion was visualized under combined shear wave elastography with B-mode imaging (Figure 1.9).
Figure 1.8 Young’s modulus as a function of the strain of laser ablation applied in ovine kidney. Position 1 (pos 1) is in the center of the lesion. Position 2 is in an intermediate position in the lesion. Position 3 (pos 3) is in the border of the lesion. Position 4 (pos 4) is in the normal tissue. Reproduced from (Stafford et al., 1998).
17
Figure 1.9 Shear waves elastography (top) and B-mode image (bottom). The ablated lesion has higher Young’s modulus than the surrounding normal tissues. Reproduced from (Mariani et al., 2014).
In the field of MRI, MR Elastography (MRE) offers the possibility to measure the mechanical properties of soft tissues non-invasively. Such measurements are quantitative as they rely on the estimation of the velocity of shear waves propagating within the tissue. Wu et al. established a relationship between temperature and elasticity changes measured with MRE in ex-vivo bovine muscle tissue (Wu et al., 2001). They observed that the shear modulus of ex-vivo bovine tissues decreased in the temperature range from 20 ℃ to around 60 ℃, which can be explained by protein unfolding during heating. Over 60 ℃, protein structural changes started to become irreversible. Thus, the shear modulus increased and did not go back to its original value during cooling down (Figure 1.10).
18
Figure 1.10 Shear modulus of ex-vivo bovine tissue measured with MRE at various temperature. The arrow indicates increasing experimental time. This graph illustrates tissue shear modulus changes during the heating and cooling process. Reproduced from (Wu et al., 2001).
More recently, Chen et al.(Chen et al., 2014) have demonstrated the feasibility of monitoring changes in elasticity of porcine liver in-vivo as a result of laser ablations. Liver elasticity was found to increase significantly after ablations.
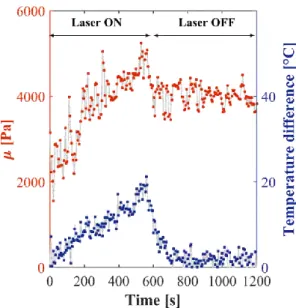
Corbin et al.(Corbin et al., 2016a, 2016b) proposed an interventional MRE protocol and method that allows for simultaneous PRFS temperature and elasticity monitoring within a few seconds (Figure 1.11). This interventional MRE system was developed in our laboratory. It includes a needle MRE driver, a respiratory triggered gradient-echo sequence with motion encoding and an online reconstruction method that provides elasticity and temperature measurements in real-time. Changes in elasticity and temperature occurring during laser thermal ablation are successfully measured in-vivo over 20 minutes thanks to this interventional MRE system (Corbin et al., 2016a).
Hofstetter et al. (Hofstetter et al., 2019) proposed a new MR-shear wave elastography approach that can measure elasticity within an in-plane area of ~5 × 5 cm, using multiple acoustic radiation force pushes. Ex-vivo HIFU experiment in bovine liver was performed and MR-shear wave elastography showed the evolution of shear wave speed in the ablated zone (Figure 1.12). This technique allows for monitoring changes in shear wave speed due to HIFU ablation.
19
Figure 1.11 Evolution of the shear modulus (red) and the temperature during a laser ablation in swine liver in-vivo.
Figure 1.12 Ex-vivo HIFU experiment. Shear wave speed maps measured before (A) and after (B) ablation. Temperature map (C) and corresponding thermal dose (D). The thermal dose threshold of 240 CEM43 is overlaid as a black line in (B). Reproduced from (Hofstetter et al., 2019).
20
1.4 Research objective
As previously mentioned, tissue elasticity has received increasing attention as a biomarker for assessing therapy response during thermal ablation. Recent studies have demonstrated the possibility of using both MR Elastography and MR Thermometry simultaneously in order to monitor tissue damage. This Ph.D. thesis applies a set of different developments dedicated to interventional MRE/MRT for the monitoring of hyperthermia. The first part of this thesis is dedicated to the development of a fast multislice MRE sequence for improved spatial coverage during thermal therapy. Full spatial coverage of the ablation area is desirable compared to 2D imaging for two reasons. First, the 2D images may not be properly centered on the ablation area. Second, the geometry of the ablation area is shaped by local tissue configuration (blood flow, spatially varying heat deposition, tissue physiology, etc.), that only 3D coverage can provide. The first project aims to propose the use of simultaneous echo refocusing (SER) (Feinberg et al., 2002) for the acquisition of 2 slices sharing a single MRE gradient encoding in a single TR, and to demonstrate its use for multislice monitoring of temperature and elasticity changes during thermal ablations.
The second part presents a new acquisition strategy for simultaneous fat referenced PRFS thermometry and MRE, in order to monitor thermal ablations for all types of soft tissues, including fatty tissues. On one side, fat referenced PRFS thermometry makes it possible to measure temperature while enabling field-drift correction (Hofstetter et al., 2012). On the other side, MRE enables measuring the mechanical properties of the tissue that are related to tissue structural damage during ablations. The proposed strategy offers a refinement of the combined MRT/MRE real-time monitoring of thermal ablations, extending its accuracy in soft tissues including fat containing tissues, while keeping the acquisition time similar.
21
1.5 Outline
This PhD dissertation is organized as follows:
Chapter 2 introduces the basic principles of PRFS-based MR Thermometry and MR Elastography, including a historical review. The purpose of this chapter is to provide a theoretical background for the understanding of chapters 3 and 4.
Chapter 3 describes the use of simultaneous echo refocusing (SER) for accelerating the multislice MRE acquisition. The proposed method is demonstrated in three experiments: First, a phantom experiment is prepared to compare with regular MRE sequences. A second experiment is conducted to validate the use of the SER method for monitoring temperature and elasticity changes during HIFU ablation. Third, a HIFU experiment in chicken muscle tissue is carried out to monitor the volumetric change of tissue temperature and elasticity during HIFU ablation.
Chapter 4 provides a new framework for simultaneous fat referenced PRFS Thermometry and MRE. Accurate temperature measurement is validated in a phantom experiment by using fiber optic thermal sensors. In addition, elasticity maps are compared to those reconstructed with regular MRE-GRE sequence. Then, HIFU experiments in pig rib muscle tissue with homogenous fat fractions are conducted to evaluate the feasibility to extend into clinical practice.
Chapter 5 provides a general discussion about this Ph.D. thesis and the field of interventional MRE.
22
Chapter 2
2. General background
Contents
2. General background ...22
2.1 Magnetic Resonance Imaging ...23
2.1.1 NMR signals and image reconstruction...23
2.2 MR Thermometry ...25
2.2.1 Temperature dependent MR parameters...25
2.2.2 Proton Resonance Frequency Shift based MR Thermometry ...27
2.3 MR Elastography ...30
2.3.1 Introduction ...30
2.3.2 Principle of MRE ...31
2.4 Simultaneous MR Thermometry and MR Elastography ...38
2.5 Interventional MRE/MRT in the ICube laboratory ...39
23
2.1 Magnetic Resonance Imaging
This summarizes some of the basic principles of magnetic resonance imaging (MRI) that are required to understand the following chapters. Additional mathematical details will be found in (Bernstein et al., 2004).
2.1.1 NMR signals and image reconstruction
For the sake of simplicity, let us consider a 2D image acquired in the x-y plane. The microscopic magnetization of each hydrogen nucleus processes at the Larmor angular frequency 𝜔 around the axis of the main magnetic field 𝐵0 as follows:
𝜔 = 𝛾𝐵0 Equ. 2.1
Where the gyromagnetic ratio of the hydrogen nuclei 𝛾 is 267.522 × 10⁶ rad/s/T. At thermal equilibrium,
the macroscopic magnetization of a spin system within a static magnetic field is aligned with the axis of this static magnetic field. When a radio-frequency excitation pulse oscillating at the Larmor frequency is applied, the direction of the macroscopic magnetization is tilted way from the main magnetic field, towards the transverse plane perpendicular to the main magnetic field axis. In the transverse plane, the magnetization 𝑀⊥ is detected in receive coils as a complex signal oscillating with the precession of spins
at the Larmor frequency.
MRI exploits three gradients in orthogonal directions in order to encode spatial information in the NMR signal: a slice selection gradient, a frequency encoding gradient, and a phase encoding gradient. First, the slice selection gradient induces a linear spatial variation of the Larmor frequency (in this example applied along the z-direction) so that a radio-frequency pulse centered at its central frequency can tip the magnetization away from the main magnetic field direction in a given slice. Second, the phase encoding gradient (in this example applied along the y-direction) provides each row of pixels in the image with a given phase. Third, the frequency encoding gradient (in this example applied along the
x-direction) relates the precession frequency of the spin to its position along each line of pixels, during
signal acquisition.
This signal is recorded in the dataset, called ‘k-space’ (Figure 2.1). An MR sequence is performed for each phase encoding step and is repeated in order to fill all rows in the k-space. The NMR signal measured in the receive coil contains the sum of all spins having different frequencies. Therefore, the k-space data can be written as:
24
𝑆(𝑘𝑥, 𝑘𝑦) = ∫ ∫ 𝑀⊥(𝑥, 𝑦)𝑒−𝑖2𝜋∙𝑥∙𝑘𝑥𝑒−𝑖2𝜋∙𝑦∙𝑘𝑦𝑑𝑥𝑑𝑦 Equ. 2.2
Where 𝑆(𝑘𝑥, 𝑘𝑦) can represent a full k-space dataset in the spatial frequency domain, x and y are the
spatial coordinates along the 𝑂𝑥 and 𝑂𝑦 axes respectively, 𝐺𝑥 is a frequency encoding gradient, 𝑘𝑥 is
equal to (𝛾/2𝜋) ∫ 𝐺𝑥(𝑡)𝑑𝑡 𝑇𝑥
0 , 𝐺𝑦(𝑡) is a phase encoding gradient, and 𝑘𝑦 is equal to (𝛾/
2𝜋) ∫ 𝐺𝑦(𝑡)𝑑𝑡 𝑇𝑦
0 where 𝑇𝑥 is the duration of the prephasing gradient and 𝑇𝑦 is the duration of the 𝐺𝑦
lobe.
The transverse magnetization 𝑀⊥(𝑥, 𝑦) can be reconstructed by the inverse Fourier transform
of 𝑆(𝑘𝑥, 𝑘𝑦). From this complex image, magnitude and phase images can be derived as shown in Figure
2.1. The magnitude image indicates the intensity of the NMR signal and the phase image includes a frequency information of the NMR signal.
Figure 2.1 An example of k-space (magnitude) and corresponding magnitude and phase images, that can be reconstructed by the inverse Fourier transform of the complex k-space data.
25
2.2 MR Thermometry
2.2.1 Temperature dependent MR parameters
1) Proton density
The proton density can be derived from the Boltzmann distribution (Abragam, 1961) at thermal equilibrium. Therefore, the temperature can be estimated by the proton density as follows:
𝑝𝑟𝑜𝑡𝑜𝑛 𝑑𝑒𝑛𝑠𝑖𝑡𝑦 ∝ 𝜒0𝐵0 Equ. 2.3
𝜒0∝ 1/𝑇
Where the susceptibility 𝜒0 is inversely proportional to the temperature 𝑇. The relative change in
temperature is calculated by the change in proton density, but the temperature sensitivity is about -0.3 %/℃, requiring high Signal-to-Noise Ratio (SNR) (Rieke and Pauly, 2008b). In addition, the change in the proton density depends on the change in the susceptibility related to thermal damage, not temperature alone. Therefore, it is not clinically used to measure temperature during thermal therapy.
2) T1 relaxation time
As reported in (Kahn and Busse, 2012), the temperature-dependence of the longitudinal relaxation time T1 was first modeled by:
𝑇1 ∝ 𝑒−𝐸𝑎(𝑇1)/𝑘𝑇 Equ. 2.4
Where 𝐸𝑎(𝑇1) is the activation energy of the relaxation time and 𝑘 is the Boltzmann constant. 𝑇1
increases with an increase in temperature. Recently, the hybrid T1- and PRFS- based MR Thermometry
was developed for monitoring temperature in fatty and aqueous tissues, simultaneously (Todd et al., 2014). Its temporal resolution is 3.8 s, which might be sufficient for the monitoring of clinical thermal therapy. The temperature dependence of T1 was found to be 8 ms/℃ in the adipose breast tissue.
However, additional T1 variations occur when irreversible changes are induced in tissue structure. Hence
the tissue temperature dependence of T1 does no longer follow a linear relationship when irreversible
26
3) T2 relaxation time
The transverse relaxation time T2 is not receiving much interest in the field of MR Thermometry
because of its nonlinear relationship with temperature in aqueous tissues. Recently, several studies proposed to use T2 for measuring the temperature in adipose tissues and bone marrow (Baron et al., 2014;
Ozhinsky et al., 2016). Their findings are that T2 in fat is linearly proportional to temperature. Its
temperature sensitivity is about 5-7 ms/℃.
4) 𝑅2∗ relaxation rate
The transverse relaxation rate 𝑅2∗ is defined as the inverse of 𝑇2∗.
𝑅2∗= 1 𝑇2∗= 1 𝑇2 + 𝛾∆𝐵0 Equ. 2.5
Where ∆𝐵0 is the field inhomogeneity and 𝛾 is the gyromagnetic ratio.
𝑅2∗ can be usually estimated using a multi-echo dataset. (Lorenzato et al., 2014) reported that
the multi-echo gradient echo sequence can be used for temperature monitoring with 𝑅2∗ change. In
addition, PRFS temperature can be estimated from the multi-echo dataset. As shown in Equ. 2.5, 𝑅2∗
reflects the change in the field inhomogeneity, which can be affected by the change in susceptibility induced by temperature change. Therefore, it is possible to estimate temperature change through 𝑅2∗
change. The temperature sensitivity was found to be about 0.35 s-1/℃ in porcine muscle (Lorenzato et
al., 2014).
5) Diffusion
Diffusion imaging allows for measuring the Brownian-motion of the water molecules. The relationship between diffusion and temperature was summarized by (Le Bihan et al., 1989) as follows:
𝐷 ∝ 𝑒−𝐸𝑎(𝐷)/𝑘𝑇 Equ. 2.6
Where D is diffusion coefficient, 𝐸𝑎(𝐷) is the activation energy of the diffusion of water molecules,
27
is about 2%/℃, which is acceptable in clinical practice. However, the relationship between temperature change and diffusion change is highly dependent on tissue characteristic and condition (Bleier et al., 1991).
2.2.2 Proton Resonance Frequency Shift based MR Thermometry
Proton Resonance Frequency shift (PRFS) -based MR Thermometry is the most commonly used method for monitoring thermal ablations thanks to its high sensitivity to temperature (≈ −0.01 𝑝𝑝𝑚/℃) within the temperature range encountered during hyperthermia. The sensitivity of PRFS to temperature was first established by (Hindman, 1966). In 1995, Ishihara et al. proposed PRFS-based MR Thermometry in a gradient echo sequence (Ishihara et al., 1995). The resonance frequency in a molecule in the main magnetic field 𝐵0 is given by the Larmor frequency (Equ. 2.1). However, hydrogen bonds
in water molecules come loose as temperature increases, leading to increased electron screening of 1H
nucleus, and therefore to lower proton resonance frequency (Ishihara et al., 1995). This phenomenon is called the water proton resonance chemical shift (PRFS) with temperature. The local magnetic field can be expressed as:
𝐵𝑙𝑜𝑐 = (1 + 𝑠)𝐵0 Equ. 2.7
Where 𝑠 is the electron-screening constant or shielding constant of the water proton. Hence, Equ. 2.1 becomes:
𝜔 = 𝛾(1 + 𝑠)𝐵0 Equ. 2.8
The temperature dependent electron-screening constant of the water proton is expressed as:
𝑠(𝑇) = 𝛼𝑇 Equ. 2.9
Where 𝛼 is the PRFS coefficient of the water proton about -0.0103 ± 0.0002 ppm/℃ (Hindman, 1966). As shown in Figure 2.2, it is possible to estimate relative temperature changes by monitoring local resonance frequency variations in hydroxide.
28
Figure 2.2 Temperature dependent PRFS in -OH and -CH2. The temperature increase is related to PRFS
in hydroxide, but not to PRFS in methylene. Reproduced from (Taylor et al., 2011).
In gradient echo sequences, relative phase shifts are proportional to temperature, and hence can be converted to temperature changes as follows:
∆𝑇 =𝜙(𝑇) − 𝜙(𝑇0)
𝛾𝛼𝐵0𝑇𝐸 Equ. 2.10
Where ∆𝑇 is the temperature difference relative to the reference image, 𝜙(𝑇) is the current phase image, 𝜙(𝑇0) is the reference phase image, γ is the gyromagnetic ratio, α is the temperature sensitive
coefficient, 𝐵0 is the main magnetic field, 𝑇𝐸 is the echo time. The reference phase image (before
heating) is subtracted to the current phase image (during heating). Finally, the temperature calculated from Equ. 2.10 is accumulated in order to estimate tissue damage via the CEM43 model as described in chapter 1.3 (Figure 2.3).
29
Figure 2.3 Temperature (top row) and thermal dose (bottom row) images of the liver during HIFU ablation. The region exceeding the 240CEM43 is shown in red in the thermal dose image. MR images are obtained by a single-shot gradient-recalled echo planar imaging (EPI) sequence with multislice acquisition. Reproduced from (Quesson et al., 2011).
30
2.3 MR Elastography
2.3.1 Introduction
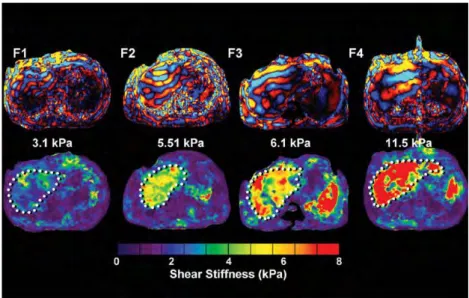
MRE is already being used clinically for the assessment of liver fibrosis. The extent of liver fibrosis can be assessed by measuring the mechanical properties of the liver (Taouli et al., 2009). As shown in Figure 2.4, stiffness increases together with the degree of fibrosis.
Figure 2.4 Stiffness increase in the liver corresponds to increasing fibrosis level (F1 to F4). The wavelength increases along with fibrosis level. Reproduced from (Venkatesh Sudhakar K. et al., 2013).
Additionally, MRE can detect many pathological changes due to cancer. For example, breast and liver cancers are stiffer than healthy tissues (Figure 2.5) (Pepin et al., 2015). The stiffness of lesions may be increased due to abnormal vasculature and high interstitial fluid pressure. In the brain, the stiffness of meningioma appears to be softer than the surrounding brain tissue (Murphy et al., 2013). As reported by (Murphy et al., 2011), Alzheimer disease results in significantly softer stiffness than healthy brain tissue. Also, MRE has shown potential to evaluate other diseases, such as renal parenchymal disease (Rouvière et al., 2011), lung parenchyma disease (Mariappan et al., 2011), cardiac amyloidosis (Arani et al., 2017), etc.
31
Figure 2.5 Evaluation of breast cancer in human, obtained by MRE. Stiffness of the cancerous tissue is significantly higher than that of healthy glandular tissue. White dashed line points out the cancer lesion. Reproduced from (Pepin et al., 2015).
2.3.2 Principle of MRE
Measuring tissue elasticity using MRE requires three main elements listed as follows:
1) Applying displacements
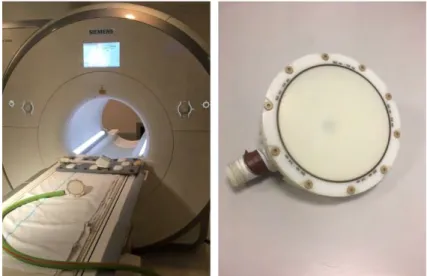
The first step is the generation of shear waves within the region of interest using an internal or external acoustic exciter. The most common MRE mechanical excitation source consists in using an external pneumatic driver. As shown in Figure 2.6, the acoustic source is an active driver that is placed outside of the MRI scanner, and the acoustic wave is transmitted to an MR-safe passive driver, placed in contact with the body. A flexible membrane on the surface of the passive driver transmits the vibration to the body, resulting in the propagation of shear waves (Venkatesh Sudhakar K. et al., 2013).
Other technologies for excitation have been used, such as electromechanical or piezoelectric actuators (Sack et al., 2008; Uffmann et al., 2002; Vappou et al., 2007). Generating waves directly within the organ of interest has also been proposed, through the use of percutaneous instruments transmitting the vibration induced by a piezoelectric actuator (Corbin et al., 2016b; Yin et al., 2007). As reported by (Corbin et al., 2016b), an MR-compatible piezoelectric stack driver is used to make the tip of a needle vibration in the longitudinal direction and directly creates the acoustic wave to propagate away from the needle shaft in the transverse direction. Alternatively, the displacement can be also induced by acoustic radiation force from HIFU excitation (Hofstetter et al., 2019; Souchon et al., 2008; Wu et al., 2000).
32
Figure 2.6 Illustration of a pneumatic MRE driver system. Reproduced from (Venkatesh Sudhakar K. et al., 2013).
2) Measuring displacements
The harmonic oscillation 𝜉⃗(𝑡) induced by the propagating shear wave can be described as:
𝜉⃗(𝑡) = 𝜉⃗⃗⃗⃗ ∙ 𝑠𝑖𝑛(2𝜋𝑓 ∙ 𝑡 − 𝑘⃗⃗ ∙ 𝑟⃗) 0 Equ. 2.11
Where 𝜉⃗⃗⃗⃗0 is the motion amplitude, 𝑓 is the frequency of the applied harmonic wave, 𝑘⃗⃗ is the
wave number and 𝑟⃗ is the position vector.
The second step of MRE consists in encoding the shear wave using MRI. If Equ. 2.1 is expressed as a function of time, then the resonance frequency can be written as:
𝑑𝜙
𝑑𝑡 = 𝛾𝐵(𝑡) Equ. 2.12
Let us assume that an additional bipolar gradient 𝐺⃗ is applied while the tissue undergoes a harmonic wave motion. The bipolar gradient 𝐺⃗ consists of two trapezoidal lobes (each with the same gradient area, and with opposite polarity). As shown in Figure 2.7, the first lobe of the gradient 𝐺⃗ and the mechanical wave results in phase shifts and the second lobe of the gradient 𝐺⃗ and the mechanical wave accumulates the same phase shifts because both the polarity of the gradient and the displacement
33
are inverted together. The MRE encoding gradient 𝐺⃗ is usually called the motion sensitive gradient (MSG) and is applied in a specific direction in which it encodes the spatial component of the shear wave. Therefore, the local magnetic field 𝐵(𝑡) in the presence of the bipolar gradient 𝐺⃗ and harmonic shear wave 𝜉⃗(𝑡) becomes:
𝐵(𝑡) = 𝐵0+ 𝐺⃗(𝑡) ∙ (𝑟⃗⃗⃗⃗ + 𝜉⃗(𝑡)) 0 Equ. 2.13
Where 𝑟⃗⃗⃗⃗ is the initial position vector of tissue at time 𝑡 = 0. 0
Figure 2.7 Chronogram of the MSG and the mechanical wave. t1 is the period of the MSG and the
mechanical shear wave. Equ. 2.11 becomes:
𝑑𝜙
𝑑𝑡 = 𝛾[𝐵0+ 𝐺⃗(𝑡) ∙ (𝑟⃗⃗⃗⃗ + 𝜉⃗(𝑡))] 0 Equ. 2.14
Hence, the phase of the MR image contains information about the tissue motion as follows:
𝜙 = 𝛾 ∫[𝐵0+ 𝐺⃗(𝑡) ∙ (𝑟⃗⃗⃗⃗ + 𝜉⃗(𝑡))]𝑑𝑡0 𝑡
0
Equ. 2.15
34
𝜙 = 𝜙0+ 𝜙𝑚 Equ. 2.16
Where 𝜙0 stands for the background phase and 𝜙𝑚 reflects the phase accumulation resulting
from the shear wave encoding. Two strategies can be adopted in order to remove the static background phase reflecting B0 field inhomogeneities. A background phase image (𝜙0) can be acquired prior to the
shear wave propagation so that it can be subtracted to the following phase images acquired during shear wave propagation, under the assumption that the background phase remains constant during the acquisition.
The most commonly adopted strategy consists in acquiring two-phase images with opposed MSG polarities, so that Equ. 2.16 translates into:
{ 𝜙𝜙+= 𝜙0+ 𝜙𝑚
−= 𝜙0− 𝜙𝑚 Equ. 2.17
Where 𝜙+ and 𝜙− are phase values acquired from MSG+/−, respectively. Subtracting the phase
images one to another results in the suppression of the static background phase 𝜙0, while the
motion-induced phase shift 𝜙𝑚 is doubled (Equ. 2.18):
𝜙𝑚= (𝜙+− 𝜙−)/2 Equ. 2.18
Although that approach doubles the acquisition time compared to a unique reference scan, the strong gain obtained in terms of Phase-to-Noise Ratio (PNR) makes it the current state-of-the-art for diagnostic MRE.
Phase encoding can be seen as a convolution between an MSG and a mechanical wave, which means that frequencies other than the main excitation frequency can also be encoded. In order to extract the fundamental frequency of the motion, the wave propagation is captured at different time points by varying the time offset between the MSG and the mechanical wave. Theses phase difference images (𝜙𝑚1, 𝜙𝑚2, 𝜙𝑚3, … ) are processed by applying a temporal Fourier transform in order to isolate the
motion at the fundamental frequency. The phase offsets are typically evenly spaced across a mechanical period. Estimating the mechanical properties (Next section) is performed on the resulting filtered wave image.
35
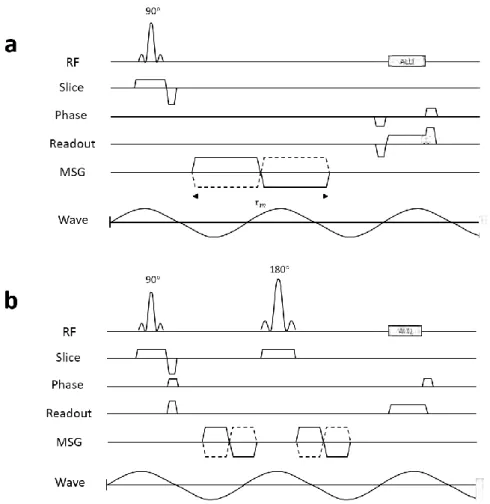
Figure 2.8 shows the chronograms of typical gradient echo- and spin echo-MRE sequences including the MSG.
Figure 2.8 Chronograms of typical gradient echo MRE sequence (a) and spin echo MRE sequence (b). In general, those sequences are implemented with interleaved acquisitions varying the polarity of MSG (solid line: MSG+, dashed line: MSG-). 𝜏𝑚 is the period of the MSG, here different from the period of
the mechanical shear wave.
3) Estimating the mechanical properties
For estimating the mechanical properties, several inversion algorithms have been used to transform the wave images into elasticity maps. Before applying any algorithm on MRE data set, the biomechanical behavior of the tissue must be correctly modeled. Several assumptions can be made about tissue biomechanical behavior, such as simple linear elasticity, viscoelasticity (Sack et al., 2008; Sinkus et al., 2005; Vappou et al., 2007), anisotropy (Chatelin et al., 2016) or poroelasticity (McGarry et al., 2015). In this work, we will assume pure linear elasticity, which is a common assumption in clinical practice. It results in the following expression between the shear modulus and shear wave velocity:
36
𝜇 = 𝜌𝑐2 = 𝜌(𝜆𝑓)2
Equ. 2.19 Where 𝜌 is the density of soft tissues, 𝑐 is the shear wave speed, and 𝑓 and 𝜆 are the mechanical frequency and the wavelengh in tissue, respectively.
One of the methods for estimating the shear modulus is to evaluate the wavelength 𝜆 from the wave images. Manduca et al. proposed a way to estimate the local frequency using the combination of several lognormal filters, namely local frequency estimation (LFE) algorithm (Manduca et al., 1996). This approach can produce a robust estimate of the shear modulus in the presence of noise and heterogeneous geometry.
Another way to estimate the shear modulus is solving the differential equation of motion, namely, a direct inversion (Oliphant et al., 2001). Since the computation is performed on the basis of the equations of motion in a small region, its spatial resolution is better than the LFE algorithm and it is possible to measure the viscoelastic properties of tissue (Sack et al., 2008; Sinkus et al., 2005). However, a direct inversion approach is typically sensitive to noise, while the LFE algorithm is relatively robust to noise. An alternative method is based on an optimization process between computed and experimental displacement fields (Van Houten et al., 1999). However, this method requires particularly long computational time.
In this Ph.D. thesis, the LFE algorithm was used because of its robust and fast estimate of the shear modulus. We will focus mainly on this inversion method for the following sections.
Figure 2.9 shows a summary of the MRE process, illustrated in a gelatin phantom made of two halves with different stiffness. In summary, the MR phase image represents the shear wave displacement field, encoded by the bipolar gradients (MSG) as formalized in Equ. 2.15. A 2D phase unwrapping algorithm (Goldstein et al., 1988) is applied to the phase images. The two-phase images with opposite MSG polarities are subtracted from one another. It allows for the suppression of the static background phase and increasing motion sensitivity by a factor of 2. In addition, several phase offsets between the MSG and the wave propagation are used in order to extract the motion at the fundamental excitation frequency thanks to a temporal Fourier transform. Note that the difference in wavelength between both halves of the phantom in Figure 2.9 is visible in the real part of the Fourier transformed wave image: the shorter wavelength on the left corresponds to the softer half. Lastly, the LFE algorithm is applied to the filtered wave image, providing the local spatial frequency of the shear wave in the image domain. This wavelength is used in Equ. 2.19 for the shear modulus estimation.
37
Figure 2.9 Flow chart of the MRE processing. 𝜙𝑖 (i=1,2,3,4) is the phase offset. In step 2, phase
difference images correspond to the subtraction of a pair of phase images acquired with opposite MSG polarities. In step 3, because temporal Fourier transform generates complex wave values, real parts of the result are shown in this figure. In step 4, the local frequency of the shear wave obtained in step 3 is used in Equ. 2.19 to evaluate the shear modulus.