Climate Models Lack Jet–Rainfall Coupling over West Africa
The MIT Faculty has made this article openly available.
Please share
how this access benefits you. Your story matters.
Citation
Whittleston, D. et al. “Climate Models Lack Jet–Rainfall Coupling
over West Africa.” Journal of Climate 30, 12 (June 2017): 4625–4632
© 2017 American Meteorological Society
As Published
http://dx.doi.org/10.1175/JCLI-D-16-0579.1
Publisher
American Meteorological Society
Version
Final published version
Citable link
http://hdl.handle.net/1721.1/114588
Terms of Use
Article is made available in accordance with the publisher's
policy and may be subject to US copyright law. Please refer to the
publisher's site for terms of use.
A. SCHLOSSER
Joint Program on the Science and Policy of Global Change, Massachusetts Institute of Technology, Cambridge, Massachusetts
D. ENTEKHABI
Department of Civil and Environmental Engineering, Massachusetts Institute of Technology, Cambridge, Massachusetts
(Manuscript received 5 August 2016, in final form 1 March 2017)
ABSTRACT
Changes in large-scale dynamics over West Africa—the strength and position of zonal jets—are a key interim step by which local and remote forcing is communicated into changes in rainfall. This study identifies a key mode of jet variability and demonstrates how it is strongly coupled with rainfall. The approach provides a quantitative framework to assess jet–rainfall coupling and a useful tool to investigate the concerning spread in CMIP5 rainfall projections over the West African Sahel. It is shown that many CMIP5 simulations fail to capture this coupling, indicating a fundamental limitation in their ability to predict future rainfall conditions. The results demonstrate that West African rainfall in the coming CMIP6 ensemble should be interpreted with caution; key atmospheric processes that deliver rainfall must be validated before conducting detailed analysis on rainfall.
1. Introduction
The onset of severe drought in the Sahel during the late 1960s sparked a push to understand the mechanisms driving rainfall variability in the region. Sea surface temperature (SSTs) (Park et al. 2015), aerosols (Booth et al. 2012), and greenhouse gases (Dong and Sutton 2015) have all been implicated as the primary drivers of historical rainfall variability and uncertainty in future climate projections. Despite considerable progress in understanding the processes that control historical rainfall variability [see review by Nicholson (2013)], realistically simulating these in models remains a chal-lenge. Relative to CMIP3, CMIP5 models show a
better consensus in predicting a wetter future but little improvement in representing many of the phenomena that force Sahel rainfall (Cook 2008;Roehrig et al. 2013). It is well established that remote forcing plays a key role in controlling historical rainfall variability over the Sahel. Early work focused on sea surface temperatures in the Atlantic and Indian Oceans and the Mediterranean Sea (Rodíguez-Fonseca et al. 2015). It was initially thought that SST variability was internal, as opposed to a response to anthropogenic forcing. However, a number of recent studies argue aerosols and greenhouse gases are the primary drivers of historical SST variability and therefore Sahel rainfall (Booth et al. 2012;Haywood et al. 2013;Ackerley et al. 2011;Biasutti and Giannini 2006). It is likely these different factors interact and combine to force rainfall, the details of which remain a significant open research question (Rodíguez-Fonseca et al. 2015).
A large number of studies have investigated the causal relationships between remote forcing and rainfall, either through statistical methods or climate model perturbation
Supplemental information related to this paper is avail-able at the Journals Online website:http://dx.doi.org/10.1175/ JCLI-D-16-0579.s1.
Corresponding author e-mail: David Whittleston, dwhittle@mit.edu
DOI: 10.1175/JCLI-D-16-0579.1
Ó 2017 American Meteorological Society. For information regarding reuse of this content and general copyright information, consult theAMS Copyright Policy(www.ametsoc.org/PUBSReuseLicenses).
analysis (e.g., Park et al. 2015; Haywood et al. 2013). Others have conducted detailed analysis on the rainfall outputs from CMIP5 models forced by a range of emission scenarios (e.g.,Biasutti 2013). However, much of this work focuses on the end members of a complex teleconnection chain with little emphasis on the poorly understood link-ages delivering rainfall to the Sahel. In this study we show that the majority of climate models fail to reproduce fundamental coupling between the large-scale dynamics over West Africa and Sahel rainfall.Section 2describes the data and methods used in our analysis. Section 3
outlines our framework to quantify coupling between Sahel rainfall and atmospheric dynamics. We then assess this relationship in the CMIP5 ensemble in section 4.
Section 5discusses some implications of our results. 2. Data and methods
a. Rainfall and atmospheric reanalysis
Two rainfall datasets covering 1950–2005 are used in our analysis. The first is from the archive originally pro-duced by Nicholson (1986)(NIC131). This dataset has been updated, with most Sahelian stations now extending to at least 2005. A total of 319 stations are available in the Sahel domain, although the number available for any given year varies. Further information about the dataset is provided inNicholson (2001)and S. E. Nicholson et al. (2016, manuscript submitted to Int. J. Climatol.). The second dataset is from the Climate Research Unit Time Series, version 3.21 (CRU TS) (Harris et al. 2014). To match the coarser resolution of the CMIP5 climate models, CRU TS rainfall was interpolated to a common
2.58 3 2.58 resolution using triangulation-based cubic in-terpolation. The latitudinal bounds of the West African Sahel rainfall domain used to create a rainfall time series (Fig. 1) (12.58–17.58N) were chosen to be as close to those
specified byNicholson (2013)(148–188N) as the common
2.58 rainfall resolution would allow. While many studies extend their definition of the Sahel domain eastward to include Chad (22.58E), we limit ours to the eastern border of Niger/Nigeria (17.58E).
Historical atmospheric zonal wind and temperature data were from the National Centers for Environmental Prediction–National Center for Atmospheric Research
(NCEP–NCAR) reanalyses (Kalnay et al. 1996).
NCEP–NCAR data were provided on a 2.58 3 2.58
horizontal grid and spanned from 1000 to 100 hPa. NCEP–NCAR data were provided by NOAA/OAR/ ESRL Physical Sciences Division (fromhttp://www.esrl. noaa.gov/psd/). Our analysis focuses on the July–August (JA) period as this is when CMIP5 models struggle to match observations (Fig. 1b). July–August is the peak of the rainy season over the Sahel, and rainfall in these months correlates strongly with annual totals (NIC131/ CRU TS correlation coefficient R5 0.86/0.92). b. CMIP5
Simulated rainfall, zonal wind, and atmospheric tem-perature spanning 1950–2005 are from historical simu-lations with observed greenhouse gas concentrations (Taylor et al. 2012) (CMIP5). The 30 simulations from 17 models are shown inTable 1. All CMIP5 data were obtained through the Earth System Grid Federation data portal (http://pcmdi9.llnl.gov/). These models were
FIG. 1. (a) Average annual rainfall over Africa calculated using NIC131 data from 1950 to 2005. Boxes show domains used to calculate Sahel rainfall time series (small; 12.58–17.58N, 158E–12.58W) and African zonal wind (large; 158S–308N, 158W–17.58E). (b) Seasonal cycle of observed NIC131 rainfall over the Sahel from 1950 to 2005 (blue bars) vs that in CMIP5 historical simulations from 1950 to 2005 (green box plots). Box plots show the spread of the average monthly accumulation total for each model (range as the thin green line, interquartile range as the thick green line, and median as the horizontal black bar).
the complete set available on the portal at the time of access. All rainfall data were mapped onto the 2.58 grid using triangulation-based cubic interpolation.
c. Correlations and statistical significance
Regions of significance in 14-yr (quartile samples of the total 56 yr) composites were calculated using a Monte Carlo approach to test the null hypothesis that there were no significantly different features. First, 104 unique composites of 14 of the randomly selected years were produced, giving a distribution of zonal wind strength in 14-yr composites for each pixel (latitude and pressure level). These were normalized to produce cumulative distribution functions (CDFs), which were then used to calculate the p value for each pixel. All R values (and their associated p values) were calculated using Pearson’s correlation coefficient. To account for our use of multiple hypothesis tests we calculated critical p values in all fig-ures using the false discovery rate (FDR) approach (Ventura et al. 2004). Stippling indicates regions where the null hypotheses were rejected ataFDR5 0.05.
3. Jet dynamics and rainfall
Remote forcing may be viewed as the initial step in a complex teleconnections chain that forces Sahel rainfall variability. The latitudinal bounds of the tropical easterly
jet (TEJ) and African easterly jet (AEJ) delineate a sig-nificant region of African easterly wave (AEW) activity, vertical motion, and the tropical rain belt, which ulti-mately delivers rainfall to the region. These zonal jets are key for supplying energy to the AEWs (Skinner and Diffenbaugh 2013). It is thought that up to 90% of Sahel rainfall is produced by large mesoscale convective sys-tems (Nicholson 2013), which tend to be embedded in the tracks of these waves. As such, the strength and position of these jets represent an interim step by which remote forcing is communicated into Sahel rainfall variability.
Rainfall variability also influences jet dynamics through land surface feedbacks (e.g.,Taylor et al. 2011) and dia-batic heating (e.g., Hagos and Zhang 2010). Such non-linear relationships make it particularly challenging to make any conclusive statement about jet dynamics forcing rainfall. Although all of the CMIP5 models simulate climatological summertime precipitation, they clearly struggle during the peak of the rainy season (Fig. 1b). We focus on the July–August period because this is when the mismatch between observed and CMIP5-simulated rain-fall is the greatest. Inspection of the individual model cycles (not shown) suggests this is not simply due to a shift in the timing of the monsoon cycle.
The three distinct jets are easily identified in the cli-matology of mean July–August density-weighted zonal wind (Fig. 2a). We posit that the leading EOF of this
INM-CM4.0 Institute of Numerical Mathematics 1 1.58 3 1.58 IPSL-CM5A-LR L’Institut Pierre-Simon Laplace 4 1.98 3 1.98 IPSL-CM5A-MR L’Institut Pierre-Simon Laplace 1 1.38 3 1.38 IPSL-CM5B-LR L’Institut Pierre-Simon Laplace 1 1.98 3 1.98 MIROC5 Japan Agency for Marine-Earth Science and Technology,
Atmosphere and Ocean Research Institute (University of Tokyo), and National Institute for Environmental Studies
2 1.48 3 1.48
MIROC-ESM Japan Agency for Marine-Earth Science and Technology,
Atmosphere and Ocean Research Institute (University of Tokyo), and National Institute for Environmental Studies
1 1.48 3 1.48
MPI-ESM-LR Max Planck Institute for Meteorology 3 1.98 3 1.98 MPI-ESM-MR Max Planck Institute for Meteorology 1 1.98 3 1.98
field (EOF1) (Fig. 2b) captures choreographed changes in all zonal jets. Winds were weighted by air density so that the EOF draws power throughout the atmospheric column and not just from the upper troposphere, where high velocity of low-density winds dominates. Compos-ites of zonal wind for years in which EOF1 amplitude was particularly strong and weak are shown inFigs. 2c and 2d, respectively. The time series y of EOF1 strength e1is calculated by projecting the eigenvector onto the atmospheric anomaly field X: y5 Xe1.
These composites show that EOF1 represents 1) a strengthened and broader TEJ over West Africa, 2) en-hanced shear on the southern flank of the AEJ and its slight northward shift, 3) occurrence of the African westerly jet (AWJ), and 4) reduced upper-level westerlies. Each of these dynamic features is known to corre-spond with wetter conditions over the Sahel. A stronger TEJ with greater westward extent is associated with an enhanced monsoon (Sathiyamoorthy 2005) owing to its control of upper-level divergence (Nicholson 2013) and potential influence on wave activity (Nicholson et al.
2008). Enhanced horizontal shear and a northward shift of the AEJ is also linked to a wetter Sahel (Grist and Nicholson 2001;Nicholson 2008). Although not evident in the zonal averages, EOF1 clearly shows the occur-rence of the AWJ (Nicholson 2013), which is thought to play a key role in displacing the AEJ northward. Figures S1 and S2 in the supplemental material show the equivalentFig. 2created using ERA-40 (Uppala et al. 2005) and MERRA (Rienecker et al. 2011). The deep westerly flow extending up to 400 hPa inFig. 2cdoes not appear in the ERA-40 or MERRA composites, which suggests this feature may be an artifact of limited ob-servations in NCEP–NCAR prior to 1979. However, the four key features outlined above are robust to changes in reanalysis product and observational period.
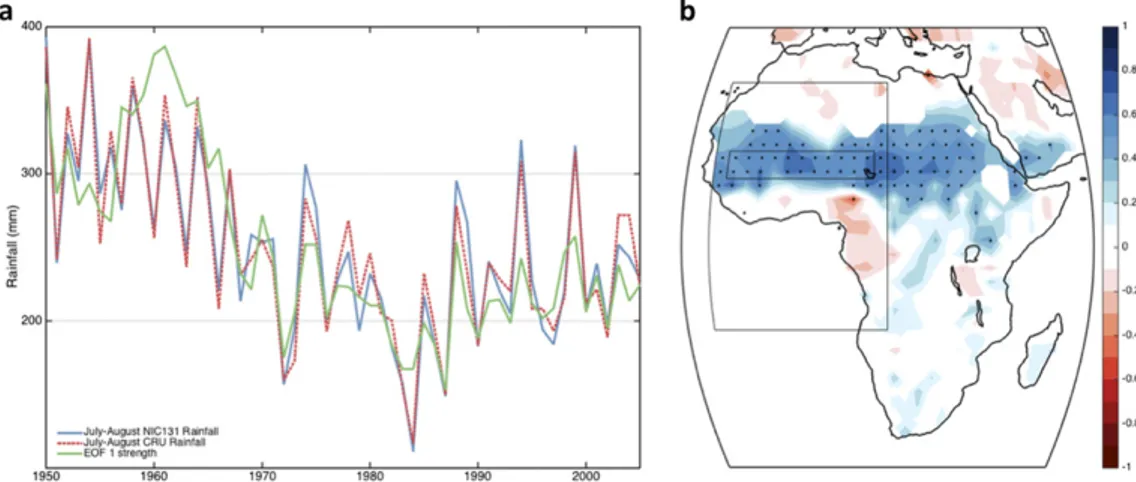
EOF1 appears to capture a key mode of variability in which changes at the level of all zonal jets are acting constructively to bring wetter or drier conditions to the Sahel (Fig. 3a). Specifically, this figure shows strong cor-relation between EOF1 of density-weighted zonal wind and Sahel rainfall. This relationship holds for both
FIG. 2. (a) Climatology of density-weighted mean JA zonal wind from the NCEP–NCAR reanalyses (from 1950 to 2005). Values are zonally averaged from 158E to 12.58W (domain shown inFig. 1b). Low-level westerlies are primarily the monsoon flow, but the AWJ is labeled to show where this feature occurs. (b) The leading EOF1 of the annual field shown in (a) (65% variance explained). Composites of mean JA zonal wind during the (c) 14 strongest and (d) 14 weakest EOF1 years (upper and lower 25% of years). The stippling indicates grids where the composite value is a significant departure from background variability (aFDR5 0.05; see methods).
interannual and decadal variability, with the wetter con-ditions of the 1950s and early 1960s corresponding to a much stronger EOF1.Figure 3bshows how this significant coupling is not limited to our Sahel domain but extends across central and East Africa. Not only does EOF1 characterize the primary mode of jet variability through-out the troposphere, correlation of EOF1 with Sahel rainfall provides a quantified index of jet–rainfall coupling. This jet–rainfall coupling holds for both pure station (NIC131 prior to interpolation) and gridded (CRU TS) rainfall data. Furthermore, this relationship does not appear to be sensitive to the choice of reanalysis or rainfall product. The equivalent EOF1 amplitude in MERRA and Sahel rainfall time series in GPCP (Xie et al. 2003) show a correlation coefficient of 0.78 (1979– 2013, not shown). We use NCEP–NCAR reanalyses and NIC131/CRU TS data because the length of the record is significantly longer, allowing for more statistically robust comparisons with the historical CMIP5 runs.
4. Jet–rainfall coupling in CMIP5
Figure 4 shows how CMIP5 models struggle to re-produce jet–rainfall coupling over the Sahel. The en-semble mean correlation map shows weak-to-moderate positive correlations over East and central Africa and mean R values of less than 0.2 in the western Sahel toward the coast. The grid counts in Fig. 4b confirm that the weaker ensemble mean R values correspond to fewer models capturing a significant relationship and not the averaging out of shifted positive/negative correlation patterns. This lack of jet–rainfall coupling could result from incorrect remote forcing of the jets (‘‘upstream’’ of
the jets) or unrealistic parameterizations of the subgrid-scale processes that ultimately deliver rainfall to the Sa-hel (‘‘downstream’’ of the jets). However, land surface feedbacks that influence jet dynamics make answering this question particularly challenging (Taylor et al. 2011;
Nicholson 2013).
We focus on the Sahel to show jet–rainfall coupling for individual simulations inFig. 5. Every model simu-lation we analyzed underestimates the R value com-pared to historical observations (0.76) (Fig. 3b). It is important to consider that EOFs derived from finite samples are only estimates of the ‘‘true’’ eigenvalues and eigenvectors (Quadrelli et al. 2005). However, that ensemble runs of the same model tend to cluster along the x axis suggests this measure of the jet–rainfall cou-pling is intrinsic to the model and not simply the result of natural variability and sampling issues. Three variants of GISS-E2 show the ‘‘worst’’ (most negative) coupling, which is likely related to their unrealistically strong AEJ and weak TEJ over West Africa (Fig. S3 in the supple-mental material).
Notably, IPSL-CM5B-LR shows the strongest correla-tion between EOF1 and Sahel rainfall, whereas two of the four IPSL-CM5A-LR simulations show negative corre-lations. Relative to CM5A, CM5B represents a complete recasting of turbulence, convection, and cloud parame-terization (Hourdin et al. 2013), implying these processes may hold the key for models to capture realistic rainfall coupling. The color of each bar corresponds to how closely the internally generated EOF1 in the historical simulation matches EOF1 in NCEP–NCAR reanalyses.
Generally, the reds inFig. 5correspond to larger-magnitude, positive correlations and the blues to
FIG. 3. (a) Time series of JA Sahel rainfall (NIC131 in blue and CRU TS in red) and JA EOF1 amplitude (NCEP–NCAR in green) from 1950 to 2005. All time series were normalized to have the same mean and std dev as the CRU TS JA rainfall. Correlation coefficient between EOF1 amplitude and both NIC131 and CRU TS rainfall is 0.76. (b) Correlation map of JA EOF1 amplitude vs CRU TS JA rainfall. Stippling indicates corre-lations significant ataFDR5 0.05 (see methods).
insignificant or negative correlations. This pattern suggests that the ability of a model to correctly simu-late an EOF1 that matches NCEP–NCAR EOF1 may relate to the ability of that model to simulate realistic jet–rainfall coupling. However, owing to rainfall feedbacks on the jets, it is difficult to establish whether more realistic jets are forcing more realistic rainfall variability or vice versa. Our focus on JA rainfall to-tals does not address the role of jet dynamics in simulating a realistic seasonal cycle. Further insight
might be gained by first screening the models for their ability to produce realistic rainfall seasonality.
5. Conclusions
In this study we showed how the leading EOF of density-weighted zonal wind (momentum flux) over West Africa captures a key mode of variability in jet dynamics throughout the troposphere (the TEJ, AEJ, and AWJ) (Fig. 2). In turn, an index of this EOF can be
FIG. 4. (a) As inFig. 2a, but for the ensemble mean of correlation maps for 30 CMIP5 historical simulations (from 1950 to 2005; seeTable 1for list of models). JA EOF1 is derived—and therefore different—for each CMIP simulation. (b) Count of grid points in the 30 CMIP simulations for which JA rainfall within the grid point was significantly correlated to the amplitude of the model’s JA EOF1 (aFDR5 0.05; see methods).
FIG. 5. Correlation coefficient between EOF1 strength and JA Sahel rainfall in 30 CMIP5 historical simulations (from 1950 to 2005; seeTable 1for list of models). Colors correspond to the pattern correlation between the EOF1 in NCEP–NCAR reanalyses (Fig. 1b) and that in the CMIP5 simulation.
cautious of CMIP5 rainfall projections over the Sahel. The lack of jet–rainfall coupling could be the result of deficiencies in a number of processes forcing Sahel rainfall. Ocean models may produce unrealistic re-mote forcing, or, even with completely realistic rere-mote forcing, the atmospheric dynamical cores could simu-late incorrect jets. It is likely that parameterized subgrid-scale convective processes are either failing to trigger wave activity or incorrectly translating land surface processes such as how rainfall variability feeds back into jet variability. We find it promising that the new parameterizations in the IPSL model resulted in a
dramatic improvement in jet–rainfall coupling.
Hopefully similar improvements will be realized in many of the CMIP6-generation models. The research community must confirm this new generation of models can realistically simulate historical jet–rainfall coupling before utilizing Sahel rainfall projections to assess future rainfall. Validating jet–rainfall coupling will allow studies to isolate many other GCM weak-nesses that may also be critical in predicting future rainfall over the Sahel.
Our zonal wind EOF framework also provides a useful tool in future studies hoping to understand the mechanisms delivering rainfall to the Sahel. Although previous studies have qualitatively assessed the
im-portant dynamics over West Africa (Skinner and
Diffenbaugh 2013), a quantitative framework has been lacking. The ability to evaluate an integral pattern of jet dynamics adds resolution to the teleconnections chain and could be applied to study processes either upstream (e.g., the propagation of remote greenhouse gas, aerosol, and SST forcing on the zonal jets) or downstream (e.g., the control of jets on AEWs and mesoscale convective systems) in the teleconnections chain.
Acknowledgments. This study was supported by the U.S. National Aeronautics and Space Administration under Grant NNX09AK26G.
droughts. Nat. Geosci., 1, 647–648, doi:10.1038/ngeo320. Diallo, I., M. B. Sylla, M. Camara, and A. T. Gaye, 2013:
In-terannual variability of rainfall over the Sahel based on mul-tiple regional climate models simulations. Theor. Appl. Climatol., 113, 351–362, doi:10.1007/s00704-012-0791-y. Dong, B., and R. Sutton, 2015: Dominant role of greenhouse-gas
forcing in the recovery of Sahel rainfall. Nat. Climate Change, 5, 757–760, doi:10.1038/nclimate2664.
Grist, J. P., and S. E. Nicholson, 2001: A study of the dynamic factors influencing the rainfall variability in the West African Sahel. J. Climate, 14, 1337–1359, doi:10.1175/ 1520-0442(2001)014,1337:ASOTDF.2.0.CO;2.
Hagos, S., and C. Zhang, 2010: Diabatic heating, divergent cir-culation and moisture transport in the African monsoon system. Quart. J. Roy. Meteor. Soc., 136, 411–425, doi:10.1002/ qj.538.
Harris, I., P. D. Jones, T. J. Osborn, and D. H. Lister, 2014: Updated high-resolution grids of monthly climatic observations—The CRU TS3.10 dataset. Int. J. Climatol., 34, 623–642, doi:10.1002/ joc.3711.
Haywood, J. M., A. Jones, N. Bellouin, and D. Stephenson, 2013: Asymmetric forcing from stratospheric aerosols impacts Sa-helian rainfall. Nat. Climate Change, 3, 660–665, doi:10.1038/ nclimate1857.
Hourdin, F., and Coauthors, 2013: LMDZ5B: The atmospheric component of the IPSL climate model with revisited param-eterizations for clouds and convection. Climate Dyn., 40, 2193–2222, doi:10.1007/s00382-012-1343-y.
Kalnay, E., and Coauthors, 1996: The NCEP/NCAR 40-Year Re-analysis Project. Bull. Amer. Meteor. Soc., 77, 437–471, doi:10.1175/1520-0477(1996)077,0437:TNYRP.2.0.CO;2. Nicholson, S. E., 1986: The spatial coherence of African rainfall
anomalies: Interhemispheric teleconnections. J. Climate Appl. Meteor., 25, 1365–1381, doi:10.1175/1520-0450(1986)025,1365: TSCOAR.2.0.CO;2.
——, 2001: Climatic and environmental change in Africa during the last two centuries. Climate Res., 17, 123–144, doi:10.3354/ cr017123.
——, 2008: The intensity, location and structure of the tropical rainbelt over West Africa as factors in interannual variability. Int. J. Climatol., 28, 1775–1785, doi:10.1002/joc.1507. ——, 2013: The West African Sahel: A review of recent studies on
the rainfall regime and its interannual variability. ISRN Me-teor., 2013, 453521, doi:10.1155/2013/453521.
——, A. I. Barcilon, and M. Challa, 2008: An analysis of West African dynamics using a linearized GCM. J. Atmos. Sci., 65, 1182–1203, doi:10.1175/2007JAS2194.1.
Park, J.-Y., J. Bader, and D. Matei, 2015: Northern-Hemispheric differential warming is the key to understanding the discrep-ancies in the projected Sahel rainfall. Nat. Commun., 6, 5985, doi:10.1038/ncomms6985.
Quadrelli, R., C. S. Bretherton, and J. M. Wallace, 2005: On sam-pling errors in empirical orthogonal functions. J. Climate, 18, 3704–3710, doi:10.1175/JCLI3500.1.
Rienecker, M. M., and Coauthors, 2011: MERRA: NASA’s Modern-Era Retrospective Analysis for Research and Applications. J. Climate, 24, 3624–3648, doi:10.1175/JCLI-D-11-00015.1. Rodríguez-Fonseca, B., and Coauthors, 2015: Variability and
pre-dictability of West African droughts: A review on the role of sea surface temperature anomalies. J. Climate, 28, 4034–4060, doi:10.1175/JCLI-D-14-00130.1.
Roehrig, R., D. Bouniol, F. Guichard, F. D. Hourdin, and J. L. Redelsperger, 2013: The present and future of the West Af-rican monsoon: A process-oriented assessment of CMIP5 simulations along the AMMA transect. J. Climate, 26, 6471– 6505, doi:10.1175/JCLI-D-12-00505.1.
Sathiyamoorthy, V., 2005: Large scale reduction in the size of the tropical easterly jet. Geophys. Res. Lett., 32, L14802, doi:10.1029/2005GL022956.
Skinner, C. B., and N. S. Diffenbaugh, 2013: The contribution of African easterly waves to monsoon precipitation in the CMIP3 ensemble. J. Geophys. Res. Atmos., 118, 3590–3609, doi:10.1002/ jgrd.50363.
Sylla, M. B., I. Diallo, and J. S. Pal, 2013: West African monsoon in state-of-the-science regional climate models. Climate Variability— Regional and Thematic Patterns, A. Tarhule, Ed., InTech, 3–36, doi:10.5772/55140.
Taylor, C. M., A. Gounou, F. Guichard, P. Harris, R. Ellis, F. Couvreux, and M. De Kauwe, 2011: Frequency of Sahelian storm initiation enhanced over mesoscale soil-moisture pat-terns. Nat. Geosci., 4, 430–433, doi:10.1038/ngeo1173. Taylor, K. E., R. J. Stouffer, and G. A. Meehl, 2012: An overview of
CMIP5 and the experiment design. Bull. Amer. Meteor. Soc., 93, 485–498, doi:10.1175/BAMS-D-11-00094.1.
Tseng, Y., Y. Lin, M. Lo, and S. Yang, 2016: Diagnosing the pos-sible dynamics controlling Sahel precipitation in the short-range ensemble community atmospheric model hindcasts. Climate Dyn., 47, 2747–2764, doi:10.1007/s00382-016-2995-9. Uppala, S. M., and Coauthors, 2005: The ERA-40 Re-Analysis.
Quart. J. Roy. Meteor. Soc., 131, 2961–3012, doi:10.1256/ qj.04.176.
Ventura, V., C. J. Paciorek, and J. S. Risbey, 2004: Controlling the proportion of falsely rejected hypotheses when conducting multiple tests with climatological data. J. Climate, 17, 4343– 4356, doi:10.1175/3199.1.
Xie, P., and Coauthors, 2003: GPCP pentad precipitation analyses: An experimental dataset based on gauge observations and satellite estimates. J. Climate, 16, 2197–2214, doi:10.1175/ 2769.1.