HAL Id: hal-02454916
https://hal.archives-ouvertes.fr/hal-02454916
Submitted on 6 Mar 2020
HAL is a multi-disciplinary open access
archive for the deposit and dissemination of
sci-entific research documents, whether they are
pub-lished or not. The documents may come from
teaching and research institutions in France or
abroad, or from public or private research centers.
L’archive ouverte pluridisciplinaire HAL, est
destinée au dépôt et à la diffusion de documents
scientifiques de niveau recherche, publiés ou non,
émanant des établissements d’enseignement et de
recherche français ou étrangers, des laboratoires
publics ou privés.
Copyright
To cite this version:
Hugo Lepage, Matthieu Masson, Doriane Delanghe, Chloé Le Bescond. Grain size analyzers:
re-sults of an intercomparison study. SN Applied Sciences, Springer Verlag, 2019, 1 (9), pp.1100.
�10.1007/s42452-019-1133-9�. �hal-02454916�
Manuscript Number: SNAS-D-19-01905R1
Full Title: Grain size analyzers: results of an intercomparison study
Article Type: Research Article
Section/Category: Earth and Environmental Sciences Funding Information:
Abstract: In sciences involving soil and sediment, particle size distribution (PSD) has been one of the parameters given most attention over the past few decades. Formerly measured by sieving and sedimentation techniques, it is nowadays routinely characterized by the laser diffraction method (LDM). Many manufacturera develop particle size analyzers using LDM, but each device is characterized by specific parameters that can lead to different PSD. At the Rhône Sediment Observatory, suspended particulate matter collected along the Rhône River are analyzed for PSD by four different LDM devices. Analyses were conducted on certified materials and sediment samples for each device. The tests highlighted the difficulty of accurately characterizing PSD, even in the case of certified materials. First, differences observed for a specific device were linked to the heterogeneity observed in the subsamples due to the presence of organic materials such as tree leaves. Second, the difference regarding the certified materials was linked to the laser diffraction method which leads in some cases to underestimating clay content and sand. Third, the main difference observed between the devices was linked to sonication. The results demonstrate that its power is rarely investigated and that it has a considerable impact when used. However, despite significant differences, the trend was similar for each device, with accurate characterizations of the main modal class in most cases. Thus, in the absence of exact knowledge of parameters such as sonication power and pump speed, it is recommended to compare only the trends of the results obtained from the different devices.
Keywords: Particle size distribution; laser diffraction; ultrasound sonication; suspended particulate matter; Sediment
Corresponding Author: Hugo Lepage
Institut de Radioprotection et de Sûreté Nucléaire Fontenay aux Roses, FRANCE
Corresponding Author Secondary Information:
Corresponding Author's Institution: Institut de Radioprotection et de Sûreté Nucléaire Corresponding Author's Secondary
Institution:
First Author: Hugo Lepage
First Author Secondary Information:
Order of Authors: Hugo Lepage
Matthieu Masson Doriane Delanghe Chloé Le Bescond Order of Authors Secondary Information:
Author Comments:
Response to Reviewers: Dear Editor,
Please find enclosed the corrected manuscript according to the reviewer comments. A global reading of the paper was conducted and errors in the language were corrected.
On behalf of the authors, Hugo Lepage
Corresponding authors, IRSN, PSE-ENV/SRTE/LRTA
Centre de Cadarache, bat 159, 13115 St Paul lez Durance, France [email protected]
Suggested Reviewers: Nele De Belie
Magnel Laboratory for Concrete Research, Department of Structural Engineering, Faculty of Engineering and Architecture, Ghent University, Technologiepark Zwijnaarde 904, 9052 Ghent, Belgium
[email protected] Working on the same field
Magdalena Ryzak
Institute of Agrophysics, Polish Academy of Sciences, Lublin, Poland [email protected]
Working on the same field
1 2 3 4 5 6 7 8 9 10 11 12 13 14 15 16 17 18 19 20 21 22 23 24 25 26 27 28 29 30 31 32 33 34 35 36 37 38 39 40 41 42 43 44 45 46 47 48 49 50 51 52 53 54 55 56 57 58 59 60 61 62 63 64 65 1 2 3 4 5 6 7 8 9 10 11 12 13 14 15 16 17 18 19 20 21 22 23
Grain size analyzers: results of an intercomparison study
Hugo Lepage3-*, Matthieu Massonb, Doriane Delanghec, Chloé Le Bescondba Institut de radioprotection et de Sûreté Nucléaire (IRSN), PSE-ENV, SRTE/LRTA, BP 3,13115 Saint-Paul- lez-Durance, France
b Irstea, UR RiverLy, centre de Lyon-Villeurbanne, 5 rue de la Doua CS 20244, 69625 Villeurbanne, France
c Aix Marseille Univ, CNRS, IRD, INRA, Coll France, CEREGE, Aix-en-Provence, France
*Corresponding author: [email protected] - 0442199462 - httDs://orcid.org/0000-0002-2260-859X
ABSTRACT
In sciences involving soil and sediment, particle size distribution (PSD) has been one of the parameters given most attention over the past few decades. Formerly measured by sieving and sedimentation techniques, it is nowadays routinely characterized by the laser diffraction method (LDM). Many manufacturers develop particle size analyzers using LDM, but each device is characterized by specific parameters that can lead to different PSD. At the Rhône Sediment Observatory, suspended particulate matter collected along the Rhône River are analyzed for PSD by four different LDM devices. Analyses were conducted on certified materials and sediment samples for each device. The tests highlighted the difficulty of accurately characterizing PSD, even in the case of certified materials. First, differences observed for a specific device were linked to the heterogeneity observed in the subsamples due to the presence of organic materials such as tree leaves. Second, the difference regarding the certified materials was linked to the laser diffraction method which leads in some cases to underestimating clay content and sand. Third, the main difference observed between the devices was linked to sonication. The results demonstrate that its power is rarely investigated and that it has a considerable impact when used. However, despite significant differences, the trend was similar for each device, with accurate characterizations of the main modal class in most cases. Thus, in the absence of exact
24 25 26 27 28 29 30 31 32 33 34 35 36 37 38 39 40 41 42 43 44 45
knowledge of parameters such as sonication power and pump speed, it is recommended to compare only the trends of the results obtained from the different devices.
Key word
Particle size distribution, laser diffraction, ultrasound sonication, suspended particulate matter, sediment
Article Highlights
• Differences on the particle size distribution were always observed even with the certified samples.
• The use of ultrasound sonication increases or triggers differences in the particle size distribution.
• The lower is the proportion of a textural class (clay/silt/sand), the higher is the relative difference.
1. INTRODUCTION
Much research has been conducted over recent decades to understand the dynamics and behavior of sediment and suspended particles in rivers. Understanding the processes that affect the transport of these particles is crucial for ecological, economic and societal purposes, as the world's rivers are becoming more anthropized [1,2]. The investigation of their nature and origins has now become essential [3]. Among the different parameters used to characterize particles when studying their behavior (e.g., mineralogy, shape, color), particle size remains one of those most investigated
46 47 48 49 50 51 52 53 54 55 56 57 58 59 60 61 62 63 64 65 66 67 68 69 70
The characterization of particle size distribution (PSD) can be performed using several techniques such as sieving, by pipette based on Stokes diameters, and laser diffraction [6-8]. The choice of the optimum grain-size analysis technique depends on the aim of the study and the type of sediment [8]. For loamy sediments, laser diffraction instruments produced the best results for the various criteria [8]. The main differences observed between the laser diffraction method (LDM) and the other methods are related to particle morphology and clay mineralogy [5,9]. Clay content can be underestimated in suspended sediments [10].
The LDM is widely used on sediment and suspended particles as it covers a wide range of grain sizes and requires short analysis time [5,8,11]. For example, particle size analyses are processed on cores recovered from marine, estuarian and coastal zones for paleoceanographic and sea level reconstructions [12-15] and paleo-environmental questions associated with human history [16-18]. PSD is now commonly used to improve soil and sediment fingerprinting [19] and to investigate the concentration of trace metals in sediments. Apart from the geosciences, many domains such as forensic studies [20], pharmaceuticals and industry use this technology and require greater detail on the data acquired from different lasers.
Nowadays, many devices from different manufacturers are used to measure PSD by LDM, with different designs and software applications, leading to slightly different distributions [8,21]. Bieganowski et al. (2018) suggested that about 24 factors can influence the PSD results and lead to uncertainty or error. Differences arise as all these parameters vary between devices and laboratories, since resolving the issue of the homogeneous resuspension of sediment is a complex [22]. For example, it has been demonstrated that the use of ultrasonic power can destroy aluminum and silica particles due to the dissolution mechanism [23] and that the addition of oxidizing solutions to remove organic matter can also alter clay particles such as vermiculite [24]. However, intercomparisons of PSD measurements were performed more between the different PSD techniques described above than between different LDM devices. Nevertheless, differences were observed for the PSD and the
71 72 73 74 75 76 77 78 79 80 81 82 83 84 85 86 87 88 89 90 91 92 93 94 95
proportion of clay measured by the devices of different manufacturers [8,10]. Unfortunately, in the study conducted by Goossens (2008) on loamy sediments (sieved at 90pm), the impact of sand particles and the use of ultrasound sonication (US) has not been addressed.
To investigate PSD, most of these studies used statistical parameters such as mean, median and standard deviation to summarize PSD or Kurtosis and the Skewness index to describe the variability of PSD [25,26]. However, such parameters might not be sufficient to describe PSD in a non-lognormal or multimodal distribution [27,28]. Suspended sediment PSDs are mainly multimodal and the location of modes can be related to the transportation processes and the origins of the particles [28]. Also, modes can be used to investigate the dynamics of sediment deposition [29]. Several mathematical solutions were developed to summarize and describe raw PSD such as two or five parameters Log- normal equations [30,31], demodulation [32] and surface plots [28]. Unfortunately, these approaches can be complex for people unfamiliar with advanced mathematics. This may explain why scientific publications and technical reports are still published with common parameters [33-35]. Also, depending on the study context, it is not necessary to rely on advanced solutions as common parameters may be sufficient for investigating PSD.
Since 2009, within the context of the Rhône Sediment Observatory (OSR) program, scientists have studied the transport of particles and their associated contaminants along the entire course of the Rhône River (from Lake Geneva to the Mediterranean Sea), the main source of sediments in the northern Mediterranean [36]. All these investigations are well-documented due to the presence of several monitoring stations located along the Rhône River and in its main tributaries [37]. Particle samples for chemical analysis are routinely collected. Analyses of PSD are systematically conducted not only to study the transport of particles but also to improve the interpretation of contaminant concentrations and they can also be used for transport modelling. For example, the use of different
96 97 98 99 100 101 102 103 104 105 106 107 108 109 110 111 112 113 114 115 116 117 118
sampling techniques for suspended particle sampling (particle trap and continuous flow centrifugation) leads to a bias in particle size [38]. In the case of large environmental monitoring networks such as the OSR program, PSD analyses are processed by an array of laboratory lasers.
It is therefore crucial to evaluate the potential biases induced by the use of different devices in the PSD results. The Intercomparison was conducted by studying the differences observed on common parameters, such as the proportion of clay/silt/sand resulting from the analysis - with and without US - of reference standards and samples collected in the field. The objective was not to define which device is the most accurate but quantify the relative difference that might be observed and how the results can be interpreted and compared. Answering this question is crucial for the organizations responsible for river surveys, as we provide tools for comparisons between all the PSDs analyzed within the OSR.
2. MATERIALS AND METHOD
2.1. Particle size analyzers
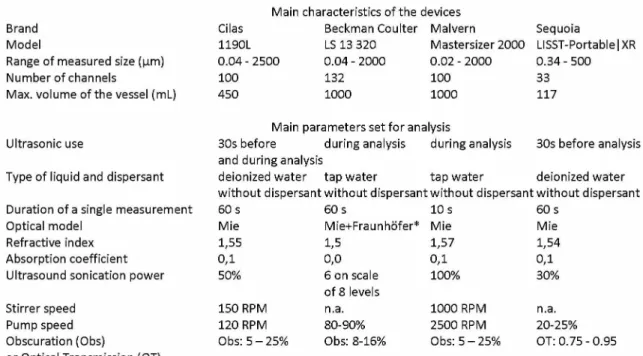
In the OSR program, grain size is assessed using the following devices: a Beckman Coulter LS 13 320 (Beckman Coulter, Fullerton, CA, USA), a Cilas 1190L (Cilas Company Ltd., Orléans, France), a Malvern Mastersizer 2000 (Malvern Instruments Ltd., Malvern, UK) and a Sequoia LISST-Portable|XR (Sequoia Scientific, Bellevue, WA, USA). These devices will be referred to as Coulter, Cilas, Malvern and Portable, respectively, for the rest of the article. As expected, the main characteristics of these devices differ (Table 1).
2.2. Protocol of intercomparison
The intercomparison of the devices was conducted using certified reference materials (CRMs) and natural samples from the Rhône River and its tributaries:
119 120 121 122 123 124 125 126 127 128 129 130 131 132 133 134 135 136 137 138 139 140 141
• Measurements were performed on CRMs to investigate the accuracy of the different devices and highlight the differences between them. Three CRMs were selected in order to accurately represent the ranges of suspended particle size, mostly silt-size [38], observed in the Rhône River: BCR-066 (0.35-3.5 pm) and BCR-067 (2.4-32 pm) [39,40]; SRM1003c (25-50 pm) [41].
• Artificial multimodal distributions were created to assess the capacity of the device to efficiently characterize the different modes. To do this, three mixtures of the 3 CRMs were prepared by weighing masses in order to reach the following proportions (BCR-066/BCR- 067/SRM1003c in %): Mix_A: 25/50/25, Mix_B: 50/25/25 and Mix_C: 25/25/50.
• As CRMs are mostly composed with glass-quartz particles, they are not qualitatively representative of the suspended particulate matter (SPM) encountered in the Rhône River [42], especially regarding their aggregation properties. Therefore, an intercomparison was also conducted on the SPM samples collected in the observatory. Four samples were collected using different methods at different stations to characterize the diversity observed in this observatory:
o Arc River (45°33'44.6"N 6°12'22.8"E): lag deposits that settled during a flood event were
collected manually with a plastic spatula. This sediment was sieved in order to keep only a sandy fraction between 100 pm and 2 mm.
o Azergues River (45°56'11.5"N 4°43'24.6"E): bottom sediment collected by a sediment
dredge (Eckman),
o Jons monitoring station in the middle Rhône River (45°48'42.3"N 5°05'09.2"E): SPM
142 143 144 145 146 147 148 149 150 151 152 153 154 155 156 157 158 159 160 161 162 163 164
o Barcarin station in the downstream Rhône River (43°25'12.5"N 4°44'50.7"E): SPM collected
using a Niskin bottle 1m above the surface during a flood event in November 2017. This was the only liquid sample comprising SPM in Rhône River water.
• The last step was conducted on a mixture of the samples collected in the Azergues and Arc Rivers to control the proportion of modes and the impact of coarse particles. The mixtures were prepared by weighing dry particles in the following proportions (Azergues/Arc in %): Mix_1: 95/5, Mix_2: 90/10, Mix_3: 85/15, Mix_4: 80/20 and Mix_5: 70/30.
Each sample was homogenized then split into 4 subsamples before being sent to the different laboratories for PSD analysis. For each sample, measurements were repeated on 2 or 3 distinct aliquots depending on the quantity available. Prior to measurement, the subsamples were dispersed in water according to Arvaniti et al. (2014).
The Mie model was used when possible as the optimal model, as it is more useful in samples characterized by fine silt and clay content [43]. The Coulter device was the only device in this intercomparison that uses both models. Depending on the device, the refraction indexes were chosen to be similar and close to silica as the variation of this index can result in different PSDs [11]. The other parameters of the analysis method (Table 1), such as stirrer time and speed, pump speed adapted to the volume of the bowl, ultrasonic duration, and measurement duration, were determined by the users to obtain the best possible results (these parameters were optimized for each device with particulate samples collected in the OSR program).
165 166 167 168 169 170 171 172 173 174 175 176 177 178 179 180 181 182 183 184 185 186 187 188
After a series of tests on the certified standards (data not presented), measurements were performed by conforming to the best obscuration range given by the manufacturer (Table 1). The results of the tests show differences occurring outside those ranges.
Each subsample was analyzed at least three times without US then three times with US to investigate the repeatability of the measurements and the effect of sonication on the natural samples.
2.3. Comparison parameters
One of the main difficulties in conducting an intercomparison on PSD is the need to use synthetic parameters, as the raw distributions cannot be directly compared due to channel inhomogeneity. In the following study, intercomparison will be conducted on several of the parameters used most frequently in environmental studies and especially in the OSR program:
• The median (d50) that synthesizes the distribution by one factor. However, this parameter is not the most relevant in the case of multimodal distribution, as is mostly encountered in rivers [28,31].
• The proportions of clay (<1.95pm), silt (1.95 - 62.5pm) and sand (62.5 - 2000pm) are commonly used for normalization, as contaminants are mostly fixed on clay and silt. Again, this does not give information on distribution shape, especially in the case of multimodality [28] and the range of the classes can vary depending on the scale used [26,44]. This separation into 3 classes will be referred to as "simple classes" for the rest of the text.
• The proportions of detailed classes follow the Doeglas scale [45]: clay (<1.95pm), very fine silt (V_F_Silt: 1.95 - 3.91pm), fine silt (F_Silt: 3.91 - 7.81pm), medium silt (M_Silt: 7.81 - 15.63pm), coarse silt (C_Silt: 15.63 - 31.25pm), very coarse silt (V_C_Silt: 31.25 - 62.5pm), very fine sand (V_F_Sand: 62.5 - 125pm), fine sand (F_Sand: 125 - 250pm), medium sand (M_Sand: 250 - 500pm), coarse sand (C_Sand: 500 - 1000pm), very coarse sand (V_C_Sand:
189 190 191 192 193 194 195 196 197 198 199 200 201 202 203 204 205 206 207 208 209 210
1000 - 2000pm). It allows a good and comparable description of the distribution but the higher classes are less-well adapted for statistical analyses than previous parameters. This separation will be referred to as "detailed classes" for the rest of the text.
2.4. Spécifie case of the LISST Portable|XR device
Due to its lower range of PSD than the other devices (Table 1), and as it cannot characterize the particles with a diameter lower than 0.34 pm, this LDM device is sensitive to rising tails [46-48]. Rising tails can be linked to the refractive index for small particles [49] or shape effects [12], and most studies recommend removing the lower classes and keeping the larger size classes that are consistent [46]. Thus, as rising tails were observable for almost all the samples, the first 5 classes (< 0.72pm) of all the samples measured by the Portable were removed.
However, for this study, both raw and corrected PSDs were used to investigate the impact of rising tails on the PSD. Corrected PSD will be referred to as "Portable_C" for the rest of the text. Only the results of Portable_C will be presented in the graph for the sake of clarity and the results without correction are available in the Electronic Supplementary Material. Also, the presence of bubbles during the analysis led to the presence of modes in the higher classes. This was especially relevant for the CRMs that should not be characterized by such coarse particles. Corrections were performed on references (BCR-066 & BCR-067) and a mixture of references (Mix_C), by deleting the coarser classes.
3. RESULTS
3.1. Accuracy of the devices
The first part entailed measuring the CRMs. For this step, the use of US had a negligible impact as CRMs are characterized by non-cohesive materials (quartz). Only the results with US will be presented in this chapter.
211 212 213 214 215 216 217 218 219 220 221 222 223 224 225 226 227 228 229 230 231 232 233 234 235
First, the results obtained by each device from the different aliquots of the CRMs (Fig. 1) were characterized by low standard deviations (SD) except for mixture C (Mix_C) measured by the Coulter (high SD on clay and coarse silt). For this device with this mixture, the mean d50 ranged from 2.4 ± 0.1 ^m to 6.2 ± 1.4 ^m for the three aliquots measured and the mean proportion of clay ranged from 27 ± 2 % to 42 ± 1 % (Electronic Supplementary Material).
Second, the values measured by the devices were compared to the certified values (Table 2 - Fig. 1). For the finest CRM (BCR-066), all the devices overestimated the d50 (Table 2) and underestimated the proportion of clay (Fig. 1). The absolute difference ranged from 13 % to 34% for the clay proportion, which represented 15% to 40% of the relative difference. For BCR-067 and SRM1003c, the measured d50s were similar to the certified parameters with a relative difference lower than 20% (Table 2). For the simple classes, the relative difference was also lower than 20% but each device measured particles in classes in which the CRMs should not be observed. Indeed, all the PSDs measured by the devices were more spread out with a low amount (<10%) of particles observed in the finer and coarser classes than the expected classes of the CRMs. This difference was clearly observed on the detailed classes (Fig. 1) and the relative difference exceeded 20% for all the devices on the classes certified by the BCR-067 (from 25% to 175%). For the SRM1003c, the difference exceeded 10% only once with the proportion of very coarse silt measured by the Portable_C device (38%) (Fig. 1). Thus, all the devices underestimated the proportion of particle in the modal class (Fig. 1).
The intercomparison of the devices was conducted on those results. The d50s measured on the CRMs by the four devices were similar whereas significant differences were observed between the devices for the mixtures (Table 2). For instance, the d50 measured by the Cilas for mixture C (11.4 ± 0.5 ^m) was more than twice as high as the d50 measured by the Coulter (4.6 ± 2.3 ^m). Modal classes
236 237 238 239 240 241 242 243 244 245 246 247 248 249 250 251 252 253 254 255 256 257 258 259
of the CRMs (unimodal) and the mixtures (bimodal) were accurately characterized by all the devices with the exception of mixture B measured by the Coulter. For this mixture, the PSD measured by the Coulter was unimodal and no particles coarser than medium silt was measured whereas it represented more than 20% for the other device (Fig. 1). Thus, the proportion of clay measured by the Coulter was significantly higher than the other devices for this mixture (54% vs 30% to 33% - Fig. 1). For the other samples, the proportions measured by the devices were similar (<10% absolute difference) except for the finest CRM (BCR-066). The proportions of clay measured by the Cilas and the Coulter on this CRM (74% and 70%, respectively) were significantly higher than the two other devices (53% and 58% - Fig. 1).
3.2. Natural samples
The first natural sample, collected directly in the water flow with a Niskin bottle at Barcarin, was mostly silt sized with a non-negligible proportion of clay (Fig. 2 - Table 3). The PSD measured by the different devices were similar, so as for the d50 (Table 4). A difference was observed only for the Coulter which measured a significant and higher proportion of clay (+11-13%), as observed previously for Mixtures B and C (Fig. 1). The d50 measured by the Coulter was strictly lower than the other devices (Table 4). Sonication was used only on the Cilas and had a negligible impact on this sample (Electronic Supplementary Material).
The sample collected by particle trap at Jons was coarser than the SPM from Barcarin (Fig. 2), with a significant proportion of sand (up to 27 % - Table 3). The differences between the devices observed on the measures performed without US remained lower than 10% (Fig. 2) and the d50s were similar (Table 4). As observed previously, the d50 and the clay content measured by the Coulter were respectively lower and higher than the results obtained by the two other devices. The use of US led to significant change in the PSD for the Portable_C (from 20% to 3% of very fine sand), while PSD
260 261 262 263 264 265 266 267 268 269 270 271 272 273 274 275 276 277 278 279 280 281 282 283 284
remained similar for the Coulter and Cilas. Thus, the proportion of silt was significantly higher (+20%) for the Portable_C with sonication than for the other devices (Table 3).
The bottom sediment collected in the Azergues River was characterized by a mix of silt and sand particles (Table 3), with the main mode observed between the coarse silt and the very fine sand (Fig. 2). In absence of US, the trend was similar for each device and only the Portable_C was characterized by a higher proportion in the silted classes and a lower proportion of sand. The proportion of silt measured by Portable_C (72.6 ± 9.9 %) was significantly higher than the other devices (from 44.2 to 51.3 %) but characterized by a high standard deviation. The use of US on this sample led to a significant variation for all the devices and to an increase of silt particles (+ 6% to 37%) for all the devices (Table 3). However, this variation was greater for the Cilas (Fig. 2) (+37% of silt) than for the three other devices (+6-16%). The proportions of the classes after US were different and separated into two groups: Cilas and Portable_C with almost 90% silt, with coarse silt as the modal class, and Coulter and Malvern characterized by a large proportion of sand (35-43%) and very coarse silt as the modal class. Once again, the differences observed for the d50 were significant whether US was used or not (Table 4). For instance, d50s measured by the Malvern with and without US (respectively 40.0 ± 5.4 pm and 71.6 ± 5.8 pm) were two times higher than on Portable_C (20.9 ± 1.8 pm and 37.9 ± 9.1 pm).
The last sample, the lag deposit collected in the Arc River, was characterized by fine sands (Fig. 2). For the four devices, the proportion of sand was higher than 80% and reached 100% for the Malvern (Table 3). The Coulter and Portable_C distributions were characterized by higher uncertainty intervals. These devices also measured a higher mean proportion of silt particles compared to the other two devices, resulting in a significantly lower d50 (Table 4). However, despite this difference, the trend was similar between the devices with the maximum proportion observed in the fine sand class (Fig. 2). The
285 286 287 288 289 290 291 292 293 294 295 296 297 298 299 300 301 302 303 304 305 306 307
PSDs measured by the Malvern were less spread than for the other device while the proportion of sand classes measured by the Cilas was more spread with a lower proportion in the modal class (F_Sand) and a higher proportion in the coarser sand class (M_Sand). Finally, as this sample was mostly sandy, US had a negligible impact on the distribution, as observed for the d50 (Table 4).
3.3. Mixtures of natural samples
Measures were then performed on the mixtures of the Arc and Azergues samples. As expected, the increase of the proportion of the coarser sample (from mixture 1 to 5) led to a higher d50 (Fig. 3) and higher proportions in the coarser classes (Electronic Supplementary Material) whatever sonication was used or not. However, breaks were observed for the Coulter (Mix_1), the Malvern (Mix_4 and Mix_5) and the Portable_C (Mix_3 and Mix__5).
The differences observed between the devices were similar to the difference observed for the Azergues sample as it represented more than 70% of the mixture. Thus, the parameters were different both with and without US (Fig. 4). Significant differences were observable for d50 and with the proportion of silt and sand, whereas the proportion of clay remained lower than 5% for each device (Fig. 4). The position of the main mode was also different, both without (simple and detailed classes) and with US (detailed classes). Using US led to the strong variation for simple classes measured by the Cilas and the Portable_C (+35% silt) whereas it had no effect for the Coulter (Fig. 3-4). US also affected the Malvern device (+20% silt). The trends and the differences between the devices were similar whatever the proportion of sand in the samples.
4. DISCUSSION
The measures performed by the 4 devices on the different samples (CRMs, sediments and associated mixtures) allowed determining their respective capacities in terms of measurement quality.
308 309 310 311 312 313 314 315 316 317 318 319 320 321 322 323 324 325 326 327 328 329 330
The results demonstrated that several différences were observed despite the good and reproducible characterization of the main/modal classes and their distribution by the devices. These differences can be separated into three groups: intra-variation, variation with the certified materials, and variation between the devices.
4.1. Intra-variation
The intra-variation is the difference observed for the aliquots of the same subsample measured by the same device. For the CRMs, this difference was observed only in mixture C measured by the Coulter (Fig. 1) and is linked to the operator subsampling operation. Subsampling appears to be highly operator-dependent and can infer variations on the results of the same sample that are even higher than the analytical differences observed [5]. The intra-variation of the natural samples was observed mostly for coarse classes (very coarse silt to fine sand) measured by the Coulter and the Portable_C devices (Fig. 2). This was observed both without and with US and was mainly related to the heterogeneity of the sample particles. Indeed, during the subsampling some samples contained coarse organic particles such as tree leaves that modified the proportions between modes. For the Portable_C, it was also related to the presence of bubbles as explained in the chapter 2.4. To improve the characterization of sand particles, the pump speed of this device was increased for coarse samples and triggered the formation of bubbles. It is therefore relevant to perform measures on multiple sub- samplings of a sample (at least three) to characterize a more precise mean PSD and to be careful with the presence of coarse organic materials and bubbles. Also, the sieving of coarse particles could be a solution for decreasing the pump speed.
4.2. Variation with the CRMs
The measures performed on the CRMs for all the devices presented differences with the certified values. First, they underestimated the proportion of clay in the finest reference (BCR-066) and
331 332 333 334 335 336 337 338 339 340 341 342 343 344 345 346 347 348 349 350 351 352 353 354
the different associated mixtures (Fig. 1). This underestimation was linked to the particle morphology and the clay mineralogy [9] affecting the PSD measured by LDM. Similar observations had already performed by [10,21]. Second, the PSDs measured by all the devices were more spread out than the associated references or mixtures. Also, particles were observed in classes where they should not have been present. For example, all the devices measured clay particles with the BCR-067 and SRM1003c (Fig. 1). However, the proportions in these classes were lower than 10%. This difference might be related to the presence of particles not washed during cleaning. Despite the measure of the background PSD with tap or dionized water, some particles might have been trapped in the system and resuspended during other measurements. This difference might also be linked to the different methods used to characterize the particle size for their certification. BCR-066 and BCR-067 were characterized by the Pipette method [39] which might have triggered differences with the LDM, as observed with the proportion of clay.
To summarize, all 4 devices exhibit the same trends in accuracy from small to coarser particles. However, deviations on the d50 remain roughly lower than 10% for the standard ranging from 4pm to 35pm. As explained previously, the devices do not accurately characterize clay, whatever the proportion observed, with the exception of the total absence of clay. Higher relative differences are observed when the proportion of clay is low (approx. 10%). For the silt, a small difference is observed in the CRMs characterized by almost only silt particles. Below 30% silt, the difference can be significant (from 20% up to 300%), especially for CRMs mainly characterized by clay and silt (BCR-066). Finally, the absence of particles in any simple class is accurately characterized by the devices.
4.3. Intercomparison of the devices
The variation between the devices was observed on almost all the samples including the CRMs and their mixtures and was directly related to the specificities of the devices. As explained previously,
355 356 357 358 359 360 361 362 363 364 365 366 367 368 369 370 371 372 373 374 375 376 377 378 379
each device is manufactured differently (water volume, laser cells, etc.). One of the main source of différences is linked to the use of US and its power. Strong (Cilas, Portable_C) and weak (Coulter) variations were therefore observed after using US for certain samples. The absence of variation for the Coulter demonstrated that the US power might have been insufficient to separate the aggregates. However, it is difficult to investigate US power on CRMs as they are mostly composed of non-cohesive materials and, unfortunately, this parameter was not expressed in Joules by mL [50], so the power used by the different devices was different (Table 1). This observation demonstrates the need to describe the power and time of US used in future studies to ensure reproducibility, as expressed by Bieganowski et al. (2018). Sonication is used to estimate the aggregation index of soil and sediment samples [51] and the results obtained may not be comparable in the absence of such description.
Another strong difference was observed when the main mode was located close to an interval between two classes, a phenomenon also observed for the CRM SRM1003c. The proportion of these two classes could be significantly different between the devices which distribute the mode between them (Fig. 1). Moreover, this distribution can be problematic when the interval is located between clay and silt or silt and sand such as the Azergues sample (Fig. 2 - Table 3). Vigilance is crucial when comparing such results.
Results on raw PSD and corrected PSD of the Portable were compared to investigate the impact of the rising tails observed for the finest classes (Electronic Supplementary Material). The results demonstrated that rising tails had a negligible impact on the proportion of the classes. Highest difference was observed on the clay content of the Barcarin sample with 18% on the raw PSD and 11% on the corrected PSD. Moreover, the potential characterization of a lower proportion of clay by deleting the finest classes remained non-significant and the values were mainly in the range of the values of the other devices. For this specific study, it was not relevant to remove the finest classes. However, correction remained necessary for the coarse modes induced by the presence of bubbles caused by the pump speed as explained above.
380 381 382 383 384 385 386 387 388 389 390 391 392 393 394 395 396 397 398 399 400 401 402 403
To evaluate the différences and allow users to determine those they can obtain with their devices, figures 5, 6 and 7 summarize the observations by grouping all the measures performed on all the natural samples and mixtures for all the parameters studied. Relative differences were then estimated for each device.
For d50 (Fig. 5), the larger differences (up to 80% of relative difference with the mean d50) were observed when the sample was a mix of silt and sand particles with a d50 ranging from 25 pm to 50 pm or from 50 pm to 80pm, with and without US, respectively. For samples with a high d50 (higher than 150pm), the difference remained lower than 20% while it could exceed 20% for samples with a low d50.
For the simple classes (Fig. 6), the relative difference was significant (>20%) when the proportion was lower than 70% and 80% with and without US, respectively, and this difference increased when the proportion decreased and was lower than 25%.
Similar observations were performed for the detailed class (Fig. 7), the relative difference decreased as the proportion increased, but remained mostly higher than 20% whatever the proportion and the US. Therefore, since multimodality was characterized in most cases, detailed classes should be used to describe the trend of the PSD rather than comparing results from different devices on a qualitative basis.
Finally, the Specific Surface Area (SSA) was estimated [52] based on the PSDs of the different references and samples. However, as the proportion of clay was different between the devices, and even non-significant, the SSAs estimated by them were all substantially different from each other. It appeared that this parameter is difficult to reproduce on different devices and cannot be compared directly.
404 405 406 407 408 409 410 411 412 413 414 415 416 417 418 419 420 421 422 423 424 425 426 427
5. CONCLUSION
The tests performed during this study demonstrated that the comparison of particle size measured using different devices can be complicated since differences were observed on certified materials and natural samples. Despite using similar protocols and samples, the results obtained for the selected parameters (d50, simple and detailed classes) were characterized by differences that could be significant. Those differences were directly related to the specificities of the devices, as each device is manufactured differently (water volume, number of laser cells, etc.). In the absence of information on measurement parameters such as US power in J.ml-1 and pump speed, the comparison of PSDs from different studies can be erroneous, even for a similar device. It is therefore better to only compare the trend (such as the modal classes or the presence of these types of particle) rather than the measured proportion. Quantitative comparisons should only be performed if the parameters of the different analyses are known.
Differences in d50 were observed even with CRMs. Deviation from the expected d50 observed on all the lasers presented similar trends, with increases in particle size. Although there were differences in the amplitude of uncertainty, they all estimated the d50 for particle-sizes above 10pm within 10% uncertainty. However, for samples mostly characterized by clay and fine silt particles, the d50 was overestimated. This is important, especially for natural samples where these fractions are often present. Indeed, this information is required in numerous studies. Moreover, on natural sediments mixed with clay silts and sands, the problem of sand is not trivial. Sand is often not seen in these cases when clay size particles are present in quantity. Sieving sediments to remove the sand might be a solution to eliminate the impact of coarse particles.
For the different classes, the main problem observed concerned the position of the modes. Displaying the distribution of the classes greatly depends on the classification chosen relative to the sediment grain size distribution. It is therefore crucial to define the localization of the modes before
428 429 430 431 432 433 434 435 436 437 438 439 440 441 442 443 444 445 446 447 448
conducting a comparison with results from different devices. Significant différences can be observed in samples characterized by a PSD with modes between two classes (clay/silt, silt/sand or detailed classes).
ACKNOWLEDGEMENTS
We gratefully acknowledge the following colleagues: Maxime Darbot, Marina Launay, Marie Courtel, Stéphanie Gairoard and Brice Mourier for sample preparation and PSD analysis.
Funding
This study was supported by the Rhône Sediment Observatory (OSR), a multi-partner research program partly funded by the Plan Rhône, and by the European Regional Development Fund (ERDF) allocated by the European Union.
Compliance with ethical standards
Conflict of interest
On behalf of all authors, the corresponding author states that there is no conflict of interest.
REFERENCE
[1] Walling DE, Fang D. Recent trends in the suspended sediment loads of the world's rivers. Glob Planet Change 2003;39:111-26. doi:10.1016/S0921-8181(03)00020-1.
[2] Frings RM, Ten Brinke WBM. Ten reasons to set up sediment budgets for river management. Int J River Basin Manag 2018;16:35-40. doi:10.1080/15715124.2017.1345916.
[3] SedNet. Moving Sediment Management Forward. The Four SedNet Messages. 2014:16 pp. https://sednet.org/download/Moving-Sediment-Management-Forward.pdf (accessed January 22, 2019).
449 450 451 452 453 454 455 456 457 458 459 460 461 462 463 464 465 466 467 468 469 470 471 472 473
[4] Wills BA, Napier-Munn T. Wills' Minerai Processing Technology. Wills' Miner Process Technol 2005:267-352. doi:10.1016/B978-075064450-1/50014-X.
[5] Bieganowski A, Ryzak M, Sochan A, Barna G, Hernadi H, Beczek M, et al. Laser Diffractometry in the Measurements of Soil and Sediment Particle Size Distribution. Adv Agron 2018;151:215-79. doi:10.1016/bs.agron.2018.04.003.
[6] Syvitski JPM. Principles, Methods and Application of Particle Size Analysis. Cambridge University Press; 1991.
[7] Merkus HG. Particle Size Measurements - Fundamentals, Practice , Quality. Springer S. Springer Netherlands; 2009. doi:10.1007/978-1-4020-9015-8.
[8] GOOSSENS D. Techniques to measure grain-size distributions of loamy sediments: a comparative study of ten instruments for wet analysis. Sedimentology 2007;55:070921101149001-??? doi:10.1111/j.1365-3091.2007.00893.x.
[9] Di Stefano C, Ferro V, Mirabile S. Comparison between grain-size analyses using laser diffraction
and sedimentation methods. Biosyst Eng 2010;106:205-15.
doi:10.1016/j.biosystemseng.2010.03.013.
[10] Loizeau J -L, Arbouille D, Santiago S, Vernet J -P. Evaluation of a wide range laser diffraction grain size analyser for use with sediments. Sedimentology 1994;41:353-61. doi:10.1111/j.1365-3091.1994.tb01410.x.
[11] Arvaniti EC, Juenger MCG, Bernal S a., Duchesne J, Courard L, Leroy S, et al. Determination of particle size, surface area, and shape of supplementary cementitious materials by different techniques. Mater Struct 2014;48:3687-701. doi:10.1617/s11527-014-0431-3.
[12] Agrawal YC, Whitmire A, Mikkelsen OA, Pottsmith HC. Light scattering by random shaped particles and consequences on measuring suspended sediments by laser diffraction. J Geophys Res Ocean 2008;113:1-11. doi:10.1029/2007JC004403.
mid-474 475 476 477 478 479 480 481 482 483 484 485 486 487 488 489 490 491 492 493 494 495 496 497 498
Holocene estuarine silts, Welsh Severn Estuary (UK): coastal change, sea level and climate. Quat Sci Rev 2006;25:1418-46. doi:10.1016/j.quascirev.2005.12.009.
[14] Bassetti MA, Berné S, Jouet G, Taviani M, Dennielou B, Flores JA, et al. The 100-ka and rapid sea level changes recorded by prograding shelf sand bodies in the Gulf of Lions (western Mediterranean Sea). Geochemistry, Geophys Geosystems 2008;9. doi:10.1029/2007GC001854. [15] McCave IN, Thornalley DJR, Hall IR. Relation of sortable silt grain-size to deep-sea current
speeds: Calibration of the "Mud Current Meter." Deep Res Part I Oceanogr Res Pap 2017; 127:1- 12. doi:10.1016/j.dsr.2017.07.003.
[16] Ghilardi M, Psomiadis D, Andrieu-Ponel V, Colleu M, Sotiropoulos P, Longo F, et al. First evidence of a lake at Ancient Phaistos (Messara Plain, South-Central Crete, Greece): Reconstructing paleoenvironments and differentiating the roles of human land-use and paleoclimate from Minoan to Roman times. Holocene 2018;28:1225-44. doi:10.1177/0959683618771473.
[17] Giaime M, Avnaim-Katav S, Morhange C, Marriner N, Rostek F, Porotov A V., et al. Evolution of Taman Peninsula's ancient Bosphorus channels, south-west Russia: Deltaic progradation and Greek colonisation. J Archaeol Sci Reports 2016;5:327-35. doi:10.1016/j.jasrep.2015.11.026. [18] Ghilardi M, Psomiadis D, Cordier S, Delanghe-Sabatier D, Demory F, Hamidi F, et al. The impact
of rapid early- to mid-Holocene palaeoenvironmental changes on Neolithic settlement at Nea Nikomideia, Thessaloniki Plain, Greece. Quat Int 2012;266:47-61. doi:10.1016/j.quaint.2010.12.016.
[19] Laceby JP, Evrard O, Smith HG, Blake WH, Olley JM, Minella JPG, et al. The challenges and opportunities of addressing particle size effects in sediment source fingerprinting: A review. Earth-Science Rev 2017;169:85-103. doi:10.1016/j.earscirev.2017.04.009.
[20] Pye K, Blott SJ. Particle size analysis of sediments, soils and related particulate materials for forensic purposes using laser granulometry. Forensic Sci Int 2004;144:19-27.
499 500 501 502 503 504 505 506 507 508 509 510 511 512 513 514 515 516 517 518 519 520 521 522 523 doi:10.1016/j.forsciint.2004.02.028.
[21] Konert M, Vandenberghe J. Comparison of laser grain size analysis with pipette and sieve analysis: a solution fo rthe underestimation of the clay fraction. Sedimentology 1997,'44:523- 35.
[22] Jonasz M, Fournier GR. Light Scattering by Particles in Water: Theoretical and Experimental Foundations. Elsevier/Academic Press; 2007. doi:10.1016/B978-0-12-388751-1.X5000-5. [23] Lu Y, Riyanto N, Weavers LK. Sonolysis of synthetic sediment particles: Particle characteristics
affecting particle dissolution and size reduction. Ultrason Sonochem 2002;9:181-8. doi:10.1016/S1350-4177(02)00076-7.
[24] Mikutta R, Kleber M, Kaiser K, Jahn R. Review : Organic Matter Removal from Soils using Hydrogen Peroxide , Sodium Hypochlorite, and Disodium Peroxodisulfate. Soil Sci Soc Am J 2005,'69:120. doi:10.2136/sssaj2005.0120.
[25] Folk RL. a Review of Grain-Size Parameters. Sedimentology 1966;6:73-93. doi:10.1111/j.1365- 3091.1966.tb01572.x.
[26] Blott SJ, Pye K. Particle size scales and classification of sediment types based on particle size distributions: Review and recommended procedures. Sedimentology 2012;59:2071-96. doi:10.1111/j.1365-3091.2012.01335.x.
[27] Roberson S, Weltje GJ. Inter-instrument comparison of particle-size analysers. Sedimentology 2014;61:1157-74. doi:10.1111/sed.12093.
[28] Beierle BD, Lamoureux SF, Cockburn JMH, Spooner I. A new method for visualizing sediment particle size distributions. J Paleolimnol 2002;27:279-83. doi:10.1023/A:1014209120642. [29] Visher GS. Grain Size Distributions and Depositional Processes. J Sediment Petrol
1969;39:1074-106. doi:10.1306/74D71D9D-2B21-11D7-8648000102C1865D.
[30] Gardner WR. Representation of Soil Aggregate-Size Distribution by a Logarithmic-Normal Distribution. Soil Sci 1956:12-4. doi:10.1002/hep.23592.
524 525 526 527 528 529 530 531 532 533 534 535 536 537 538 539 540 541 542 543 544 545 546 547 548
[31] Fredlund MD, Fredlund DG, Wilson GW. An équation to represent grain-size distribution. Can Geotech J 2000;37:817-27. doi:10.1139/t02-080.
[32] Lee BJ, Fettweis M, Toorman E, Molz FJ. Multimodality of a particle size distribution of cohesive suspended particulate matters in a coastal zone. J Geophys Res Ocean 2012;117. doi:10.1029/2011JC007552.
[33] Sadeghi SH, Singh VP, Kiani-Harchegani M, Asadi H. Analysis of sediment rating loops and particle size distributions to characterize sediment source at mid-sized plot scale. Catena 2018;167:221-7. doi:10.1016/j.catena.2018.05.002.
[34] Ding W, Huang C. Effects of soil surface roughness on interrill erosion processes and sediment particle size distribution. Geomorphology 2017;295:801-10. doi:10.1016/j.geomorph.2017.08.033.
[35] Zhang Y, Sangster JL, Gauza L, Bartelt-Hunt SL. Impact of sediment particle size on biotransformation of 17P-estradiol and 17P-trenbolone. Sci Total Environ 2016;572:207-15. doi:10.1016/j.scitotenv.2016.08.004.
[36] Sadaoui M, Ludwig W, Bourrin F, Raimbault P. Controls , budgets and variability of riverine sediment fluxes to the Gulf of Lions (NW Mediterranean Sea). J Hydrol 2016;540:1002-15. doi:10.1016/j.jhydrol.2016.07.012.
[37] Poulier G, Launay M, Le Bescond C, Thollet F, Coquery M. Combining flux monitoring and estimation to establish annual budgets of suspended particulate matter and associated pollutants in the Rhône River from Lake Geneva to the Mediterranean Sea. Sci Total Environ 2019;658:457-73. doi:10.1016/J.SCITOTENV.2018.12.075.
[38] Masson M, Angot H, Le Bescond C, Launay M, Dabrin A, Miège C, et al. Sampling of suspended particulate matter using particle traps in the Rhône River: Relevance and representativeness for the monitoring of contaminants. Sci Total Environ 2018;637-638:538-49. doi:10.1016/j.scitotenv.2018.04.343.
549 550 551 552 553 554 555 556 557 558 559 560 561 562 563 564 565 566 567 568 569 570 571 572 573
[39] Institute for Reference Materials and Measurements. Certified reference materials BCR-066. 2007.
[40] Institute for Reference Materials and Measurements. Certified Reference Material BCR-067. 2007.
[41] Kaiser D, Watters RL. Standard Reference Material® 1003c. Natl Inst Stand Technol 2011. [42] Slomberg DL, Ollivier P, Radakovitch O, Baran N, Sani-Kast N, Miche H, et al. Characterisation of
suspended particulate matter in the Rhone River: Insights into analogue selection. Environ Chem 2016;13:804-15. doi:10.1071/EN15065.
[43] Santiago S, Thomas RL, McCarthy L, Loizeau JL, Larbaigt G, Corvi C, et al. Particle Size Characteristics of Suspended and Bed Sediments in the Rhone River. Hydrol Process 1992;6:227-40. doi:10.1002/hyp.3360060210.
[44] USDA. Soil Survey Manual. Handbook18. Washington, D.C.: Government Printing Office; 2017. doi:10.1097/00010694-195112000-00022.
[45] Doeglas DJ. Grain-Size Indices, Classification and Environment. Sedimentology 1968;10:83-100. doi:10.1111/j.1365-3091.1968.tb01101.x.
[46] Xi H, Larouche P, Tang S, Michel C. Characterization and variability of particle size distributions in Hudson Bay, Canada. J Geophys Res Ocean 2014;119:3392-406. doi:10.1002/2013JC009542. [47] Mikkelsen OA, Pejrup M. The use of a LISST-100 laser particle sizer for in-situ estimates of floc
size, density and settling velocity. Geo-Marine Lett 2001;20:187-95. doi:10.1007/s003670100064.
[48] Many G, Bourrin F, Durrieu de Madron X, Pairaud I, Gangloff A, Doxaran D, et al. Particle assemblage characterization in the Rhone River ROFI. J Mar Syst 2016;157:39-51. doi:10.1016/j.jmarsys.2015.12.010.
[49] Andrews S, Nover D, Schladow SG. Using laser diffraction data to obtain accurate particle size distributions: The role of particle composition. Limnol Oceanogr Methods 2010;8:507-26.
574 575 576 577 578 579 580 581 582 583 584 doi:10.4319/lom.2010.8.507.
[50] Yang XM, Drury CF, Reynolds WD, MacTavish DC. Use of sonication to determine the size distributions of soil particles and organic matter. Can J Soil Sci 2009;89:413-9. doi:10.4141/cjss08063.
[51] Jouon A, Ouillon S, Douillet P, Lefebvre JP, Fernandez JM, Mari X, et al. Spatio-temporal variability in suspended particulate matter concentration and the role of aggregation on size distribution in a coral reef lagoon. Mar Geol 2008;256:36-48. doi:10.1016/j.margeo.2008.09.008.
[52] Santamarina JC, Klein K a, Wang YH, Prencke E. Specific surface: determination and relevance. Can Geotech J 2002;39:233-41. doi:10.1139/t01-077.
Table 1: Main parameters of the grain size analyzers used within the OSR. n.a. not available.
Main characteristics of the devices
Brand Cilas Beckman Coulter Malvern Sequoia
Model 1190L LS 13 320 Mastersizer 2000 LISST-Portable|XR
Range of measured size (|am) 0.04 - 2500 0.04 - 2000 0.02 - 2000 0.34 - 500
Number of channels 100 132 100 33
Max. volume of the vessel (mL) 450 1000 1000 117
Main parameters set for analysis
Ultrasonic use 30s before during analysis during analysis 30s before analysis and during analysis
Type of liquid and dispersant deionized water tap water tap water deionized water without dispersant without dispersant without dispersant without dispersant
Duration of a single measurement 60 s 60 s 10 s 60 s
Optical model Mie Mie+Fraunhofer* Mie Mie
Refractive index 1,55 1,5 1,57 1,54
Absorption coefficient 0,1 0,0 0,1 0,1
Ultrasound sonication power 50% 6 on scale of 8 levels
100% 30%
Stirrer speed 150 RPM n.a. 1000 RPM n.a.
Pump speed 120 RPM 80-90% 2500 RPM 20-25%
Obscuration (Obs)
or Optical Transmission (OT)
Obs: 5 - 25% Obs: 8-16% Obs: 5 - 25% OT: 0.75 - 0.95
Table 2 - Mean D50 (^m) and standard déviation determined by the devices without US. n.a. not available.
BCR66 BCR67 SRM1003C Mix_A Mix_B Mix_C Certified range (^m) 0.35 - 3.5 2.4 - 32 25 - 50 n.a. n.a. n.a. Certified D50 (^m) 1.13 10.41 32.1 ± 1.0 n.a. n.a. n.a. Cilas 1.2 ± 0.1 12.4 ± 0.1 32.6 ± 0.8 11.5 ± 0.1 4.2 ± 0.4 11.4 ± 0.5 Coulter 1.5 ± 0.1 11.3 ± 0.1 31.6 ± 0.1 8.9 ± 0.5 1.8 ± 0.1 4.6 ± 2.3 Malvern 1.9 ± 0.1 12.3 ± 0.1 31.9 ± 0.1 10.1 ± 0.1 3.0 ± 0.1 8.9 ± 0.1 Portable C 1.9 ± 0.1 11.8 ± 0.4 32.6 ± 0.6 9.3 ± 0.1 2.8 ± 0.1 5.9 ± 0.7
Table 3 - Mean proportion (%) and standard déviation of the simple classes measured by the four devices on the natural samples with and without US. n.d. not detected; n.a. not analyzed.
Barcarin Jons Azergues Arc
Devices US Clay Silt Sand Clay Silt Sand Clay Silt Sand Clay Silt Sand Cilas without 8.8 ± 1.3 90.3 ± 0.8 0.5 ± 0.5 3.2 ± 0.4 69.2 ± 0.4 27.4 ± 0.9 2.0 ± 0.1 51.3 ± 0.7 47 ± 0.9 0.7 ± 0.1 1.0 ± 0.1 98.3 ± 0.5 Cilas with 9.8 ± 2.1 90.0 ± 1.9 0.2 ± 0.4 4.4 ± 0.5 78.3 ± 1.6 17.1 ± 1.5 3.0 ± 0.1 87.6 ± 0.7 9.4 ± 1 1.0 ± 0.1 6.4 ± 2.0 92.8 ± 1.9 Coulter without 21.6 ± 0.9 78.0 ± 0.7 0.4 ± 0.5 8.0 ± 0.1 64.8 ± 1.0 27.3 ± 1.0 2.0 ± 0.1 49.0 ± 1.5 49.4 ± 1.4 0.7 ± 0.5 13.0 ± 8.1 86.3 ± 8.6 Coulter with n.a. n.a. n.a. 10.7 ± 1.2 67.3 ± 3.8 21.7 ± 5.0 2.0 ± 0.1 55.3 ± 1.1 42.7 ± 1.1 0.7 ± 0.5 14.2 ± 8.4 84.9 ± 8.8 Malvern without n.a. n.a. n.a. n.a. n.a. n.a. 1.7 ± 0.5 44.2 ± 2.1 54 ± 2.2 n.d. n.d. 100.0 ± 0.1 Malvern with n.a. n.a. n.a. n.a. n.a. n.a. 2.8 ± 0.4 62.3 ± 3.9 34.9 ± 4.3 n.d. 0.4 ± 0.9 99.6 ± 0.9 Portable_ C without 11.0 ± 1.4 87.5 ± 0.7 1.5 ± 2.1 3.0 ± 0.1 74.0 ± 2.8 23.0 ± 2.8 2.1 ± 0.6 72.6 ± 9.9 25.1 ± 10.7 0.3 ± 0.1 9.6 ± 1.0 90.0 ± 1.0 Portable C with n.a. n.a. n.a. 7.0 ± 0.1 89.3 ± 2.1 3.3 ± 3.2 4.2 ± 0.4 89.4 ± 1.7 6.4 ± 2.1 0.7 ± 0.8 15.4 ± 11.8 83.9 ± 12.3
Table 4 - Mean D50 (|im) and standard déviation measured by the four devices on the natural samples with and without US. n.a. not analyzed.
Devices US Barcarin Jons Azergues Arc
Cilas without 9.9 ± 0.5 34.6 ± 1.0 57.0 ± 1.3 194.1 ± 3.6
Cilas with 9.2 ± 0.7 25.0 ± 1.3 23.1 ± 1.1 179.3 ± 5.3
Coulter without 6.2 ± 0.4 28.2 ± 0.7 61.1 ± 2.8 146.6 ± 20.0
Coulter with n.a. 21.9 ± 3.7 49.7 ± 1.3 145.9 ± 20.5
Malvern without n.a. n.a. 71.6 ± 5.8 171.9 ± 1.6
Malvern with n.a. n.a. 40.0 ± 5.4 171.5 ± 2.1
Portable_C without 7.9 ± 1.0 35.4 ± 0.2 37.9 ± 9.1 143.9 ± 20.1
Fig.1 Proportion of the detailed classes measured with US by the different devices (Cilas, Coulter, Malvern and Portable corrected) on the CRMs (BCR-066, BCR-067 and SRM1003c) and the different mixtures (A, B and C). Certified proportions are also presented (Reference). Values over the bar represents the percentage of the proportion
Fig.2 Detailed classes measured by the different devices on the natural samples with and without US. Values over the bar represent the percentage of the proportion. No measures were conducted on the Malvern for Barcarin and Jons samples
Fig.3 d50 measured by the different devices on the mixtures of Arc and Azergues samples
Fig.4 Detailed classes measured by the different devices on mixture 2 with and without US. Values over the bar represent the percentage of the proportion
Fig.5 Relative difference between the mean d50 measured by all the devices and the mean d50 measured by each device with and without US. Grey areas represent 10% and 20% difference
Fig.6 Relative differences between the mean proportion of each simple class measured by all the devices and the mean proportion measured by each device with and without US. Grey areas represent 10% and 20% difference. Abscise represent the mean proportion of the associated simple class for all devices
Fig.7 Relative differences between the mean proportion of each detailed class measured by all the devices and the mean proportion measured by each device with and without US. Grey areas represent
100% 50% (/> 0% 100% ~o 14 70 87 53 58 23 24 37 33 13 3 66 7 0 00110 00200 00100 00000 0) 50% 0% 100% 0) 50% 4 6 5 5 0 4 6 4 8 3 16 19 17 20 27 40 39 39 38 —31 27 30 17 4 3 5__5 0 0 0 0 0 0 O (0 0) 4— O 0% 41 41 47 46 45 49 52 52 38 55 O C M O C O C O 0 10 10 0 10 10
0
"
1
0
C O C M 5 0 1 6 0 ___ 14 20 17 19 8 12 12 14 13 14 13 14 _30 26 26 26 28 24 25 22 ---!-- 1---1---1 1---11^^ 7 4 0 0 4 0 0 0 0 M ix _ A I--- I 1________1111 1 ---1---1---1---1 1 § 100% 50% 0% 100% û_ 50% 0% 54 35 35 39 Z ^■25 22B23 10 ^ 17 ^ 10 ^ 12 20 4 13 14 ^8 15 11 3 0 6 1 0 0 0 0 CD 21 34 ■ I A 0000 OClay V_F_Silt F_Silt
M_Silt C_Silt V_C_Silt V_F_Sand
100% 50% 0% 100% (/> JS 50% O -O 0% 100% 22 11 12 15 17 18 21 24 30 21 24___19 15 i4 10 5 7 001 000 000 000 383 4 5 6 6 9 8 14 13 12 20 17 19 26 20 22 17 20 5 10 2 0 0 0 0 0 0
(0
50% 0% 100% 50% (0 0% 'g 100% 50% O 0% 100% Q. 50% û_ 0% 100% 50% 0% 11 7 6 7 12 8 11 16 17 14 18 21 18 23 25 18 _20 16 14 3 11 7 0 0 0 0 0 0 07 2 2 2 2 2 2 2 4 4 4 4 7 9 8 8 13 l^lil^?1—2liii8r27 22 22 22 19 16 16 17 5 9 8 11 Q 0340 CD CO £= CD C/) 11 19 11 19 4°16 19^4 4^22 23 24 21 17 ^ 12 3234 4 3 3 7 85 6 41 10 H 16 9 6 0 ZAZ 0 0760 0230 CD CQ d CD (/> 57 63 0100 0101 0101 0201 0302 150505 20 22 21 34 4 ^ en zz -32 7 16 8 10 0 0 1101 0101 1 0 2 3 0 A 2 4 0 A 2 5 0 , -T f21 22 20 34 42 56 63 æ 43 29 7 16 6 10 0 0Clay V_F_Silt F_Silt M_Silt C_Silt V_C_Silt V_F_Sand F_Sand M_Sand C_Sand
990
60
m û
30
Cilas
Coulter
Malvern
Portable C
O
O
O
O
O
O *
O
K
>
H
H
Z
H
1-0
-1
i-E
H
1
-0
-1
O
1
-0
-1
□
°
**
*
□
□
□
□
□
□
□
o
D
O
O
\ q,\ q,
\ q,
\ q,
P
ro
p
o
rt
io
n
o
f
e
a
c
h
d
e
ta
il
le
d
c
la
s
1 9 7 2 3 1 1 2 ---- 2 2 ---- 3=c 20 16 3 14 3 11 4ÛJ[ 25 21 19 J 23 22 â 24 24 *:l 3 L 19 — 1 11 7^8 3 3 2 4 4 4 3 5 29 26 19 20 tl 25 24 22 22 H 19 13 10 10 2 ___ 5 0 8 4 2 0 0 0Fi gu re 5 C lic k he re to
D
e
v
ic
e
s
:
OC
il
as
O C o u $ fô ie s g ÿ d o \M fe )| ¥ è iF rf e u i© ;F if i i(%) aouajajjip aApeiay
M
e
a
n
D
5
0
(p
m
)
200 100 0 ■100 200 100 0 ■100
£
<> OO O□ n
=k> =■=Se
0 25 50 75Proportion (%)
W
it
h
o
u
t
s
o
n
ic
a
tio
n
W
ith
s
o
n
ic
a
tio
n
R
e
la
ti
v
e
d
if
fé
re
n
c
e
(%
)
O F Silt O VC Silt O M Sand
0