HAL Id: hal-03264342
https://hal.archives-ouvertes.fr/hal-03264342
Submitted on 18 Jun 2021
HAL is a multi-disciplinary open access
archive for the deposit and dissemination of
sci-entific research documents, whether they are
pub-lished or not. The documents may come from
teaching and research institutions in France or
abroad, or from public or private research centers.
L’archive ouverte pluridisciplinaire HAL, est
destinée au dépôt et à la diffusion de documents
scientifiques de niveau recherche, publiés ou non,
émanant des établissements d’enseignement et de
recherche français ou étrangers, des laboratoires
publics ou privés.
Tentative fMRI signatures of perceptual echoes in early
visual cortex
Canhuang Luo, Sasskia Brüers, Isabelle Berry, Rufin Vanrullen, Leila Reddy
To cite this version:
Canhuang Luo, Sasskia Brüers, Isabelle Berry, Rufin Vanrullen, Leila Reddy. Tentative fMRI
sig-natures of perceptual echoes in early visual cortex. NeuroImage, Elsevier, 2021, 237, pp.118053.
�10.1016/j.neuroimage.2021.118053�. �hal-03264342�
ContentslistsavailableatScienceDirect
NeuroImage
journalhomepage:www.elsevier.com/locate/neuroimage
Tentative
fMRI
signatures
of
perceptual
echoes
in
early
visual
cortex
Canhuang
Luo
a,b,1,
Sasskia
Brüers
a,b,1,
Isabelle
Berry
a,b,c,
Rufin
VanRullen
a,b,
Leila
Reddy
a,b,∗a Université de Toulouse, Centre de Recherche Cerveau et Cognition, Université Paul Sabatier, 31062, Toulouse, France
b Centre National de la Recherche Scientifique, Unité Mixte de Recherche 5549, Faculté de Médecine de Purpan, 31052, Toulouse Cedex, France c Toulouse NeuroImaging Center, INSERM, U825, Toulouse, France
a
r
t
i
c
l
e
i
n
f
o
Keywords: Perceptual echo Alpha EEG fMRI Oscillation Traveling wavea
b
s
t
r
a
c
t
ThevisualImpulseResponseFunction(IRF)canbeestimatedbycross-correlatingrandomluminancesequences withconcurrentlyrecordedEEG.Ittypicallycontainsastrong10Hzoscillatorycomponent,suggestingthatvisual informationreverberatesinthehumanbrainasa“perceptualecho”.Theneuraloriginoftheseechoesremains unknown.Toaddressthisquestion,werecordedEEGandfMRIintwoseparatesessions.Inbothsessions,adisk whoseluminancefollowedarandom(whitenoise)sequencewaspresentedintheupperleftquadrant. Individ-ualIRFswerederivedfromtheEEGsession.TheseIRFswerethenusedas“responsetemplates” toreconstruct anestimateoftheEEGduringthefMRIsession,byconvolutionwiththecorrespondingrandomluminance se-quences.The7–14Hz(alpha,themainfrequencycomponentoftheIRF)envelopeofthereconstructedEEGwas finallyusedasanfMRIregressor,todeterminewhichbrainvoxelsco-variedwiththeoscillationselicitedbythe luminancesequence,i.e.,the“perceptualechoes”.ThereconstructedenvelopeofEEGalphawassignificantly correlatedwithBOLDresponsesinV1andV2.Surprisingly,thiscorrelationwasvisibleoutside,butnotwithin thedirectly(retinotopically)stimulatedregion.WetentativelyinterpretthislackofalphamodulationasaBOLD saturationeffect,sincetheoverallstimulus-inducedBOLDresponsewasinverselyrelated,acrossvoxels,tothe signalvariabilityovertime.Inconclusion,ourresultssuggestthatperceptualechoesoriginateinearlyvisual cortex,drivenbywidespreadactivityinV1andV2,notretinotopicallyrestricted,butpossiblyreflectingthe propagationofatravellingalphawave.
1. Introduction
Visualinformationis notfleeting, butinstead“echoes” inour vi-sualsysteminanoscillatoryfashion(VanRullenandMacdonald,2012). Whensubjectsarepresentedwithrandomluminancesequences(white noise,WN)while concurrentlyrecordingtheelectroencephalography (EEG)signal,animpulseresponsefunction(IRF)canbecalculatedby cross-correlatingtheWNsequenceswiththecorresponding EEG.The resultingIRFcontainsastrong∼10Hzcomponentthatcanlastupto onesecond,suggestingthatthebrainprocessesandcarriesvisual in-formationovertimeat∼10Hz.Thisphenomenonhasbeencalledthe “perceptualecho” (IlhanandVanRullen,2012;VanRullenand Macdon-ald,2012).
TheIRFishighlycorrelatedwithresting-stateandongoingEEG al-phainbothamplitudeandfrequency,andbothsignalsaremost promi-nent inposterior regions (VanRullen andMacdonald, 2012).Despite thefactthattheyshare thesamefrequencyrangeandtopographical location,thealpha-bandEEGsignalinresponsetotheWNsequences (IRF or “perceptual echo”) does not necessarily correspond to the
∗Correspondingauthor.
E-mailaddress:[email protected](L.Reddy). 1 Equalcontribution
ongoingEEGalphaactivity;infact,thetwosignalscanevensometimes bedissociatedandthereareimportantfunctionaldifferencesbetween them.Ongoingalphaactivityhaslongbeenconsideredtoplayan in-hibitoryroleinsensoryareas(BonnefondandJensen,2012;Jensenand Mazaheri,2010;KizukandMathewson,2017; Klimeschetal.,2002; SadaghianiandKleinschmidt,2016),whilsttheIRFsuggeststhatthe vi-sualsystemactivelyprocessesandretainsinformationovertime(Ilhan andVanRullen,2012;VanRullenandMacDonald,2012).Forinstance, inaspatialattentiontask,contralateralalphaamplitudedecreasedwhen subjectsattendedtotheleftorrightsideofthescreen,whileonthe con-trarytheIRFwasenhancedbycontralateralattention(VanRullenand MacDonald,2012).
TheIRFhasbeenassociatedwithvariousvisualphenomena.For in-stance,theIRFisthoughttoplayaroleinthetripleflashillusion:when subjectsarepresentedwithtwoflashesinsuccession,theysometimes report seeinga thirdflash(Bowen,1989).Thisillusion couldbe ex-plainedasthesuperpositionofoscillatoryimpulseresponsefunctions tothe twovisual flashes, comingin alignment tocreate athird (il-lusory)percept(Bowen,1989;Gulbinaite,İlhan,&VanRullen,2017).
https://doi.org/10.1016/j.neuroimage.2021.118053.
Received9August2020;Receivedinrevisedform4March2021;Accepted27March2021 Availableonline28April2021.
C. Luo, S. Brüers, I. Berry et al. NeuroImage 237 (2021) 118053
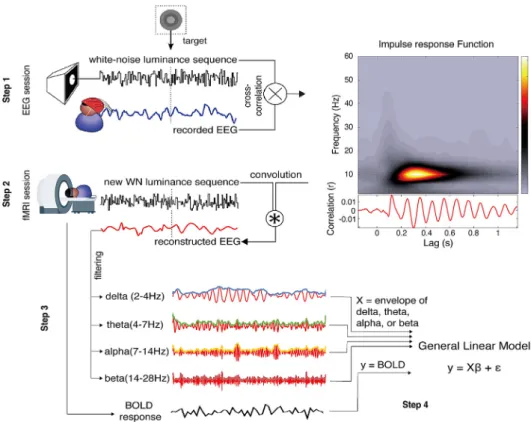
Fig.1. Datacollectingandprocessingsteps. Step 1) In the EEG session, we recorded EEGsignalsandcomputedtheIRFby cross-correlatingtheEEGandtheWNluminance se-quences.TheIRFtimefrequencytransform(on channelPOz)averagedacrosssubjects,andthe IRF ofone representativesubjectareshown ontherightofthefigure.Step2)We recon-structedanestimateofEEGsignalsduringthe fMRIsessionbyconvolvingthisIRFwiththe WNluminancesequencesusedintheMRI scan-ner.BOLDfMRI signals werealsorecorded. Step3)WefilteredthereconstructedEEGinto fourfrequencybands.Step4)Finally,weused theenvelopesofthefilteredEEGasBOLD re-gressorsfortheGLM.(Forinterpretationofthe referencestocolourinthisfigurelegend,the readerisreferredtothewebversionofthis ar-ticle.)
InadditiontothetemporaldimensionoftheIRF,recentstudiesfrom our grouphave investigated its spatialdimension. Lozano-Soldevilla andVanRullen(2019)showedthattheIRFpropagatesfromoccipital tofrontalareasasatravellingwavewhenWNsequencesarepresented intheuppervisualfield.AlamiaandVanRullen(2019)further demon-stratedthatwhenthereisvisualinput,boththeIRFandthealpha prop-agatefromposteriorchannelstofrontalchannels,whereaswhen sub-jectsclosetheireyes,thealphatravelsin theoppositedirection.The forwardandthebackwardpropagationshavebeenpostulated(Alamia andVanRullen,2019)torepresentfeedforwardandfeedbacksignalsin theframeworkofpredictivecoding(RaoandBallard,1999).However, despitethisprogressinunderstandingthespatialpropagationoftheIRF underdifferentconditions,itsneuraloriginsremainunknown.Oneof theabovestudies(Lozano-SoldevillaandVanRullen2019)attempted toperformEEGsourcelocalizationoftheIRFtravellingwaves,butthe outcomewasambiguous,i.e.,compatiblewithbothalarge-scale propa-gationacrossmultiplebrainregions,oralocalizedpropagationwithina restrictedregion,e.g.,anoccipitalsulcus.Theaimofthecurrentstudy wastousefMRItoidentifytheneuralsourceoftheIRF.
WeconductedanEEG-fMRIstudytolocalizetheneuralsourceof theIRF(Fig.1).InsteadofconcurrentlyrecordingEEGandfMRI,which oftenleadstoartifactsandspuriouscorrelations(Fellneretal.,2016; Husteretal.,2012),werecordedEEGandfMRIintwoseparatesessions. Inbothsessions, adiskwhose luminance followedarandom (white noise) sequence was presented in the upper left quadrant. Subjects (N=20)detecteda rarenear-thresholdtarget embeddedin thedisk. IndividualIRFswerederivedfromtheEEGsessionbycross-correlating WNsequenceswiththecorrespondingEEGsignal.TheseIRFswerethen usedas“responsetemplates” (BrüersandVanRullen,2017)to recon-structanestimateoftheEEGduringthefMRIsessionbyconvolution withtherandomluminancesequencespresentedinthefMRIsession. Finally,weusedthealphaenvelopeofthereconstructedEEGasfMRI regressorstodeterminewhichbrainvoxelsco-varywiththeoscillations (i.e.,the“perceptualechoes”)elicitedbytheluminancesequence,since alphafrequencyistheprimaryfrequencycomponentoftheIRF.Ina sec-ondstep,weinvestigatedotherfrequencybands(delta:2–4Hz,theta:
4–7Hz,beta:14–20Hz).Asdescribedbelow,wefoundthatthe recon-structedenvelopeofEEGalphawassignificantlycorrelatedwithBOLD responsesinV1andV2.Otherfrequencieswerecorrelatedtoalesser extent(delta,theta)ornotatall(beta).
2. Method
2.1. Subjects
22subjects(10females,1lefthanded,agerange20–43,meanage 28.73)tookpartinthestudyafteramedicalinterview,andgiving writ-teninformedconsent.Intotal20subjectscompletedtheexperiment; twosubjectsfailedtocomebackforoneorbothexperimentalsessions afterbeingincluded.TheEEGsessionwassystematicallyconducted be-forethefMRIsession.Ofthe20subjects,14subjectsfinishedthetwo sessionsinoneweek,4subjectsin2weeksandtheremaining2subjects in3weeks.Thisstudywasapprovedbytheethics“Comité deProtection desPersonnesSud-MéditerranéeI” (N°2016-A01937–44).
2.2. Stimuli
InboththeEEGandthefMRIsessions,adisk(subtending2° ofvisual angle)whoseluminancefollowedarandom(whitenoise)sequencewas presentedonablackscreen,intheupperleftquadrant,at5° ofvisual anglefromfixation.Weusedasmallervisualstimulusthaninour pre-viousstudies(VanRullenandMacdonald,2012;IlhanandVanRullen, 2012;BrüersandVanRullen,2017;Lozano-SoldevillaandVanRullen, 2019; Alamia and VanRullen, 2019) because in pilot experiments we noticedwidespreadreflectionsofthedisplaylightontotheinner surfaceoftheMRIscannerbore,whichresultedindiffuseratherthan localized stimulation. Thesmallersizeof 2° allowedustominimize thisreflectionartifact.PsychToolbox(Kleineretal.,2007)forMATLAB (MathWorks,Natick,MA)wasusedtodisplaytheWNsequences. Sub-jectswererequiredtofixatethecenterofthescreen duringthetask anddetectanearthresholdlighterdisk(i.e.,atarget)surroundedby 2
adarkerannulus.Thistargetdisklasted1frameandwasembeddedin thewhite-noisedisk.Thefixationpointwas0.1° ofvisualangle.
Usingastaircaseprocedureonthefirst100targetspresented(i.e., about30trials),wemanipulatedthevisibilityofthetargetsbychanging thecontrastbetweentheouter(darkerannulus)andinner(lighterdisk) partstoachieveacontrastatwhich subjectsperceivedthetargeton about50%oftrials.Theresultingcontrast waskeptconstantforthe remainderofthesession.Theperceptualthresholdwascomputedfor eachsessionindependentlyusingthequestfunction(PelliandWatson, 1983).
Becauseofdifferencesincomputersetup,thestimulipresentedin theEEGandthefMRIrecordingsessionswerenotidenticalintermsof temporalfrequency.IntheEEGsession,theCRTmonitorhadarefresh rateof160Hz,givingtheWNsequencesaflatpowerspectrumbetween 0and80Hz.DuringthefMRIsession,theprojectorusedhada maxi-mumpresentationrateof60Hz,whichmeanttheWNsequenceshada flatpowerspectrumbetween0and30Hz(stillwellabovethetemporal resolutionoftheBOLDactivity).Themaximalluminanceofthe stimu-luswas114.7cd/m2intheEEGsession,and827.9cd/m2inthefMRI
session.
2.3. Experimentalprotocol
EachsubjectcompletedoneEEGandonefMRIsession(Fig.1,step 1and2).TheEEGsessionwascomposedof8runsof48WNsequences, eachsequencelasting6.25s.ThefMRIsessionconsistedof12runs.Each runwascomposedof7randomluminancesequences,eachlasting30s, withaninter-trial-intervalof12s.
2.4. EEGrecording,preprocessing,extractionofIRFandregressors
DuringtheEEGsession, theEEG signalwasrecordedusing a 64-channelBioSemiEEGsystemwith4extraocularelectrodesmonitoring thehorizontalandverticaloculograms.Signalsweredigitizedata sam-plingrateof1024Hz.
EEG pre-processing was performed using the EEGLAB toolbox (Delorme&Makeig,2004)andcustomizedMatlabscripts.Bad chan-nelswereinterpolatedwhenneeded.EEGdataweredown-sampledto 160Hztofacilitatethecross-correlationwiththestimuli.Notchfiltering (47∼53Hz)wasappliedtoremoveartifacts.EEGdatawerethen refer-encedtotheaverageandseparatedintoepochsof−0.25sbeforeto6.5s afterthestimulusonset.Baselinecorrectionwasperformedusingthe pre-stimulussignal.Furthermore,epochscontainingocularand move-mentrelatedartifactswererejected.Onaverage6.97%(SD=5.57%)of epochshavebeenexcluded(onaverage353epochsleft)andtheworst subjecthad<20%ofepochsremoved.TheIRFswereextractedbydoing across-correlationbetweenthestandardizedpre-processedEEGepochs andthestandardizedcorrespondingWNsequences(VanRullenand Mac-Donald,2012)(Fig.1,step1).TheIRFwascutfromlags−0.2to1.5s, resultingin1.7slongIRFs.
TheIRFswerethenusedtoreconstructtheEEGsignal correspond-ingtotheWNsequencesinthefMRIsession(Fig.1,step2).Notethat theIRFsarestableovertime,asithasbeenshownthattheycan be reproduced evenafter 6months (VanRullen andMacdonald, 2012). Therefore,theIRFsin thefMRIsessionwereunlikelytobe different fromtheIRFsoftheEEGsession.First,theIRFsweredown-sampled to60Hz tomatchthepresentationrateoftheWNsequences inthe scanner.ThereconstructedEEGwascomputedbyconvolvingtheIRF (from0to1.5s)(fromtheEEGsession)withtheexactWNsequences usedinthefMRIsession.Previous experimentshaveshown thatthis methodcanprovideareliableestimateofEEGactivityinthealpha-band (BrüersandVanRullen,2017).BrüersandVanRullen(2017)adopteda 10-foldcross-validationapproach.Oneachvalidation,theIRFwas com-putedfrom90%trialsandtheremaining10%trialswereusedto recon-structEEG,which wasthencorrelatedwiththerealEEG.Inspiteof thenoisynatureofEEGsignalsandthesingle-triallevelestimation,the
correlationbetweenthereconstructedalphaandtherealalphawasstill compelling(meanr=0.163,t(19)=8.21,p=1.14×10−7,95%CIforr:
0.121–0.204).Becausesignalenvelopeswerestronglycorrelatedacross EEGelectrodes,wedecidedtoonlyuseoneelectrodeforeachsubject. Foreachsubjectandeachfrequencyband,wechosetheelectrodewith maximumIRFpowerinthe“IRFarea” forthatfrequencyband—defined astheelectrodewithstrongestIRFpower,onaverageacrossallsubjects, inthe“late” partoftheIRFwhere“echoes” aretypicallyvisible(from 250msto1250ms),togetherwiththe8surroundingelectrodes.For ex-ample,forthealphaband,the“IRFarea” wascenteredonPOz,and alsoincludedelectrodesP1,PO3,O1,Oz,Pz,P2,PO4,O2.The cen-tralelectrodesforthedelta,thetaandbetabandswereCz,CPzandO1 respectively.
ThereconstructedEEGwasfilteredin4frequencybands:delta=2– 4Hz,theta=4–7,alpha=7–14Hz,beta=14–20Hz(Fig.1,step3).The absolutevalueoftheHilberttransformeddatawastakenasthe enve-lope.ThisenvelopeofthereconstructedEEGsignalwasthenusedas aregressoroftheBOLDactivity(Fig.1,step4).Finally,theregressors were‘clipped’byremoving4satthebeginningand2sattheendofeach trialtoremoveanysystematicfilteringartefacts,whichcouldhaveled tospuriouscorrelations.Theclippinglengthwaslongeratthe begin-ning,inordertoavoidonsettransientsatthebeginningoftheenvelope andatthebeginningoftheBOLDresponse.
2.5. fMRIrecordingandpreprocessing
InthefMRIsession, datawerecollectedin a3TPhilips (Amster-dam,TheNetherlands)ACHIEVAscannerwitha32-channelheadcoil. Highresolutionanatomicalimageswererecordedfromeachsubjectat thebeginningof thescanning:170sagittalsliceswereacquiredwith avoxelsizeof1mm3,arepetitiontime(TR)of8.13ms,andatimeto
echo(TE)of3.7ms.Functionalimageswereacquiredinthetransverse planeusingagradient-echopulsesequence(TE=35ms,TR=2000ms). 39sliceswereacquired(80∗80imagematrix,240∗240FOV,with
3mm3 voxels)tocoverthewholebrain.Dataanalysiswasperformed
with FreeSurfer and the FreeSurfer Functional Analysis Stream (FS-FAST)(http://surfer.nmr.mgh.harvard.edu)andcustomMatlabscripts. Pre-processingfollowedtheFS-FASTprocessingstream.Allimageswere motioncorrected(usingAFNIwithstandardparameters),slice-time cor-rected,intensitynormalizedandsmoothedwitha3-mmfull-widthat halfmaximumGaussiankernel.
2.5.1. ROIdefinition
InafirstanalysisweusedaGLMtodefinefunctionalregionsof in-terest(ROIs)basedonvoxelsthatwereresponsivetothevisual stim-ulus. Two typesof functionalROIs were defined accordingly:group functionalROIsandindividualfunctionalROIs.TheGLMswere per-formedintheFreesurferaveragebrainspacewiththecontrastofvisual stimulationblocksversustheinter-trial-intervalsforeachsubject.The GLMfittedthehemo-dynamicresponse(HRF)withagammafunction (delta=2.25,tau=1.25)andmodeledthedriftwithanorder1 polyno-mial.Atthetimeoftheanalysis,weusedanolderversionoftheFS-FAST software,inwhichthisgammafunctionwasthedefaultmodelfor fit-tingthehemodynamicresponse.Note,however,thatwealsoreplicated ourmainanalysisusingthecanonicalHRF,andtheresultsdidnotshow anysignificantdifference.ForallotherparametersoftheGLMweused thedefaultsettingsfromFS-FAST.
Agroupanalysiswasperformedtodefinesignificantclustersusing thiscontrast.Weusedavoxel-wisepof0.001,andacluster-wisepof 0.0005todefinethevisualclustersatthegrouplevel, withthe clus-terscorrectedformultiplecomparisonsusingMonteCarloSimulation (Hagleretal.,2006).Weusedsuchaconservativecluster-wise thresh-oldatthegrouplevelbecausewewantedtoisolatethevisualcortices preciselyfortheanalysisinthegroupfunctionalROIs.
WealsodefinedthreefunctionalROIsattheindividual-subjectlevel, in rightV1,V2andin rightextrastriateareas outsideofV1andV2.
C. Luo, S. Brüers, I. Berry et al. NeuroImage 237 (2021) 118053 Foreachanatomicalregion,wefoundtheconnectedclustercontaining
themostsignificantvoxels(lowestp-value),thenincreasedthe cluster-formingp-valuethresholdgraduallyuntilapresetnumberofvoxelswas reached.Bydoingthis,weobtainedaROIinV1,withapproximately100 voxels(R1–100).Likewise,weappliedthesamemethodinV2todefine R2–100,andintheareasoutsideofV1andV2todefineR3–100.(See FigureS1fortheresultsofcorrespondingROIswith50and200voxels)
2.5.2. AnalysisofBOLDmodulationbyalphaenvelopeintheROIs
WenextanalyzedwhetherBOLDactivityintheROIswas modu-latedbythealphaenvelope.TodeterminewhichROIsco-variedwith thealphaenvelopeofthereconstructedEEG,weperformedafirst-level GLMforeachsubjectintheFreesurferaveragebrainspace.The am-plitudeenvelopeinthealphabandwasusedasaparametricregressor andmotionparameterswereincludedasnuisanceregressors.TheGLM wasperformedseparatelyfortheseregressors.TheHRFwasmodeledas agammafunction(delay=2.25,tau=1.25)andthedriftwasmodeled withanorder2polynomial.Totestthestatisticalsignificanceofalpha modulationineachROI,weperformedaonesamplet-testusing𝛽
esti-matesofallvoxelsintheROIsdefinedfromtheROIdefinitionanalysis above.
2.5.3. WholebrainanalysisofBOLDmodulationbythealphaenvelope
AgrouplevelGLMwasappliedtotestthecorrelationbetweenthe BOLDactivityandthereconstructedEEGalphaenvelopeinthewhole braindefinedbytheFreeSurferatlas.Specifically,aonesamplegroup meananalysiswasconductedusingthemri_glm-fitcommand(withthe– osgmflag)inFreeSurfertotestwhetherthe𝛽 valuesofeachvoxelfrom each subject’sGLMweresignificantlyhigher than0over thegroup. Therunswithhighvariancewerede-weighted(withthe-wlscesvarpct flag).Weusedavoxel-wisepof0.05(uncorrected)asthethreshold tovisualizethevoxelsthatweresignificantlymodulatedbythealpha envelope.
2.5.4. CorrelatingROIBOLDactivitywithvoxel-wiseresponsevariance
Insubsequentanalyses,weinvestigatedtherelationshipbetween re-sponsevariabilityofvoxelsinV1andV2(R1andR2included)during visualstimulationandtheleveloftheBOLDresponseineachvoxel(this analysiswasintendedtoevaluatethepossibilityofasaturationeffectin stronglyactivatedvoxelswhichcouldhavemaskedalpha-related fluctu-ations).Toquantifythevariabilityofeachvoxel,wecalculatedthe stan-darddeviation(SD)ofthepercentsignalchange(PSC)withinafixed timewindow (5-28sforeachtrial,sametimewindowasthetime windowusedtodefinetheregressors).Foreachvoxel,thepreprocessed BOLDtimeseriesofeachtrialwasextractedandconvertedtoPSCby dividingtheBOLDsignalbytheprestimulusbaseline(6s).TheSDof thePSCwascalculatedacrosstimepertrialandfurtheraveragedacross trials,runsandsubjects.ToestimatetheleveloftheBOLDresponsein eachvoxel,weusedtheTvalueofthestimulus-onvs.stimulus-off con-trastforeachvoxel.Finally,wecalculatedthecorrelationbetweenthe TvalueandtheSDofthePSCacrossvoxels.
2.5.5. CorrelatingtheBOLDactivityinV1andV2withotherfrequency envelopes
Finally,wetestedifotherfrequenciessignificantlycorrelatedwith theBOLDinV1andV2.Asdoneforthealpha-bandenvelope,foreach subjectweusedthedelta,thetaandbetaenvelopesasparametric regres-sorsandperformedseparatefirstlevelGLMsforeachregressor.Motion parameterswereusedas nuisanceregressors.The HRFandthedrift weremodeledusingthesamefunctionasabove.Wenextperformeda onesamplet-testtotestwhetherthe𝛽 estimatesofallthevoxelsinV1 andV2fromthesefirstlevelGLMsweresignificantlyhigherthan0,and anonparametricpermutationtesttodetermineifthe𝛽 estimatesofany frequencywerehigherthanthoseoftheotherfrequencies.
3. Results
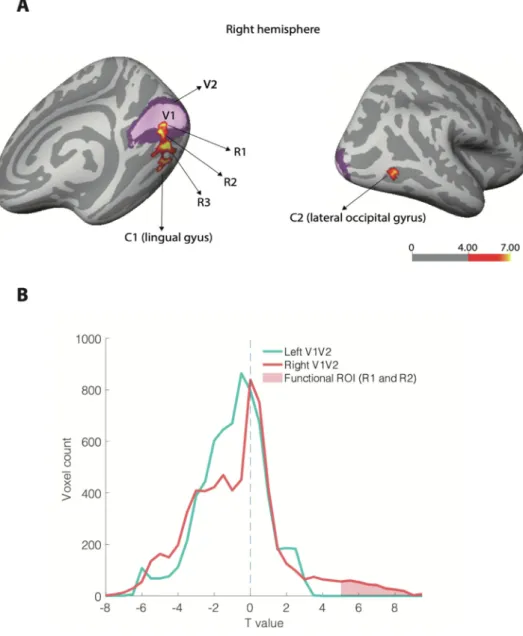
Wefirstdeterminedthevoxelsthatwereactivatedbythestimulus, bycontrastingstimulusonversusoff periods.Agrouplevelanalysis re-vealedtwoclustersofactivityintherighthemisphere:clusterone(C1, Fig.2A,left)waslocatedinthelingualgyrusbelowthecalcarinefissure, andextendingtowardsthefusiformgyrus(p<0.05corrected,MNI co-ordinates:x=21.9,y=−79,z=−8.3).Thesecondcluster(C2,Fig.2A, right)ofactivitywasfoundinthelateraloccipitalgyrus(p<0.05 cor-rected, MNIcoordinates:x=41.3,y=−72.6,z=−0.5).There wasno corresponding cluster in theleft hemisphere,sincethestimuluswas lateralizedtotheleft.ThesetwoclustersC1andC2wereconsidered asgroupfunctionalregions-of-interest(ROIs).Inadditiontothesetwo ROIs,wedefinedthreeothergroupfunctionalROIsbyconsideringthe overlapofC1andC2withtheFreesufer-atlasbaseddefinitionsofV1 andV2:R1andR2,theintersectionofC1withV1andV2respectively, andR3,whichwerethevoxelsinC1thatwerenotinV1orV2. Addition-ally,Freesufer-atlasbasedV1andV2weredefinedasanatomicalROIs. (Fig.2A).Finally,wedefinedfunctionalROIsattheindividual-subject level(withapre-determinedvoxelnumber:100voxels)inV1,V2andin extra-striateareasoutsideofV1andV2.Assomevoxelssharedthesame p-value,theselectionofthemostsignificantvoxelsdidnotalwaysreturn theexactnumberofexpectedvoxels.Acrosssubjects,theregions actu-allycontained103.1+−5.1voxels(R1,mean+-sd),109.4+−17.7voxels (R2)and111.2+−12.2voxels(R3).
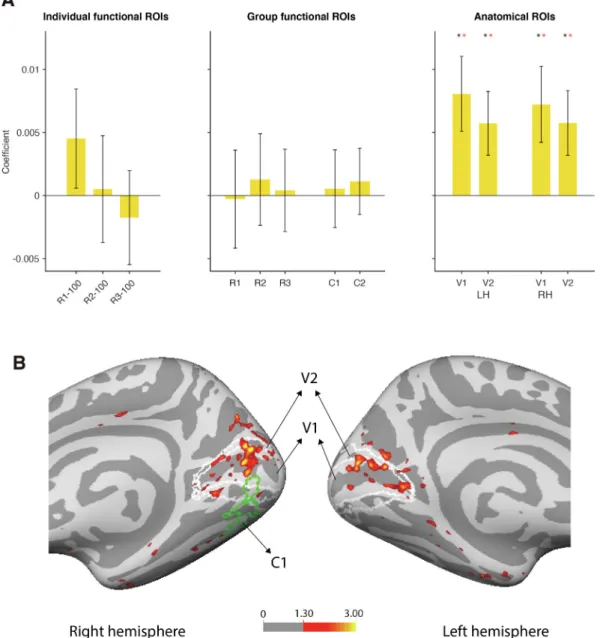
Sincealphais themainfrequencycomponentintheIRF,wefirst used the7–14Hz(alpha)envelope ofthereconstructedEEGasa re-gressorinthefMRIanalysistodeterminewhichROIsco-varywiththe perceptualechoesinducedbythewhite-noiseluminancesequence.In ordertotestthesignificance,weconductedat-testandapermutation test.Forthepermutationtest,wecreated2000surrogatesbyshuffling the alphaenvelopes of all thetrialsfor each subjectandperformed thefirst-levelGLMontheshuffleddata.Pvaluesofthemean coeffi-cientswerecomputedfromthepercentilewithinthepermutednull dis-tributions.Inthepre-definedgroup-levelfunctionalROIs(C1,C2,R1, R2andR3)wefoundthatBOLDactivitywasnotsignificantly modu-lated bythealphaenvelope ofthereconstructedEEG(Fig.3A, mid-dle).Themeancoefficientof R1,R2,R3,C1 andC2was closeto0, withlargeinter-subjectvariability(t-testagainst0:R1t(19)=−0.0734,
p=0.9422,R2t(19)=0.3510,p=0.7295,R3t(19)=0.1249,p=0.9019, C1t(19)=0.1748,p=0.8631,C2t(19)=0.4264,p=0.6746. Permuta-tiontest:R1p=0.5400,R2 p=0.4900,R3p=0.5000,C1p=0.4800, C2p=0.4300).Likewise,theindividual-levelfunctionalROIswere in-significant,eventhoughthealphaenvelopemodulationofR1–100was visiblyhigherthanin theotherfunctionalROIs(Fig.3A, left)(t-test against0: R1–100t(19)=1.1484, p=0.2650,R2–100t(19)=0.1195,
p=0.9061,R3–100t(19)=−0.4706,p=0.6433.Permutationtest:R1– 100 p=0.1400, R2–100p=0.5200,R3–100p=0.7500).Besides, the individual functionalROIs with 50 voxels and 200 voxels also did not show significant alpha modulation (Figure S1). However, the mean coefficientsforV1andV2weresignificantlyhigher than0in both hemispheres(Fig.3A, right). Thecorrespondingstatistical tests revealed: for Right V1, t-test against 0: t(19)=2.3976, p=0.0269, mean=0.0072,95%CI=0.0009– 0.0135.Permutationtest:p=0.01, 95%CI=−0.0060– 0.0054;RightV2,t-testagainst0:t(19)=2.2400,
p=0.0372, mean=0.0058, 95% CI=0.0004 - 0.0111. Permutation test: p=0.02,95% CI=−0.0050 – 0.0051; Left V1, t-test against0: t(19)=2.7072,p=0.0140,mean=0.0081,95%CI=0.0018– 0.0143. Permutationtest:p=0.01,95%CI=−0.0056– 0.0061;LeftV2,t-test against0:t(19)=2.2635,p=0.0355,mean=0.0057,95%CI=0.0004 -0.0110.Permutationtest:p=0.02,95%,CI=−0.0048– 0.0047.The t-testsandpermutationtestforV1andV2wereconductedusingallvoxels inV1andV2.Inagreementwiththesefindings,awhole-brainanalysis revealedwide-spreadBOLDactivitymodulationbythealphaenvelope bilaterallyinV1andV2(Fig.3B).TheBOLDactivitiesmodulatedby delta,thetaandbetaintheROIsareshowninsupplementaryFigureS2, 4
Fig. 2. A) Group level retinotopic activa-tionin earlyvisualareasof the right hemi-sphere. The light purple represents the lo-cation of the primary visual area (V1) and the darkerpurple representsthe location of thesecondaryvisualareaV2,whichwere ex-tracted with the Freesurfer atlas. Statistical analysisatthegrouplevelrevealed2clusters ofretinotopicactivityinresponsetothe stimu-lus(red/yellow):clusterone(C1)ontheleftis locatedbelowthecalcarinesulcus(MNI coor-dinates:x=21.9,y=−79,z=−8.3)withpartial overlapwithV1andV2,andcluster2canbe seenintherightpanel,possiblycorresponding tolateraloccipitalcortex(LOC).R1,R2andR3 weredefinedas:R1=V1∩C1,R2=V2∩C1, R3=C1– (V1∪V2).Thecolorbarrepresents -log10ofthepvalueofat-testagainst0.B) Dis-tributionoft-values(voxelcount)forthe con-trast between stimulus-periodsand fixation-periods. The functional ROI was definedas t>5(redshadedarea),andonlyincludes right-hemispherevoxels(asexpected,sincethe stim-uluswaslocatedinthelefthemifield).Inboth LeftandRightV1-V2voxels,thereisa signif-icanttrendtowardsnegativevalues:63%and 55%ofvoxels(respectively)hadnegative stim-ulusresponses,andthisproportionwas signifi-cantlylargerthan50%(binomialtest,p<10−10 inbothcases).(Forinterpretationofthe refer-encestocolourinthisfigurelegend,thereader isreferredtothewebversionofthisarticle.)
andseesupplementaryFigureS3forthewholebrainanalysisforthese threefrequencies.
TheseresultsindicatethatthereconstructedenvelopeofEEGalpha wassignificantlycorrelatedwithBOLDresponsesinV1andV2. Sur-prisinglyhowever,thiscorrelationwasvisibleoutside,butnotwithin thedirectly(retinotopically)stimulatedregion(C1).Thisleavestwo im-portantissuestoaddress:first,theabsenceofalphamodulationinthe stimulus-responsiveROI,wherewecould havenaturallyexpectedit; second,thepresenceofalphamodulationinunstimulatedregionsof vi-sualcortex,reachingasfarastheoppositehemisphere.Wetentatively interpretthefirstissueasaconsequenceofsignalsaturation,andthe secondasasignatureofwide-spreadinhibition,asdetailedbelow.
First, we hypothesized that the lackof alpha modulation in the stimulus-responsiveROI(C1)mayreflectsaturationinthesevoxelsby thecontinuedpresenceofthevisualstimulus.Asaresultofthis satura-tioneffect,wehypothesizedthatthesevoxelswouldnotbesusceptible tothesmallerandrapidmodulationsintheluminanceofthestimulus. Inotherwords,overthegroupofvoxels,wewouldexpectvoxelsthat havehighlevelsofresponse(e.g.,thosewithintheretinotopically stim-ulatedregions) tohave lowerresponsevariability(sincethey would not be modulated by the random changes in stimulus luminance). In contrast, voxels that are modulated (possibly indirectly) by the
luminancechangesbutnotsaturatedbystimuluspresentation,would show largersignal variability, buta lower BOLDresponse. Inother words,overthegroupofvoxels,weexpectedanegativecorrelation be-tweentheBOLDresponseandsignalvariabilityofvoxelsinV1andV2. Totestthishypothesis,weanalyzedtherelationshipbetweentheSDof PSC(ameasureofsignalvariability)andtheTvalueofthestimulus-on vs.stimulus-off contrast(ameasureofBOLDresponse)ofeachvoxelin V1andV2.TheSDofthePSCofeachvoxelinV1andV2(asexplained intheMethodsSection)wasaveragedacrosstrials,runsandsubjects. TheresultsshowedthattheTvaluewasnegativelycorrelatedwiththe SDof PSC(r=−0.1538,p< 0.01).Inotherwords, aspredicted, the overallstimulus-inducedBOLDresponsewasinverselyrelated,across voxels, to the signal variability over time. This is compatible with the notion thatsignal saturation preventedusfrom observing alpha amplitudefluctuationsintheretinotopicregionsofinterest(C1andC2). Second, we turned to the observation of widespread alpha-IRF modulationsacross V1andV2,bilaterallyin bothhemispheres. One possibleinterpretationcouldbethatitwasstimulus-dependent inhibi-tion,ratherthanexcitation,outsideofthestimulus-responsiveROIthat ledtothewidespreadalpha-IRF modulationsbyroutinginformation. To explore this possibility, we first looked into the distribution of stimulus-relatedBOLDactivityacrossearlycortex(V1-V2),thatis,the
C. Luo, S. Brüers, I. Berry et al. NeuroImage 237 (2021) 118053
Fig.3.A)𝛽 weightsofmodulationofBOLDactivitybythealphaenvelopeofthereconstructedEEGintheregionsofinterest.Barsrepresentmean±s.e.m acrosssubjects.Noindividual-level(left)orgroup-level(middle)functionalROIsweresignificantlymodulatedbytheperceptualechoes.Incontrast,BOLDactivity inbilateralV1andV2(anatomicalROIs)wassignificantlymodulatedbythealphacomponentofthereconstructedEEG(right).Theblackasterisksrepresenta significantdifferenceagainst0,t-testacrosssubjects(N=20,p<0.05).Theredasterisksindicatethatthecoefficientissignificantlyhigherthanthenullhypothesis distributionofthesurrogates(nonparametrictest).B)Wholebrainanalysisofregionscorrelatedtofluctuationsinthealphapowerenvelopeintherightandleft hemispheres.Theactivationsextendwellbeyondthestimulusresponsiveregionsofinterests(C1outlinedingreen)intoV1andV2(outlinedinwhite).Thesignificant voxelscomputedfromthegroup-levelGLMareshowninred/yellowatathresholdofp<0.05(-log10(0.05)=1.3).Thecolorbarrepresents-log10ofthepvalue ofat-testagainst0.NotethatnosignificantnegativecorrelationsofBOLDwithalphaenvelopewereobservedinvisualareas(andonlyfewsparselydistributed negativecorrelationsovertherestofthebrain),hencethecolorscaleonlydisplayspositivecorrelations.(Forinterpretationofthereferencestocolourinthisfigure legend,thereaderisreferredtothewebversionofthisarticle.)
contrastbetween stimulusperiodsandfixationperiods(Fig.2B).We foundindeed,inadditiontoanumberofvoxelswithhight-valuesinthe righthemisphere(t>5.0,correspondingtoourROI),ageneralshiftof thedistributiontowardsnegativeBOLDactivations.Thisnegativetrend wassignificantlypresentinbothleftandrightV1-V2,eventhoughthe stimuluswaslateralized(63%and55%voxelsinleftV1-V2andright V1-V2respectivelyhadnegativeresponsestostimuli,binomialtest:p<
10−10inbothcases).Thisiscompatiblewithbroadlydistributed
inhibi-tionoutsideofthestimulusregion.Eventhoughsuchinhibitioncould happenwithoutanyrelationtothestimulusfluctuations,thefactthat themanyvoxelsinthesamebroadregionalsoshowpositivecorrelation with the reconstructed EEG envelope hints at a possible functional
relation between neural inhibition and alpha IRF propagation. The existenceofsucharelationisfurthersupportedbytwoobservations: first,thereisaweakbutsignificantnegativecorrelationacrossvoxels betweenthet-valueofstimulusresponseandthet-valueofthealpha IRFmodulation(r=−0.018,p<0.04);second,thevoxelsthatweremost significantlymodulatedbythealphaIRF(voxelsmappedinFig.3B) tendedtohavenegativet-valuesforstimulusresponse(54.4%negative values,p=0.0001,binomialtest).
Finally,weaskedifactivityinV1andV2wasmainlymodulated by alpha,orifotherfrequency bandsalsomodulatedtheBOLD sig-nalstrongly.WeimplementedseparateGLMswiththeenvelopesofthe reconstructed EEGfiltered in thedelta,theta,andbetabands as
Fig.4. CoefficientsofthemodulationofBOLDactivitybythereconstructed EEGenvelopeofthedelta,theta,alphaandbetabandfrequencies.Thebars representthemean,andtheerrorbarsrepresentthestandarderrorofthemean acrosssubjects.Theblackasteriskrepresentsasignificantdifferenceagainst 0,t-testacrosssubjects(N=20,p<0.05).Theredasteriskindicatesthatthe coefficientissignificantlyhigherthanthe95thpercentileofthenullhypothesis distribution(nonparametrictestagainstotherfrequencies).Thisfigureshows thattheBOLDactivityisonlymodulatedbythealphaenvelope.Thedashlines indicatethe95%and99%CIofthenulldistribution.(Forinterpretationof thereferencestocolourinthisfigurelegend,thereaderisreferredtotheweb versionofthisarticle.)
gressorsfortheBOLDactivity.Theresults,showninFig.4,revealed thatthecoefficientsfromtheseotherfrequencybandswerenot signif-icantlyhigherthanzero(V1andV2:deltat(19)=1.1142,p=0.2791, thetat(19)=1.0316,p=0.3152,alphat(19)=2.5357,p=0.0202,beta t(19)=−0.1720, p=0.8653). A nonparametricpermutation test was conductedtodetermineifIRF-dependentBOLDmodulationsatany fre-quencywerehigherthanfortheotherfrequencies.Surrogateswere com-putedbyshufflingthecorrelationcoefficientsacrossallfrequencybands insingle-subjectdataforeachanatomicalROI(leftV1,leftV2,rightV1 andrightV2),thenaveragingacrosssubjectsandROIs.The95%and 99%CI aswellasthep-valuesweretakenfromthenulldistribution composedofthesesurrogates(Permutationtest:deltap=0.6000,theta
p=0.4200,alphap=0.0020,betap=0.9800).Thesameanalysiswas alsoperformedonthesefrequenciesinleftV1,V2andrightV1,V2 sep-arately,andtheresultisshowninsupplementaryFigureS4
4. Discussion
Inthisstudy,weconductedanEEG-fMRIexperimenttoinvestigate theneuralbasisoftheIRF.WefirstmeasuredtheIRFofeachsubject in the EEG session. We thenreconstructed an estimate of the EEG signalbyconvolving theIRFwith thestimulipresentedin thefMRI session.TheenvelopesofreconstructedEEGsignalsinthetheta,alpha andbetabandsweretakenasregressorsfortheGLM.Wefoundthat theenvelopeoftheEEGalpha,morethantheotherfrequencies,was
positivelycorrelatedwithBOLDactivityinV1andV2,butsurprisingly notwithactivityintheretinopicallystimulatedregions.Wehypothesize thatthelackofeffectintheretinopicallystimulatedROIsmightbedue toasaturationeffectbythevisualstimulus.
Theactivationsfoundinearlyvisualareas(Fig.3)areinlinewiththe observationthattheIRFisavisualresponse,strongestinposterior re-gions(VanRullenandMacDonald,2012).Intriguingly,large-scale acti-vationswerefoundinleftV1andV2,i.e.,inthehemispherethatwasnot directlystimulated(Fig.3B).Letusfirstconsiderthepossibilitythat sub-jectsmayhavedirectlyperceivedthestimuliintheirrightvisualfield. Thiscouldhaveoccurredforexamplebecauseofunwantedeye move-ments,orpossiblybecauseofstimulusilluminationreflectingoff ofthe innerwallsoftheMRI.Toavoidthissecondpossibility,wehadelected tousesmallerstimulithaninourpreviousstudies(2° vs.7° inVanRullen andMacdonald,2012andsubsequentstudies).Toavoidthefirst possi-bility,weinstructedsubjectstofixateinthecenterofthescreen,and avoidunnecessaryeyemovements.Thecircumscribedstimulus-related activationsin relativelysmall sub-regionsof V1andV2of theright hemifieldwhencontrastingstimulus-onandstimulus-off periods(Fig.2) suggestthatsubjectssuccessfullymaintainedfixationandthatthe stim-uluspositionwasspatiallyrestricted,asintended.Ifsubjectshadmade systematiceyemovementsorifthestimulushadbeenreflectedat dis-tantpositions,we wouldhaveexpectedinsteadabroader patternof stimulusactivations,possiblyextendingtotheotherhemifield.Hence, thealpha-envelopeinducedactivationsinthelefthemisphere(Fig.3B) appeartobeduetoIRFpropagationacrosshemispheres.Thiswould beconsistentwithpreviouslyreportedfindingsthattheIRFpropagates asa travelingwave(AlamiaandVanRullen,2019; Lozano-Soldevilla andVanRullen,2019).Inparticular,thestudybyLozano-Soldevillaand VanRullen(2019)pointedoutthatthepropagationoftheIRFto lat-eralizedWNsequencesfollowsretinotopicrulessuchthatitcantravel fromcontra-lateraltoipsi-lateralregions,inagreementwiththecurrent results.
ItisreasonabletocompareourresultswiththoseofEEG-fMRIstudies ofthegeneratorsofthealpharhythm,becauseoftherelationbetween theIRFandthealpharhythm—eventhoughthecurrent understand-ingofalphageneratorsisincomplete.TheEEGalphapowerwasfound tobenegativelycorrelatedwithBOLDactivityinoccipitalcorticesin both resting-statestudies(deMunck etal.,2007; DiFrancescoetal., 2008;Goldmanetal.,2002;Gonçalvesetal.,2006;Laufsetal.,2003; Moosmannetal.,2003)andduringtaskperformance(Scheeringaetal., 2016;Scheeringaetal.,2009;Zumeretal.,2014).Onthecontrary,we foundtheIRFenvelopetobepositivelycorrelatedwithV1andV2BOLD signals.Thecommonneuralbasis(earlyvisualareas)togetherwiththe oppositeactivationprofiles(i.e.,oppositecorrelationswiththeBOLD) indicatethattheIRFandtheEEGalpharhythmmightshareneural path-ways,butservedistinctfunctionalrolesinthebrain.
TheresultsofthepresentstudysuggestthattheIRFinresponseto left-visualfieldstimulimighthaveoriginatedfromoneormultiple start-ingpointsintherightearlyvisualcortex(V1,V2),fromwhichitspread overmuchoftheearlyvisualcortex.Theactivationattheorigincould notbedirectlymeasured,presumablybecauseofBOLDsaturation ef-fects,howeveritspropagationtodistantpartsofvisualcortex,including theoppositehemifield,wasreadilyvisible.Itisplausiblethatthis prop-agationofIRFoscillationstodistantpartsofthevisualcortexmaybe as-sociatedwithstimulus-dependentinhibitionofnon-task-relatedregions, thoughthisconclusionmayrequirefurtherconfirmation.Ourfindings areofimportanceforfurtherstudiestolocatetheoriginoftheIRFmore precisely.Forexample,futurestudiescouldspecificallyrecordtheIRF inV1andV2usingintracranialrecordingsduringdifferentvisualtasks, tobetterunderstandwhereandwhentheIRFappears,andhowit prop-agatestootherpartsofvisualcortex.
ItisworthemphasizingthatourmeasureoffMRIcorrelatesof per-ceptualechoesisonlyanindirectoneandthat,consequently,our con-clusionsremaintentative.First,echoesweremeasuredofflineoutside thescanner,andfromthecorrespondingIRFprofileswepredictedthe
C. Luo, S. Brüers, I. Berry et al. NeuroImage 237 (2021) 118053 “reconstructedEEG” signalduringthefMRIsessions.Thispredictionis
statisticallyvalid(BrüersandVanRullen,2017),butonlyan approxi-mationofthetrue EEGsignal.Second,weweresurprisedtofindan absenceofBOLDsignalmodulationsinthefunctionallydefinedROIs. Whilethespeculativeinterpretationweproposedintermsofresponse saturationappearstobesupportedbyourcontrolanalyses,theremay stillbe otherexplanations,e.g., basedon stimulus-dependent inhibi-tionofnon-taskrelatedregions,oronothernon-specificeffects.Third, wefocusedonalpha-bandenvelopefluctuationsasaregressorforthe BOLDanalysis,motivatedbythestrongalphapowertypicallyobserved asthemainsignatureofperceptualechoes(VanRullenandMacdonald, 2012;BrüersandVanRullen,2017;Lozano-SoldevillaandVanRullen, 2019).However,IRFsalsocontainweakersignalsfromotherfrequency bands(delta,theta,beta),thatcanexplainasignificantproportionof variancefrom the reconstructedEEG (Brüers andVanRullen, 2017). Accordingly,wealsofoundsignificant(albeitweakerandless consis-tent)BOLDresponsestodelta-andtheta-bandenvelopemodulationsin earlyvisualcortex(SupplementaryFigures2,3and4).Finally,our fo-cusonamplitudeenvelopemodulationsleavesasideotherpotentially informativepartsoftheEEGsignal,reflectedinphasemodulationsor insecond-orderrelationssuchascross-frequencycoupling.Whilethis choicemakessenseforaninitialinvestigation,webelievethatfuture studiescouldattempttocharacterizethesemorerapidEEGsignalsand theirconsequencesonBOLDactivity.
Inconclusion,ourstudyfoundBOLDactivationswhosetimecourse wasrelatedtotheIRFenvelopeintheearlyvisualcortex.Thewidely spread activation might be due to the propagation of (possibly in-hibitory)IRFtravelingwaves(Lozano-SoldevillaandVanRullen,2019; AlamiaandVanRullen,2019).Ourstudyadvancesourknowledgeof thespatialproperties oftheIRFbynarrowingdown itsneuralbasis, thereforepavingthewayforfuturestudiestopreciselylocalizethe gen-erator(s)oftheIRFanddeepenourunderstandingofitsfunctional rel-evance.
Creditauthorstatement
CL: EEG analysis, fMRI analysis, writing-original draft, writing-reviewingandediting.SB:Dataacquisition(EEG,fMRI),EEGanalysis, fMRIanalysis,writing-originaldraft,writing-reviewingandediting.IB: participantmedicalscreening.RV:conceptualization,writing- review-ingandediting.LR:fMRIanalysis,conceptualization,writing-reviewing andediting.
Dataavailability
The data that support the findings are available on figshare (10.6084/m9.figshare.14601342)
Acknowledgments
ThisworkwassupportedbyanERCgrantP-CYCLESnumber614244 andanANRgrantOSCI-DEEPnumber19-NEUC-0004-01toRV.Weare gratefultoJean-PierreJaffrezouforassistanceineditingthemanuscript. CLisfundedbyChinaScholarshipCouncil.TheauthorsthankNathalie VayssiereandtheINSERM/UPSUMR1214MRIplatformfortechnical assistance.
Supplementarymaterials
Supplementarymaterialassociatedwiththisarticlecanbefound,in theonlineversion,atdoi:10.1016/j.neuroimage.2021.118053.
References
Alamia, A., VanRullen, R., 2019. Alpha oscillations and traveling waves: signatures of predictive coding? PLoS Biol. 17 (10), e3000487. doi: 10.1371/journal.pbio.3000487 .
Bonnefond, M., Jensen, O., 2012. Alpha oscillations serve to protect working mem- ory maintenance against anticipated distracters. Curr. Biol. 22 (20), 1969–1974. doi: 10.1016/j.cub.2012.08.029 .
Bowen, R.W. , 1989. Two pulses seen as three flashes: a superposition analysis. Vision Res. 29 (4), 409–417 .
Brüers, S., VanRullen, R., 2017. At what latency does the phase of brain oscillations in- fluence perception? Eneuro 4 (3). doi: 10.1523/eneuro.0078-17.2017 , ENEURO.0078- 17.2017 .
de Munck, J.C., Gonçalves, S.I., Huijboom, L., Kuijer, J.P.A., Pouwels, P.J.W., Heethaar, R.M., Lopes da Silva, F.H., 2007. The hemodynamic response of the alpha rhythm: an EEG/fMRI study. NeuroImage 35 (3), 1142–1151. doi: 10.1016/J.NEUROIMAGE.2007.01.022 .
Delorme, A. , Makeig, S. , 2004. EEGLAB: an open source toolbox for analysis of single-trial EEG dynamics including independent component analysis. Journal of neuroscience methods 134 (1), 9–21 .
DiFrancesco, M.W., Holland, S.K., Szaflarski, J.P., 2008. Simultaneous EEG/functional magnetic resonance imaging at 4 Tesla: correlates of brain activity to sponta- neous alpha rhythm during relaxation. J. Clin. Neurophysiol. 25 (5), 255–264. doi: 10.1097/WNP.0b013e3181879d56 .
Fellner, M.C., Volberg, G., Mullinger, K.J., Goldhacker, M., Wimber, M., Green- lee, M.W., Hanslmayr, S., 2016. Spurious correlations in simultaneous EEG-fMRI driven by in-scanner movement. NeuroImage 133, 354–366. doi: 10.1016/j.neuroimage.2016.03.031 .
Goldman, R.I., Stern, J.M., Engel Jr„ J., Cohen, M.S., 2002. Simultaneous EEG and fMRI of the alpha rhythm. Neuroreport 13 (18), 2487–2492. doi: 10.1097/01.wnr.0000047685.08940.d0 .
Gonçalves, S.I., De Munck, J.C., Pouwels, P.J.W., Schoonhoven, R., Kuijer, J.P.A., Mau- rits, N.M., …, Lopes Da Silva, F.H., 2006. Correlating the alpha rhythm to BOLD us- ing simultaneous EEG/fMRI: inter-subject variability. NeuroImage 30 (1), 203–213. doi: 10.1016/j.neuroimage.2005.09.062 .
Gulbinaite, R. , İ lhan, B. , VanRullen, R. , 2017. The triple-flash illusion reveals a driving role of alpha-band reverberations in visual perception. Journal of Neuroscience 37 (30), 7219–7230 .
Hagler Jr, D.J. , Saygin, A.P. , Sereno, M.I , 2006. Smoothing and cluster thresholding for cortical surface-based group analysis of fMRI data. Neuroimage 33 (4), 1093–1103 . Huster, R.J., Debener, S., Eichele, T., Herrmann, C.S., 2012. Methods for simul-
taneous EEG-fMRI: an introductory review. J. Neurosci. 32 (18), 6053–6060. doi: 10.1523/jneurosci.0447-12.2012 .
Ilhan, B., VanRullen, R., 2012. No Counterpart of Visual Perceptual Echoes in the Auditory System. PLoS ONE 7 (11). doi: 10.1371/journal.pone.0049287 .
Jensen, O., Mazaheri, A., 2010. Shaping functional architecture by oscillatory alpha ac- tivity: gating by inhibition. Front. Hum. Neurosci. 4. doi: 10.3389/fnhum.2010.00186 . Kizuk, S.A.D., Mathewson, K.E, 2017. Power and phase of alpha oscillations reveal an interaction between spatial and temporal visual attention. J. Cogn. Neurosci. 29 (3), 480–494. doi: 10.1162/jocn_a_01058 .
Kleiner, M., Brainard, D., Pelli, D., Ingling, A., Murray, R., Broussard, C., 2007. What’s new in psychtoolbox-3. Perception 36 (14), 1–16. doi: 10.1068/v070821 .
Klimesch, W., Pachinger, T., Schwaiger, J., Russegger, H., Doppelmayr, M., 2002. Induced alpha band power changes in the human EEG and attention. Neurosci. Lett. 244 (2), 73–76. doi: 10.1016/s0304-3940(98)00122-0 .
Laufs, H., Kleinschmidt, A., Beyerle, A., Eger, E., Salek-Haddadi, A., Preibisch, C., Krakow, K., 2003. EEG-correlated fMRI of human alpha activity. NeuroImage 19 (4), 1463–1476. doi: 10.1016/S1053-8119(03)00286-6 .
Lozano-Soldevilla, D., VanRullen, R., 2019. The hidden spatial dimension of alpha: 10-Hz perceptual echoes propagate as periodic traveling waves in the human brain. Cell Rep. 26 (2), 374–380.e4. doi: 10.1016/j.celrep.2018.12.058 .
Moosmann, M., Ritter, P., Krastel, I., Brink, A., Thees, S., Blankenburg, F., …, Villringer, A., 2003. Correlates of alpha rhythm in functional magnetic reso- nance imaging and near infrared spectroscopy. NeuroImage 20 (1), 145–158. doi: 10.1016/S1053-8119(03)00344-6 .
Pelli, D.G., Watson, A.B., 1983. QUEST: a Bayesian adaptive psychome- tric method. Percept. Psychophys. 33 (2), 113–120. Retrieved from https://link.springer.com/article/10.3758/BF03202828 .
Rao, R.P.N., Ballard, D.H, 1999. Predictive coding in the visual cortex: a functional inter- pretation of some extra-classical receptive-field effects. Nat. Neurosci. 2 (1), 79–87. doi: 10.1038/4580 .
Sadaghiani, S., Kleinschmidt, A., 2016. Brain networks and 𝛼-oscillations: structural and functional foundations of cognitive control. Trends Cogn. Sci. (Regul. Ed.) 20 (11), 805–817. doi: 10.1016/j.tics.2016.09.004 .
Scheeringa, R., Koopmans, P.J., Mourik, T.van, Jensen, O., Norris, D.G., 2016. The rela- tionship between oscillatory EEG activity and the laminar-specific BOLD signal. Pro-
ceed. Natl. Acad. Sci. 113 (24), 6761–6766. doi: 10.1073/PNAS.1522577113 . Scheeringa, R., Petersson, K.M., Oostenveld, R., Norris, D.G., Hagoort, P., Basti-
aansen, M.C.M, 2009. Trial-by-trial coupling between EEG and BOLD identifies net- works related to alpha and theta EEG power increases during working memory main- tenance. NeuroImage 44 (3), 1224–1238. doi: 10.1016/J.NEUROIMAGE.2008.08.041 . VanRullen, R., MacDonald, J.S.P, 2012. Perceptual echoes at 10 Hz in the human brain.
Curr. Biol. 22 (11), 995–999. doi: 10.1016/j.cub.2012.03.050 .
Zumer, J.M., Scheeringa, R., Schoffelen, J.M., Norris, D.G., Jensen, O., 2014. Occipital al- pha activity during stimulus processing gates the information flow to object-selective cortex. PLoS Biol. 12 (10), e1001965. doi: 10.1371/journal.pbio.1001965 .