HAL Id: hal-01636892
https://hal.archives-ouvertes.fr/hal-01636892
Submitted on 17 Nov 2017
HAL is a multi-disciplinary open access
archive for the deposit and dissemination of
sci-entific research documents, whether they are
pub-lished or not. The documents may come from
teaching and research institutions in France or
abroad, or from public or private research centers.
L’archive ouverte pluridisciplinaire HAL, est
destinée au dépôt et à la diffusion de documents
scientifiques de niveau recherche, publiés ou non,
émanant des établissements d’enseignement et de
recherche français ou étrangers, des laboratoires
publics ou privés.
Distributed under a Creative Commons Attribution - NonCommercial - ShareAlike| 4.0
Adrian Altenhoff, Brigitte Boeckmann, Salvador Capella-Gutiérrez, Daniel
Dalquen, Todd Deluca, Kristoffer Forslund, Jaime Huerta-Cepas, Benjamin
Linard, Cécile Pereira, Leszek Pryszcz, et al.
To cite this version:
Adrian Altenhoff, Brigitte Boeckmann, Salvador Capella-Gutiérrez, Daniel Dalquen, Todd Deluca,
et al.. Standardized benchmarking in the quest for orthologs. Nature Methods, Nature Publishing
Group, 2016, 13 (5), pp.425-430. �10.1038/nMeth.3830�. �hal-01636892�
Achieving high accuracy in orthology inference is essential for many comparative, evolutionary and functional genomic analyses, yet the true evolutionary history of genes is generally unknown and orthologs are used for very different applications across phyla, requiring different precision–recall trade-offs. As a result, it is difficult to assess the performance of orthology inference methods. here, we present a community effort to establish standards and an automated web-based service to facilitate orthology benchmarking. using this service, we characterize 15 well-established inference methods and resources on a battery of 20 different benchmarks. standardized benchmarking provides a way for users to identify the most effective methods for the problem at hand, sets a minimum requirement for new tools and resources, and guides the development of more accurate orthology inference methods. Evolutionarily related genes (homologs) across different species are often divided into gene pairs that originated through specia-tion events (orthologs) and gene pairs that originated through
duplication events (paralogs)1. This distinction is useful in a
broad range of contexts, including phylogenetic tree inference, genome annotation, comparative genomics and gene function
prediction2–4. Accordingly, dozens of methods5 and resources6–8
for orthology inference have been developed.
Because the true evolutionary history of genes is typically unknown, assessing the performance of these orthology infer-ence methods is not straightforward. Several indirect approaches have been proposed. Based on the notion that orthologs tend to be functionally more similar than paralogs (a notion now
referred to as the ortholog conjecture9–12), Hulsen et al.13 used
several measures of functional conservation (coexpression levels, protein–protein interactions and protein domain conservation) to
benchmark orthology inference methods. Chen et al.14 proposed
an unsupervised learning approach based on consensus among
different orthology methods. Altenhoff and Dessimoz15
intro-duced a phylogenetic benchmark measuring the concordance between gene trees reconstructed from putative orthologs and undisputed species trees. More recently, several ‘gold standard’
reference sets, either manually curated16,17 or derived from trusted
resources18, have been used as benchmarks. Finally, Dalquen
et al.19 used simulated genomes to assess orthology inference in the presence of varying amounts of duplication, lateral gene transfer and sequencing artifacts.
This wide array of benchmarking approaches poses consider-able challenges to developers and users of orthology methods. Conceptually, the choice of an appropriate benchmark strongly depends on the application at hand. Practically, most methods are not available as stand-alone programs and thus cannot easily be
standardized benchmarking in the quest for orthologs
Adrian M Altenhoff
1,2, Brigitte Boeckmann
3, Salvador Capella-Gutierrez
4–6, Daniel A Dalquen
7, Todd DeLuca
8,
Kristoffer Forslund
9, Jaime Huerta-Cepas
9, Benjamin Linard
10, Cécile Pereira
11,12, Leszek P Pryszcz
4,
Fabian Schreiber
13, Alan Sousa da Silva
13, Damian Szklarczyk
14,15, Clément-Marie Train
1, Peer Bork
9,16,17,
Odile Lecompte
18, Christian von Mering
14,15, Ioannis Xenarios
3,19,20, Kimmen Sjölander
21, Lars Juhl Jensen
22,
Maria J Martin
13, Matthieu Muffato
13, Quest for Orthologs consortium
23, Toni Gabaldón
4,5,24, Suzanna E Lewis
25,
Paul D Thomas
26, Erik Sonnhammer
27& Christophe Dessimoz
7,20,28–301Department of Computer Science, ETH Zurich, Zurich, Switzerland. 2Computational Biochemistry Research Group, Swiss Institute of Bioinformatics, Zurich, Switzerland.
3Swiss-Prot Group, Swiss Institute of Bioinformatics, Geneva, Switzerland. 4Bioinformatics and Genomics Programme, Centre for Genomic Regulation, Barcelona
Institute of Science and Technology, Barcelona, Spain. 5Universitat Pompeu Fabra, Barcelona, Spain. 6Yeast and Basidiomycete Research Group, CBS Fungal Biodiversity
Centre, Utrecht, the Netherlands. 7Department of Genetics, Evolution, and Environment, University College London, London, UK. 8Center for Biomedical Informatics,
Harvard Medical School, Boston, Massachusetts, USA. 9Structural and Computational Biology Unit, European Molecular Biology Laboratory, Heidelberg, Germany.
10Department of Life Sciences, Natural History Museum, London, UK. 11Université Paris-Sud, Laboratoire de Recherche en Informatique, Orsay, France. 12Université
Paris-Sud, Institute for Integrative Biology of the Cell, Orsay, France. 13European Molecular Biology Laboratory, European Bioinformatics Institute, Wellcome Trust
Genome Campus, Hinxton, UK. 14Institute of Molecular Life Sciences, University of Zurich, Zurich, Switzerland. 15Bioinformatics Systems Biology Group, Swiss Institute
of Bioinformatics, Zurich, Switzerland. 16Germany Molecular Medicine Partnership Unit, University Hospital Heidelberg and European Molecular Biology Laboratory,
Heidelberg, Germany. 17Max Delbrück Centre for Molecular Medicine, Berlin, Germany. 18LBGI, Computer Science Department, ICube, University of Strasbourg,
Strasbourg, France. 19Vital-IT, Swiss Institute of Bioinformatics, Lausanne, Switzerland. 20Center for Integrative Genomics, University of Lausanne, Lausanne, Switzerland.
21Department of Bioengineering, University of California, Berkeley, California, USA. 22The Novo Nordisk Foundation Center for Protein Research, Faculty of Health
and Medical Sciences, University of Copenhagen, Copenhagen, Denmark. 23A list of authors who are consortium members is provided at the end of the manuscript.
24Institució Catalana de Recerca I Estudis Avançats, Barcelona, Spain. 25Genomics Division, Lawrence Berkeley National Laboratory, Berkeley, California, USA. 26Division
of Bioinformatics, Department of Preventive Medicine, University of Southern California, Los Angeles, California, USA. 27Stockholm Bioinformatics Center, Department
of Biochemistry and Biophysics, Stockholm University, Science for Life Laboratory, Solna, Sweden. 28Department of Ecology and Evolution, University of Lausanne,
Lausanne, Switzerland. 29Department of Computer Science, University College London, London, UK. 30Swiss Institute of Bioinformatics, Biophore Building, Lausanne,
Switzerland. Correspondence should be addressed to C.D. ([email protected]).
Received 28 JanuaRy; accepted 9 MaRch; published online 4 apRil 2016; doi:10.1038/nMeth.3830
OPEN
npg
© 201
6 Nature
America, Inc.
compared on a common set of data. Likewise, some benchmarks rely on complex pipelines that may be difficult to implement. If public results are available as part of a publication or a resource, inconsistent genome releases or identifiers severely complicate comparisons. Some methods or benchmarks can also be compu-tationally costly to run. As a result, users cannot easily identify appropriate tools, and methodological progress is hampered.
Here, we report on a community effort to standardize and facilitate orthology benchmarking. For this effort, we estab-lished a shared reference data set and developed a web-based
service for automatic orthology benchmarking (http://orthology.
benchmarkservice.org). We then used these resources to run a community experiment to assess 15 well-established orthology inference methods and resources on a wide array of phylogenetic and functional benchmarks. By providing a way to automatically include new methods and disseminate results publicly, we hope to maintain an up-to-date and comprehensive assessment of state-of-the-art orthology tools.
results
Here, we provide an overview of the benchmark service and orthology inference methods and then present benchmarking results in three categories: species discordance tests, reference gene trees and functional tests. The benchmark service alone required the evaluation of 70,390,701 orthologous relationships and the inference of 233,000 phylogenetic trees.
Benchmark service
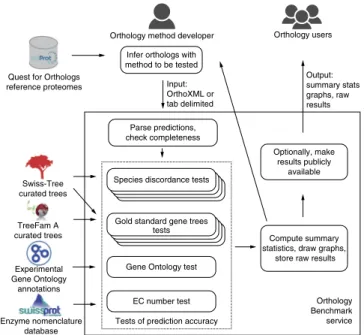
To automate ortholog benchmarking on a broad range of tests (detailed below), we developed a publicly accessible web service (Fig. 1). Using this workflow, an orthology method developer first infers orthologs using the Quest for Orthologs (QfO) reference proteome data set. Orthology inference methods vary in the kind of output they provide—e.g., labeled gene trees and orthologous groups—but it is usually possible to reduce these to orthologous pairs, which thus constitute a natural ‘common denominator’ for benchmarking. The benchmark service accepts these pairwise
orthologs predictions in OrthoXML20 or tab-delimited format.
As the OrthoXML format also supports InParanoid-style clusters and hierarchical orthologous groups, the service can automati-cally convert these to pairwise relationships.
Next, the service ensures that only predictions among valid reference proteomes are provided (with scoring implicitly assum-ing that the uploaded inferences are complete). Benchmarks are then selected and run in parallel; some may take up to several hours. Finally, statistical analyses determine the method’s per-formance on each benchmark data set. Where possible, perform-ance is measured in terms of precision (i.e., positive predictive value: the proportion of ortholog predictions that are correct) and recall (i.e., sensitivity, or true positive rate: the proportion of actual orthologs that are correctly predicted). Raw data and results are stored and provided to the submitter, who can choose
to make the results publicly available. In order to achieve trans-parency and encourage improvements, we have released source code under an open source license (Mozilla Public License
Version 2.0) at https://github.com/qfo/benchmark-webservice
(also Supplementary Software).
methods investigated
We investigated a broad array of well-established methods,
includ-ing three tree-based methods: Ensembl Compara21, PANTHER
8.0 (ref. 22) and PhylomeDB23; seven graph-based methods (i.e.,
based on pairwise comparisons): Best Reciprocal Hits24, Reciprocal
Smallest Distance (RSD)25, EggNOG26, Hieranoid27, InParanoid28,
OMA29, OrthoInspector30 and a meta-method incorporating both
tree- and graph-based methods, MetaPhOrs31. For some methods,
multiple variants are included in the analysis (Online Methods). Each method inferred orthologs on the 754,149 protein sequences from 66 reference genomes except for MetaPhOrs, which inferred orthologs on all but three prokaryotes (Online Methods).
Generalized species tree discordance test
Orthology was first defined in the context of species tree
inference, which requires genes related through speciation1. The
species tree discordance test exploits this relationship by assessing the accuracy of orthologs in terms of the accuracy of the species
tree that can be reconstructed from them15. The original
proto-col was limited to species tree ‘comb’ topology (a specific type of tree in which all bifurcations occur along a single path) and a small number of taxa (up to six). Here we overcome these two limitations by generalizing the orthology sampling procedure to any tree topology and employing larger reference trees from the SwissTree initiative. Furthermore, to minimize the possibility of gene–species tree discordance due to incomplete lineage sorting, we avoided sampling orthologs among species separated by branches shorter than 10 million years (myr) (Online Methods and Supplementary Fig. 1).
We observed different trade-offs between average discordance
(Robinson–Foulds32 distance, as a proxy for the false discovery
rate, the complement of precision) and the number of trees that
Swiss-Tree curated trees Quest for Orthologs reference proteomes
Enzyme nomenclature database
Parse predictions, check completeness Infer orthologs with method to be tested Input: OrthoXML or tab delimited Output: summary stats graphs, raw results Orthology Benchmark service Tests of prediction accuracy
EC number test Gold standard gene trees
tests Species discordance tests
Compute summary statistics, draw graphs,
store raw results Optionally, make results publicly
available
Gene Ontology test
Orthology method developer Orthology users
TreeFam A curated trees
Experimental Gene Ontology
annotations
Figure 1 | The Orthology Benchmark service facilitates assessment and
comparison of orthology inference methods. Orthology method developers run their methods on a reference proteome set and submit the inferred orthologs to the service. The predictions are subjected to a battery of phylogenetic and functional tests, and the results are returned to the method developer, who can choose to disclose them publicly.
npg
© 201
6 Nature
America, Inc.
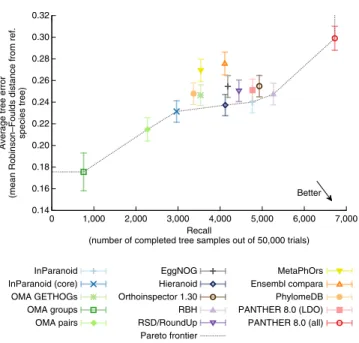
can be sampled (proxy for recall) across all methods (Fig. 2). An ideal method would be placed in the lower right corner of
Figure 2. When considering eukaryotes, results with the highest
precision and lowest recall were obtained with OMA groups. At the other extreme, PANTHER 8.0 (all) tended to yield the highest recall and lowest precision results. Among the more balanced methods, no method consistently obtained a better balance than the other methods across all data sets, but Orthoinspector, InParanoid and PANTHER (LDO only) performed well overall. In terms of broad categories, there is no obvious systematic difference in perform-ance between tree-based (Ensembl, PANTHER and PhylomeDB) and graph-based methods (the rest) or between methods rely-ing on species tree (Ensembl, PANTHER, PhylomeDB, OMA GETHOGs, Hieranoid and EggNOG) and methods that do not. The latter point is perhaps unexpected, as one could expect knowledge of the species tree to provide an ‘unfair’ advantage in this particular benchmark. If there is any such effect, our results indicate that it is small.
These trends persisted when we measured recall in terms of the number of inferred orthologs (Supplementary Fig. 2) or when we focused on other clades (Supplementary Figs. 3–5). Among vertebrates, the results were largely consistent, but we noted minor differences in the ranking of individual methods, with InParanoid Core yielding the highest precision and MetaPhOrs the highest recall (Supplementary Fig. 3). We also benchmarked the methods for their ability to recover ortholog relationships among ‘universal’ genes by applying the species discordance test on a tree spanning across archaea, bacteria and eukaryotes. Once again, there were slight variations in the precise ranking of methods, but the overall trends were very similar to what was observed for eukaryotes only (Supplementary Fig. 5). Finally, if we included (high-confidence) short branches as well, the average concordance of reconstructed trees substantially decreased, both because short branches tend to be harder to infer and because of potential incomplete lineage sorting around them; however, the
relative position of the methods remained practically unchanged, which was a further indication of the robustness of the benchmark (Supplementary Fig. 6).
reference gene trees
The second series of orthology benchmarks employs evolution-ary relationships of gene pairs derived from annotated high-quality gene trees. Such reference trees are inferred through a careful combination of computational inference and expert cura-tion: results obtained at each step of the tree inference pipeline (homolog identification, alignment, tree inference and gene– species tree reconciliation) are individually inspected, poor-quality sequences are excluded from the analysis and results are typi-cally assessed using multiple models. This manual oversight is expected to yield gene phylogenies with high statistical support and topological consistency.
Concordance of orthology predictions was assessed with two
sets of trees. The first was SwissTree16,33, a small collection of
large- and high-confidence gene family phylogenies with different types of challenges for orthology prediction and species from all
domains. The second, TreeFam-A34, consisted of a larger set of
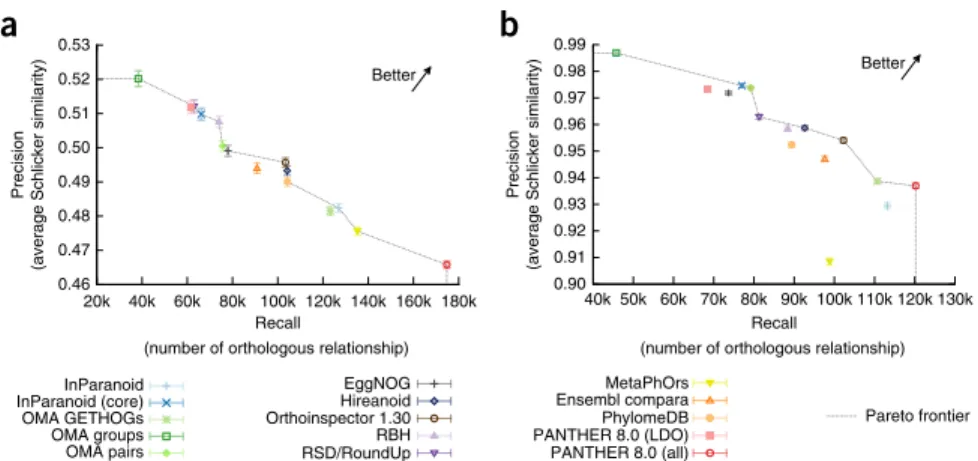
metazoan gene trees and thus covered a taxonomically restricted but wider range of protein families. Results obtained from the two benchmarks were quite similar (Fig. 3). On these benchmarks, virtually no trade-off between precision and recall appeared to be necessary. The best-performing meth-ods were the ones that adopted a balanced InParanoid InParanoid (core) OMA GETHOGs OMA groups OMA pairs MetaPhOrs Ensembl compara PhylomeDB PANTHER 8.0 (LDO) PANTHER 8.0 (all) Recall
(number of completed tree samples out of 50,000 trials)
Average tree error
(mean Robinson–Foulds distance from ref.
species tree) Hieranoid RBH RSD/RoundUp EggNOG Orthoinspector 1.30 Pareto frontier 0.14 0.16 0.18 0.20 0.22 0.24 0.26 0.28 0.30 0.32 0 1,000 2,000 3,000 4,000 5,000 6,000 7,000 Better Figure 2 | The Generalized Species Tree Discordance test assesses
the congruence of inferred orthologs with a trusted reference tree. Benchmarking results are shown for eukaryotes. A trade-off between precision (measured in terms of tree error in the y-axis) and recall (measured in terms of completed tree samples in the x-axis; Online Methods) can be observed. Only high-confidence branches of the reference tree (L90, Online Methods), at least 10 myr long, are considered. Error bars indicate 95% confidence intervals and the line indicates the ‘Pareto frontier’.
a
b
Hieranoid RBH RSD/RoundUp EggNOG Orthoinspector 1.30 MetaPhOrs Ensembl compara PhylomeDB PANTHER 8.0 (LDO) PANTHER 8.0 (all) Recall(true positive rate)
Precision
(positive predictive value)
Precision
(positive predictive value)
Recall (true positive rate)
Pareto frontier 0.75 0.80 0.85 0.90 0.95 1.00 0.35 0.40 0.45 0.50 0.55 0.60 0.65 0.70 0.75 0.80 0.85 Better 0.87 0.88 0.89 0.90 0.91 0.92 0.93 0.94 0.95 0.96 0.30 0.35 0.40 0.45 0.50 0.55 0.60 0.65 0.70 Better InParanoid InParanoid (core) OMA GETHOGs OMA groups OMA pairs
Figure 3 | Benchmark results using sets
of reference gene trees. Evolutionary gene relationships are predicted for the QfO reference proteomes by 15 different methods. From the results, pairs of orthologous relationships are determined for each method and compared to those obtained from the reference gene trees of (a) SwissTree and (b) TreeFam-A. Error bars
indicate 95% confidence intervals.
npg
© 201
6 Nature
America, Inc.
precision–recall strategy, with MetaPhOrs doing particularly well. Methods with a more skewed precision–recall strategy (in particular, stringent OMA groups and per-missive PANTHER (all)) fared poorly in comparison. This may be due in part to the
nature of the reference gene tree data set, which focuses on gene families with a tractable evolutionary history. On ambiguous phyl-ogenies, mistakes would become unavoidable and a skewed strategy could become preferable, depending on the application.
Functional benchmarks
The third series of benchmarks evaluated orthology in terms of functional similarity. Although orthology is an evolutionary and not a functional relationship, we chose to include functional benchmarks for two reasons. First, for similar levels of sequence divergence, orthologs have been shown to be moderately (but significantly) more conserved than paralogs in terms of Gene
Ontology (GO) annotation similarity11. For a given
evolution-ary distance, more accurate orthology inference is thus likely to be correlated with more functionally similar gene pairs. Second, many users are interested in using orthologs to identify function-ally conserved genes; for this purpose, functional benchmarks are directly relevant.
We assessed functional similarity based on experimentally backed annotations from the UniProt–Gene Ontology Annotation
(GOA) database35 and Enzyme Commission (EC) numbers from
the ENZYME database36. Though the two benchmarks
con-sider different aspects of gene function, the results were largely consistent. In both cases, orthology inference methods showed a clear trade-off between precision (measured as the average
Schlicker semantic similarity37 of functional annotations
asso-ciated with orthologs) and recall (measured as the number of ortholog relationships predicted; Fig. 4). The only exception was with the EC number benchmark, where MetaPhOrs falls beneath the ‘Pareto frontier’ (the frontier defined by the methods that are not outperformed by any other method in both precision and recall). However, MetaPhOrs is also the only method with missing taxa, and the three missing taxa contain a substantial number of genes with EC annotations (827 in total). This lack of EC annota-tions has a negative effect on the recall.
disCussion
The Orthology Benchmark service overcomes many of the practical complications previously associated with orthology benchmarking. It enables systematic comparison of a new method with state-of-the-art approaches on to a wide range of bench-marks. It replaces current practice, which typically includes fewer methods, fewer tests and less empirical data.
By relying on a common set of data for all methods, the benchmark service ensures that the results obtained by different
methods are directly comparable. Previous benchmarking efforts required painstaking and error-prone mapping of pro-teins between different sources, releases and choice of alternative splicing variants. In contrast, by relying on a common set of data for all methods, the benchmark service ensures that the results obtained by different methods are directly comparable. The only caveat is that, since proteomes vary in quality and analytical difficulty, the results on the benchmark data set may not entirely reflect the quality of the orthology assignments otherwise provided by each resource. The choice of species included in the QfO reference proteomes (Online Methods) requires a compro-mise between (i) increasing the number of proteomes to make the benchmark set more representative of current resources and (ii) keeping the number of proteomes low to facilitate and encour-age new submissions to the benchmark.
Submissions performed on a subset of the proteomes are discour-aged, as all missing predictions are counted as false negatives. This provides an incentive for submitters to analyze the entire reference proteome data set. We considered alternative ways of handling submissions on partial data, but these approaches had major flaws. For example, one alternative was to extrapolate scores obtained on the subset of proteomes considered in a particular submission to all data. However, this approach could introduce a bias in the analyses (e.g., some methods only predict orthologs for ‘easy’ pairs of proteomes). Another alternative was to restrict comparisons to the intersection of proteomes analyzed by all methods. However, this approach results in an excessive waste of information, as the intersection can only decrease with each additional method.
Overall, results obtained across multiple phylogenetic and functional tests corroborated previous observations that the main difference among the established orthology inference methods lies in the trade-off they produce in terms of precision and
recall13,15,17. However, this trade-off was not present in the
refer-ence gene tree test, perhaps because sequrefer-ences with ambiguous location are typically excluded from these hand-curated trees. On these reference trees, the meta-method MetaPhOrs performed particularly well. The analysis also confirmed that the widely used reciprocal best hit approach has a relatively high precision but a
relatively low recall38,39. Other methods fill different niches, with
OMA group and PANTHER (all) often lying at the two extremes of the precision–recall trade-off. Among the more balanced approaches, InParanoid, Hieranoid and OrthoInspector showed solid performance in most benchmarks.
The decision of whether to favor a skewed or a balanced approach to the precision–recall trade-off strongly depends on
a
b
(number of orthologous relationship) Recall
(number of orthologous relationship) Recall
Precision
(average Schlicker similarity)
Precision
(average Schlicker similarity)
0.90 0.91 0.92 0.93 0.94 0.95 0.96 0.97 0.98 0.99 40k 50k 60k 70k 80k 90k 100k 110k 120k 130k 0.46 0.47 0.48 0.49 0.50 0.51 0.52 0.53 20k 40k 60k 80k 100k 120k 140k 160k 180k Better Better Hireanoid RBH RSD/RoundUp EggNOG Orthoinspector 1.30 MetaPhOrs Ensembl compara PhylomeDB PANTHER 8.0 (LDO) PANTHER 8.0 (all) InParanoid InParanoid (core) OMA GETHOGs OMA groups OMA pairs Pareto frontier
Figure 4 | Benchmarks of functional
similarity between inferred orthologous gene pairs. Two different types of functional annotations are used: (a) experimentally
supported GO annotations and (b) Enzyme
Commission (EC) numbers. Error bars indicate 95% confidence intervals.
npg
© 201
6 Nature
America, Inc.
the application. For instance, hypothesis-generating analyses may favor a high recall, while phylogenomic species tree inference typically requires high precision. Because of this, we refrained from computing a combined score, which would necessarily entail a statement of preference with respect to this trade-off.
To be deemed competitive, a method should ideally reach or exceed the Pareto frontier in at least a subset of the benchmarks. If it does not, the benchmark service may help uncover bugs or deeper flaws. Analogous to unit testing in software engineering, benchmarking can also provide quality control for new releases of established resources. In the course of the present community benchmarking effort, over a hundred sets of predictions were sub-mitted to the service. Many submitters did not make their results publicly available, presumably after discovering poor outcome in some of the benchmarks. This clearly demonstrates the effective-ness of the benchmark service for quality control.
The bane of benchmarking is circularity. Despite our best efforts, not all circularity could be avoided. Some methods used knowl-edge of the species tree in their inference; however, this potentially unfair advantage produced a negligible difference in performance for these methods. More generally, many methods were trained or fine-tuned using some of the benchmarks considered here. For instance, parameters of the meta-method MetaPhOrs were
in part trained using TreeFam-A31. Similarly, the latest versions
of InParanoid28 and PhylomeDB23 used the benchmark service
for parameter fine-tuning. As for the functional benchmarks, although GO annotations derived from sequence comparisons were excluded, experiments are often guided by sequence similar-ity to proteins with known function. Thus, even when restricting analyses to experimentally backed GO annotations, we cannot avoid circularity entirely. However, because the benchmarks are collectively underpinned by a large amount of data from a broad range of species (tens of thousands of trees and hundreds of thou-sands of pairs of functional annotations), the risk of overfitting seems low, and this potential risk will be monitored by the QfO benchmarking working group. New benchmarks may be intro-duced over time to detect and discourage overfitting.
Presently, the benchmark service uses orthologous gene pairs as ‘common denominators’ among all the methods. However, many resources provide richer outputs—such as reconciled gene trees or hierarchical orthologous groups—and may indeed be optimized for these. The performance on pairwise data is thus not entirely representative of what the data offer. In the future, however, the benchmark service could be extended to evaluate these richer, more specific orthology formats as well. Similarly, the benchmark service could also be extended to take into account confidence scores or posterior probabilities, which are particularly relevant
to likelihood-based orthology inference methods40,41.
methods
Methods and any associated references are available in the online
version of the paper.
Note: Any Supplementary Information and Source Data files are available in the
online version of the paper.
ACknowledGments
This work was supported by Swiss National Science Foundation grant PP00P3_150654 (to C.D.), UK Biotechnology and Biological Sciences Research Council grant BB/L018241/1 (to C.D.), Spanish Ministry of Economy and Competitiveness grant BIO2012-37161 (to T.G.), Qatar National Research
Fund NPRP 5-298-3-086 (to T.G.), European Research Council grant ERC-2012-StG-310325 (to T.G.), National Institutes of Health (NIH) grant R24 OD011883 (to S.E.L.), U41 HG002273 (to S.E.L. and P.D.T.), U41 HG007822 (to M.J.M. and I.X.), Swiss State Secretariat for Education, Research and Innovation (SERI) funding (to I.X. and C.D.), US National Science Foundation EAGER Award #1355632 (to K.S.) and ANR project BIP-BIP ANR-10-BINF-03-02 (to O.L.). Furthermore, A.S.d.S., J.H.-C., M.J.M., M.M. and P.B. acknowledge support from the European Molecular Biology Laboratory, M.M. acknowledges support from the Wellcome Trust (WT095908), S.E.L. acknowledges support from Lawrence Berkeley National Laboratory core funds (Office of Basic Energy Sciences and US Department of Energy Contract No. DE-AC02-05CH11231), L.J.J. acknowledges support from the Novo Nordisk Foundation (Grant No. NNF14CC0001) and L.P.P. acknowledges support from the La Caixa–CRG International Fellowship Program.
Author ContriButions
A.M.A. and C.D. conceived the project, with contributions from the rest of the QfO benchmarking working group (A.S.d.S., B.B., C.P., E.S., F.S., K.F., K.S., J.H.-C., M.J.M., M.M., P.D.T., S.E.L. and T.G.); A.S.d.S. and M.J.M. contributed the reference proteomes; A.M.A., B.B., F.S. and K.F. contributed benchmarks; A.M.A., B.L., D.S., E.S., K.F., J.H.-C., L.P.P., M.M., S.C.-G., P.D.T., T.D. and T.G. contributed predictions; P.B., O.L., C.v.M., I.X. and L.J.J. supervised contributions of benchmarks or predictions. A.M.A. and C.-M.T. designed and implemented the benchmark service; D.A.D. and A.M.A. assessed the impact of incomplete lineage sorting on orthology inference; A.M.A. and J.H.-C. generated plots; A.M.A., B.B., C.D., E.S., F.S., K.F., K.S., M.M., P.D.T., S.E.L. and T.G. analyzed the results; A.M.A., B.B., C.D., E.S. and L.J.J. wrote the manuscript, with feedback from all other coauthors; C.D. coordinated the project. ComPetinG FinAnCiAl interests
The authors declare no competing financial interests.
reprints and permissions information is available online at http://www.nature. com/reprints/index.html.
This work is licensed under a Creative Commons Attribution-Non-Commercial-ShareAlike 3.0 Unported License. The images or other third party material in this article are included in the article’s Creative Commons license, unless indicated otherwise in the credit line; if the material is not included under the Creative Commons license, users will need to obtain permission from the license holder to reproduce the material. To view a
copy of this license, visit http://creativecommons.org/licenses/by-nc-sa/3.0/.
1. Fitch, W.M. Distinguishing homologous from analogous proteins.
Syst. Zool. 19, 99–113 (1970).
2. Koonin, E.V. Orthologs, paralogs, and evolutionary genomics. Annu. Rev.
Genet. 39, 309–338 (2005).
3. Gabaldón, T. & Koonin, E.V. Functional and evolutionary implications of
gene orthology. Nat. Rev. Genet. 14, 360–366 (2013).
4. Dessimoz, C. Editorial: orthology and applications. Brief. Bioinform. 12,
375–376 (2011).
5. Altenhoff, A.M. & Dessimoz, C. in Evolutionary Genomics (ed. Anisimova, M.) Ch. 9 (Humana Press, 2012).
6. Gabaldón, T. et al. Joining forces in the quest for orthologs. Genome Biol. 10, 403 (2009).
7. Dessimoz, C. et al. Toward community standards in the quest for orthologs.
Bioinformatics 28, 900–904 (2012).
8. Sonnhammer, E.L.L. et al. Big data and other challenges in the quest for
orthologs. Bioinformatics 30, 2993–2998 (2014).
9. Nehrt, N.L., Clark, W.T., Radivojac, P. & Hahn, M.W. Testing the ortholog conjecture with comparative functional genomic data from mammals.
PLoS Comput. Biol. 7, e1002073 (2011).
10. Thomas, P.D., Wood, V., Mungall, C.J., Lewis, S.E. & Blake, J.A. On the use of gene ontology annotations to assess functional similarity among orthologs
and paralogs: a short report. PLoS Comput. Biol. 8, e1002386 (2012).
11. Altenhoff, A.M., Studer, R.A., Robinson-Rechavi, M. & Dessimoz, C. Resolving the ortholog conjecture: orthologs tend to be weakly, but significantly, more similar in function than paralogs. PLoS Comput. Biol. 8, e1002514 (2012).
12. Chen, X. & Zhang, J. The ortholog conjecture is untestable by the current gene ontology but is supported by RNA sequencing data. PLoS Comput.
Biol. 8, e1002784 (2012).
13. Hulsen, T., Huynen, M.A., de Vlieg, J. & Groenen, P.M. Benchmarking ortholog identification methods using functional genomics data. Genome
Biol. 7, R31 (2006).
npg
© 201
6 Nature
America, Inc.
14. Chen, F., Mackey, A.J., Vermunt, J.K. & Roos, D.S. Assessing performance of orthology detection strategies applied to eukaryotic genomes. PLoS ONE 2, e383 (2007).
15. Altenhoff, A.M. & Dessimoz, C. Phylogenetic and functional assessment of
orthologs inference projects and methods. PLoS Comput. Biol. 5, e1000262
(2009).
16. Boeckmann, B., Robinson-Rechavi, M., Xenarios, I. & Dessimoz, C. Conceptual framework and pilot study to benchmark phylogenomic databases
based on reference gene trees. Brief. Bioinform. 12, 423–435 (2011).
17. Trachana, K. et al. Orthology prediction methods: a quality assessment
using curated protein families. Bioessays 33, 769–780 (2011).
18. Salichos, L. & Rokas, A. Evaluating ortholog prediction algorithms in a
yeast model clade. PLoS ONE 6, e18755 (2011).
19. Dalquen, D.A., Altenhoff, A.M., Gonnet, G.H. & Dessimoz, C. The impact of gene duplication, insertion, deletion, lateral gene transfer and sequencing
error on orthology inference: a simulation study. PLoS ONE 8, e56925
(2013).
20. Schmitt, T., Messina, D.N., Schreiber, F. & Sonnhammer, E.L.L. SeqXML and OrthoXML: standards for sequence and orthology information. Brief.
Bioinform. 12, 485–488 (2011).
21. Vilella, A.J. et al. EnsemblCompara GeneTrees: complete, duplication-aware
phylogenetic trees in vertebrates. Genome Res. 19, 327–335 (2009).
22. Mi, H., Muruganujan, A. & Thomas, P.D. PANTHER in 2013: modeling the evolution of gene function, and other gene attributes, in the context of
phylogenetic trees. Nucleic Acids Res. 41, D377–D386 (2013).
23. Huerta-Cepas, J., Capella-Gutiérrez, S., Pryszcz, L.P., Marcet-Houben, M. & Gabaldón, T. PhylomeDB v4: zooming into the plurality of evolutionary
histories of a genome. Nucleic Acids Res. 42, D897–D902 (2014).
24. Overbeek, R., Fonstein, M., D’Souza, M., Pusch, G.D. & Maltsev, N. The use of gene clusters to infer functional coupling. Proc. Natl. Acad.
Sci. USA 96, 2896–2901 (1999).
25. Wall, D.P., Fraser, H.B. & Hirsh, A.E. Detecting putative orthologs.
Bioinformatics 19, 1710–1711 (2003).
26. Powell, S. et al. eggNOG v4.0: nested orthology inference across 3686
organisms. Nucleic Acids Res. 42, D231–D239 (2014).
27. Schreiber, F. & Sonnhammer, E.L.L. Hieranoid: hierarchical orthology
inference. J. Mol. Biol. 425, 2072–2081 (2013).
28. Sonnhammer, E.L.L. & Östlund, G. InParanoid 8: orthology analysis
between 273 proteomes, mostly eukaryotic. Nucleic Acids Res. 43,
D234–D239 (2015).
29. Altenhoff, A.M. et al. The OMA orthology database in 2015: function predictions, better plant support, synteny view and other improvements.
Nucleic Acids Res. 43, D240–D249 (2015).
30. Linard, B. et al. OrthoInspector 2.0: software and database updates.
Bioinformatics 31, 447–448 (2015).
31. Pryszcz, L.P., Huerta-Cepas, J. & Gabaldón, T. MetaPhOrs: orthology and paralogy predictions from multiple phylogenetic evidence using
a consistency-based confidence score. Nucleic Acids Res. 39, e32 (2011).
32. Robinson, D.F. & Foulds, L.R. Comparison of phylogenetic trees.
Math. Biosci. 53, 131–147 (1981).
33. Zhang, X., Krause, K.-H., Xenarios, I., Soldati, T. & Boeckmann, B. Evolution of the ferric reductase domain (FRD) superfamily: modularity, functional
diversification, and signature motifs. PLoS ONE 8, e58126 (2013).
34. Schreiber, F., Patricio, M., Muffato, M., Pignatelli, M. & Bateman, A. TreeFam v9: a new website, more species and orthology-on-the-fly.
Nucleic Acids Res. 42, D922–D925 (2014).
35. Dimmer, E.C. et al. The UniProt-GO Annotation database in 2011.
Nucleic Acids Res. 40, D565–D570 (2012).
36. Bairoch, A. The ENZYME database in 2000. Nucleic Acids Res. 28,
304–305 (2000).
37. Schlicker, A., Domingues, F.S., Rahnenführer, J. & Lengauer, T. A new measure for functional similarity of gene products based on Gene
Ontology. BMC Bioinformatics 7, 302 (2006).
38. Wolf, Y.I. & Koonin, E.V. A tight link between orthologs and bidirectional
best hits in bacterial and archaeal genomes. Genome Biol. Evol. 4,
1286–1294 (2012).
39. Dalquen, D.A. & Dessimoz, C. Bidirectional best hits miss many orthologs in duplication-rich clades such as plants and animals. Genome Biol. Evol. 5, 1800–1806 (2013).
40. Sennblad, B. & Lagergren, J. Probabilistic orthology analysis. Syst. Biol. 58, 411–424 (2009).
41. Akerborg, O., Sennblad, B., Arvestad, L. & Lagergren, J. Simultaneous Bayesian gene tree reconstruction and reconciliation analysis. Proc. Natl.
Acad. Sci. USA 106, 5714–5719 (2009).
The Quest for Orthologs consortium:
Adrian M Altenhoff, Brigitte Boeckmann, Salvador Capella-Gutierrez, Todd DeLuca, Kristoffer Forslund,
Jaime Huerta-Cepas, Benjamin Linard, Cécile Pereira, Leszek P Pryszcz, Fabian Schreiber, Alan Sousa da Silva,
Damian Szklarczyk, Clément-Marie Train, Odile Lecompte, Ioannis Xenarios, Kimmen Sjölander, Maria J Martin,
Matthieu Muffato, Toni Gabaldón, Suzanna E Lewis, Paul D Thomas, Erik Sonnhammer & Christophe Dessimoz
npg
© 201
6 Nature
America, Inc.
QfO consortium has defined a consensus data set of proteomes
and common file formats6,7 to be used by diverse orthology
inference methods, allowing for standardized benchmarks and aiding integration of multiple ortholog sources. The QfO Reference Proteomes data sets were created as a collection of data providing a representative protein for each gene in the genome of selected species. Such data sets have been generated annually from
the UniProt Knowledgebase (UniProtKB) database42 for the past
five years. To this end, a gene-centric pipeline has been developed and enhanced over these years by UniProt. The QfO Reference Proteomes are a manually compiled subset of the UniProt refer-ence proteomes, comprising well-annotated model organisms and organisms of interest for biomedical research and phylogeny, with the intention to provide broad coverage of the tree of life. These complete, nonredundant reference proteomes are publicly
avail-able at ftp://ftp.ebi.ac.uk/pub/databases/reference_proteomes/
QfO. The data sets are provided either in SeqXML20 format or as
a collection of FASTA files.
The benchmarking effort reported here uses the reference proteomes data set released in 2011, which comprises 754,149 nonredundant protein sequences from 66 species (40 eukaryotes and 26 bacteria–archaea).
The reference species tree used in this study was produced by the QfO species tree working group, which surveyed the literature
to establish a well-supported tree topology for the 66 species43
(Supplementary Fig. 1). The internal nodes of this reference spe-cies tree have assigned confidence levels based on the agreement among the resources surveyed (L90: congruent, significant branch support; L70: congruent; L50: one alternative species tree topol-ogy; L30: default level; L10: two or more alternative species tree topologies have been reported; for more detail, see Boeckmann
et al.43). The latest version of the tree can be retrieved from
http://swisstree.vital-it.ch/species_tree. To minimize the chance of including cases of incomplete lineage sorting in the species tree discordance benchmark, we estimated the evolutionary times of
all internal branches using the timetree resource44 and collapsed
branches that were shorter than 10 myr.
Orthology databases and methods. EggNOG26 (http://eggnogdb.
embl.de) is a database of Orthologous Groups (OGs) and func-tional annotation covering prokaryotic and eukaryotic species. Since version 4.1, the EggNOG method is also capable of produc-ing fine-grained (for example, pairwise) orthology predictions based on the automated analysis of phylogenetic trees. For this study, the complete set of 66 reference proteomes was independ-ently analyzed using the EggNOG pipeline, which involved 1) joining proteins into inparalogous groups from closely related species and 2) de novo reconstruction of 38,513 OGs by cluster-ing the obtained inparalogous groups based on triangles of their
reciprocal best hits45. Phylogenetic analysis and automated tree
interpretation for each OG was subsequently performed using the workflow described in PhylomeDB22 as implemented in the ETE Toolkit v2.3 (ref. 46). The phylogenetic approach used included
testing three aligners (MAFFT47 v6.861b, Muscle48 v3.8.31 and
Clustal Omega49 v1.2.1) and five evolutionary models (LG, WAG,
JTT, VT and MtREV); applying alignment consensus and soft
trimming techniques (M-Coffee50 v10, trimAl51 v1.3); and using
was applied in a per-OG basis. Pairwise orthology predictions
were derived from each tree using the species overlap algorithm53
after rooting trees to midpoint. The predictions were submitted to the benchmark service in July 2015.
Ensembl Compara21 uses a gene–species tree
reconcilia-tion pipeline. The predicreconcilia-tions were run using the code released in version 81 of the Ensembl (July 2015). However, Treebest (the software used to build phylogenetic trees) had to be adapted to accept alignments of protein sequences. Treebest makes a consensus out of trees built with various phylogenetic methods and some of them required nucleotide sequences, which were not provided in the QfO data set. The list of maximum-likelihood models and distance methods (used for neighbor joining) was thus updated to: WAG, JTT and Dayhoff instead of WAG and HKY (for maximum likelihood), and JTT, Kimura and mixed amino acid models instead of dN, dS and mixed nucleotide models (for neighbor joining). The predictions were submitted to the benchmark service in June 2015. An older submission based on version 66 of the Ensembl code (June 2011) is also present on the benchmark service.
Hieranoid27 performs pairwise orthology analysis using
InParanoid at each node in a guide (species) tree as it progresses from its leaves to the root. This concept reduces the total runtime complexity from a quadratic to a linear function of the number of species. We ran Hieranoid 2.0. Hieranoid outputs ortholog groups structured as species trees with orthologs at all levels, hence there can be many outparalogs within an ortholog group. The trees were therefore parsed to extract ortholog pairs only at the last common ancestor of two species, for all species pairs. The predictions were submitted to the benchmark service in April 2015.
InParanoid28 is a graph-based algorithm that aims to generate
orthologous groups that include all inparalogs but no outpara-logs between species pairs. Version 4.1 of the algorithm was run with default parameters. Two variants were tested in this study: the regular InParanoid output containing all predicted pairs of orthologs (labeled InParanoid in the plots) and a high-confidence set including only orthologs with InParanoid’s maximum confi-dence score of 1.0 (labeled Inparanoid (core)). The predictions were submitted to the benchmark service in June 2011.
MetaPhOrs31 (Meta Phylogeny-based Orthologs) is a repository
of orthologs and paralogs that were computed using phylogenetic trees available in several databases or computed from graph-based orthologous groups. For each orthology–paralogy prediction,
MetaPhOrs (http://orthology.phylomedb.org/) provides two
reliability scores: Evidence Level (informing about number of repositories from which prediction is retrieved) and Consistency Score (defining overall agreement of source databases about given prediction). MetaPhOrs does not include predictions for the three reference genomes Streptomyces coelicolor, Thermotoga maritima and Pyrococcus kodakaraensis (strain KOD1). The predictions were submitted to the benchmark service in February 2013.
OMA29 (Pairs, Groups, HOGs) is a publicly available resource
(http://omabrowser.org/) that provides orthology predictions among thousands of proteomes from all domains of life. OMA uses evolutionary distance estimates from Smith–Waterman align-ments to infer orthologs. A distinct feature among graph-based methods is the witness of nonorthology step in its pipeline, where
npg
© 201
6 Nature
America, Inc.
relationships form the OMA Pairs, a gene-centric view that lists all the orthologs for a given gene. (ii) OMA Groups, a very stringent type of grouping where all member proteins are orthologous to one another within a group. OMA Groups have been designed mainly for species tree inference purposes, as gene trees built from them should be congruent with the species tree. (iii) Lastly, we constructed hierarchical orthologous groups (OMA HOGs). These are nested groups that contain genes that descend from a single common ancestral gene within a given taxonomic range
using the GETHOGs algorithm54. The predictions were submitted
to the benchmark service in June 2011 (OMA pairs and groups) and in March 2013 (OMA HOGs).
OrthoInspector30 is a database of precomputed orthology and
inparalogy relationships and a stand-alone package allowing large-scale predictions of orthology between thousands of proteomes (http://lbgi.fr/orthoinspector/). The resource has recently under-gone a major new release, with improved speed and visualisation tools, but the inference algorithm is unchanged from the initial
graph-based method described in Linard et al.55. The predictions
were submitted to the benchmark service in June 2011.
PANTHER 8.022 is based on version 8.0 of the PANTHER
data-base (http://pantherdb.org), released in 2012 (the current version
is 10.0, released in 2015). Family membership of each sequence is based on HMM scoring to the PANTHER ‘library’ of HMMs (at both the family and subfamily levels). Sequences were aligned
with MAFFT56 and the resulting alignment was used to construct
phylogenetic trees with the GIGA program57. GIGA (version 1.1
was used for PANTHER version 8.0) uses a species tree to guide tree construction, and all nodes in the tree are labeled as specia-tion or gene duplicaspecia-tion events; these labeled nodes are used to infer orthologs (pairs of genes with a speciation event as their common ancestor). PANTHER predicts two types of orthologs: least-diverged orthologs (LDO) and other orthologs (O). LDO pairs can be simplistically thought of as ‘the same gene’ in two different species. Formally, the two genes created by each gene duplication event in the tree are treated asymmetrically: the least diverged duplicate (the one with the shortest branch immediately following the duplication) remains in the same LDO group as its ancestor, while the other duplicate founds a new LDO group. The benchmarking was performed on either LDO only, or all orthologs (including both LDO and O). The predictions were submitted to the benchmark service in February 2013.
PhylomeDB23 (http://phylomedb.org/) is a publicly available
repository of phylomes, i.e., the complete collection of phylog-enies for all genes of a given species in a predefined evolution-ary context. PhylomeDB is unique among other repositories in that it follows an approach that is both gene centric and genome wide. PhylomeDB uses its phylogenetic trees to infer orthology and paralogy relationships. For the Quest for Orthologs project, 42 phylomes were reconstructed using different combinations of the 66 species in the benchmark. A total of 458,108 phyloge-netic trees were generated, which were later combined to provide orthology predictions for all proteins included in the benchmark. Briefly, each tree was scanned and only the partition of up to 30 sequences, including the seed protein, was kept. Then, evolution-ary relationships were computed for those protein sequences based on a species overlap approach. Redundant predictions across
tions having a Consistency Score greater or equal to 0.5 across the whole data set were called orthologs. The predictions were submitted to the benchmark service in June 2013.
RBH24 (Reciprocal best hit) is a classic method consisting of
identifying the pairs of genes with mutually highest alignment score between every pair of species. Here, we use reciprocal blastp hits as orthologs, with minimum E-value of 1e–2, and we keep all hits that are ≥99% of the highest score. The predictions were submitted to the benchmark service in January 2016.
RSD25 infers orthology relationships by finding pairs of genes
whose nearest gene, computed using PAML, is the other gene in the pair. Candidates genes are also filtered using BLAST E-value and multiple-sequence alignment divergence thresholds.
This method is implemented in the database RoundUp58, a
large-scale orthology database developed by the Wall Lab. The database is no longer maintained, but the source code is still available at
https://github.com/todddeluca/reciprocal_smallest_distance/. To identify orthologs, we ran the algorithm with divergence and E-value cutoffs of 0.8 and 1e–5, respectively. The predictions were submitted to the benchmark service in February 2012.
Benchmarks. Generalized species tree discordance. The idea
behind the species tree discordance test is simple. Two genes are orthologous if they started diverging through a speciation event. Therefore, if we sample putative orthologous genes such that all resulting genes are related through speciation events, the resulting tree should be congruent with the species tree. Previously, we
pre-sented a sampling strategy for fully imbalanced tree topologies15.
Here, we extend this idea to arbitrary reference trees, including those with soft polytomies (unresolved nodes).
The following procedure is repeated a large number of times. We start with a random gene in a random genome. We then attempt to sample a maximal path along the tree by selecting an orthologous gene in the ‘next’ species in the tour from the list of reported orthologs (Supplementary Fig. 7a). If there are multiple possibilities in the choice of the ‘next’ species due to soft polytomies, or in the choice of the orthologous counterparts due to one-to-many or many-to-many orthology, a choice is made at random. If there is no predicted ortholog at any step along the path, the sample is deemed unsuccessful. Alternatively, if at least one orthologous counterpart is predicted at each step, this results in a set of n sequences. Assuming that i) the reference tree is correct, ii) the retrieved orthologs are all correct and iii) all within-species variation is fixed (i.e., no incomplete lineage sort-ing), it is easy to prove that the unrooted evolutionary tree relating these sequences should only contain speciation nodes and should therefore be congruent with the reference species tree.
Proof: The n sequences sampled through the circular tour are sampled by starting from a random sequence and retrieving n − 1 pairs of orthologs. By construction, these n − 1 pairs of orthologs belong to pairs of species that have distinct last common ancestors and thus coalesce in different speciation nodes in the phylogenetic tree of these sequences. Therefore, that tree contains at least n − 1 distinct speciation nodes. However, the rooted, fully-resolved evolutionary tree of n species has exactly n − 1 internal nodes. Thus, all the internal nodes of the gene tree are speciation nodes. Since we assume that there is no incomplete lineage sorting, as
npg
© 201
6 Nature
America, Inc.
A least-squares distance tree is reconstructed for each set of putative orthologous sequences. After aligning the sequences
with MAFFT47, maximum likelihood distances and their
vari-ances (using the inverse Fisher information) are estimated using the EstimatePam() function in the Darwin programming
envi-ronment59 for each pair of sequences. Next, the gene tree is
esti-mated using Darwin’s MinSquareTree() function, which is a fast
implementation of the weighted least-squares trees60 constrained
to non-negative branch lengths61. We have previously shown that
orthology benchmarking results obtained with such distance trees are consistent with more computationally demanding Maximum
likelihood trees15. The Robinson–Foulds32 distance between
this gene tree and the reference tree measures the false discovery rate, while the total number of trees is used as a proxy of recall. Due to the stochastic nature of the algorithm, repeated runs of the benchmark may lead to slightly (albeit nonsignificantly) different results.
Reference gene trees. Reference gene trees labeled with
specia-tion and duplicaspecia-tion events were downloaded from SwissTree
on March 23, 2015 (http://swisstree.vital-it.ch/) and Treefam-A
version 7 (http://www.treefam.org/). As sequences analyzed in
these two resources can differ from those of the QfO reference proteomes, sequences were mapped based on gene identifiers or sequence identifiers. After mapping, for each family the n(n − 1)/2 induced pairwise evolutionary relationships were extracted and compared with the orthologous predictions from each
orthol-ogy prediction method as follows. Let G = {gi} be the set of all
genes in the reference gene tree and RO = {(gi, gj) | gi ∈ G, gj ∈ G,
gi ≠ gj, label(gi,gj) = speciation} the set of true orthologs according
to the reference tree. Likewise, let RP be the set of nonorthologous
relations in that family and P = {(gi, gj)}, be the set of all
predic-tions made by the orthology method. With PF = {(gi, gj) | (gi, gj) ∈
P ∩ gi ∈ G ∩ gj ∈ G}, we denote the set of orthologs where both members are part of the reference gene family. Now, the true/false
positives/negatives are simply TP = PF ∩ RO, FP = PF ∩ RP, FN
= RO − PF and TN = RP − PF. From these values we can compute
positive predictive values (PPV) and true positive rate (TPR): PPV = |TP|/(|TP| + |FP|), TPR = |TP|/(|TP| + |FN|).
We can further estimate the uncertainties of these rates by treat-ing them as binomially distributed random variables, for example,
σ2(PPV) = PPV(1 − PPV)/(|TP| + |FP|). Finally, we combine all
the families by building averages of the rates. As an example, for the positive predictive value this results in,
avgPPV n PPVi and avgPPV n PPV i n i i n = = = =
∑
∑
1 1 1 2 2 2 1 / , s ( ) / s ( ) .Functional tests.We downloaded the Gene Ontology annotations62 for all the genes in the reference genomes from the November
2014 release of UniProt-GOA35 and excluded any annotation with
a ‘NOT’ qualifier from this set. For the analysis shown here, we only use annotations with experimental evidence codes (EXP, IPI, IDA, IMP, IGI and IEP). Likewise, we collected the hierarchical
EC number assignments of the ENZYME database36 maintained
by Swiss-Prot. The computation of the functional similarities between gene pairs is done in the same way for both types of data,
between any two genes, the most similar pairs of annotations are identified and averaged, i.e.,
GeneSim p p sim i j j p i p i Schlicker ) = + + ∈ ∈
∑
1 1 2 2 1 /(| | | |)( max ( ( , )
∑
j p∈2max∈∈p1(sim i j( , )))where pi is the set of function annotations associated with
protein i.
Code availability. The source code is available under an open
source license (Mozilla Public License Version 2.0) at https://
github.com/qfo/benchmark-webservice.
42. UniProt Consortium. Reorganizing the protein space at the Universal
Protein Resource (UniProt). Nucleic Acids Res. 40, D71–D75 (2012).
43. Boeckmann, B. et al. Quest for Orthologs (QfO) entails Quest for Tree
of Life (QfToL): in search of the gene stream. Genome Biol. Evol. 7,
1988–1999 (2015).
44. Hedges, S.B., Marin, J., Suleski, M., Paymer, M. & Kumar, S. Tree of life
reveals clock-like speciation and diversification. Mol. Biol. Evol. 32,
835–845 (2015).
45. Jensen, L.J. et al. eggNOG: automated construction and annotation of
orthologous groups of genes. Nucleic Acids Res. 36, D250–D254 (2008).
46. Huerta-Cepas, J., Dopazo, J. & Gabaldón, T. ETE: a python environment
for tree exploration. BMC Bioinformatics 11, 24 (2010).
47. Katoh, K. & Toh, H. Recent developments in the MAFFT multiple sequence
alignment program. Brief. Bioinform. 9, 286–298 (2008).
48. Edgar, R.C. MUSCLE: multiple sequence alignment with high accuracy and
high throughput. Nucleic Acids Res. 32, 1792–1797 (2004).
49. Sievers, F. et al. Fast, scalable generation of high-quality protein multiple
sequence alignments using Clustal Omega. Mol. Syst. Biol. 7, 539 (2011).
50. Wallace, I.M., O’Sullivan, O., Higgins, D.G. & Notredame, C. M-Coffee: combining multiple sequence alignment methods with T-Coffee. Nucleic
Acids Res. 34, 1692–1699 (2006).
51. Capella-Gutiérrez, S., Silla-Martínez, J.M. & Gabaldón, T. trimAl: a tool for automated alignment trimming in large-scale phylogenetic analyses.
Bioinformatics 25, 1972–1973 (2009).
52. Guindon, S. et al. New algorithms and methods to estimate maximum-likelihood phylogenies: assessing the performance of PhyML 3.0.
Syst. Biol. 59, 307–321 (2010).
53. Huerta-Cepas, J., Dopazo, H., Dopazo, J. & Gabaldón, T. The human
phylome. Genome Biol. 8, R109 (2007).
54. Altenhoff, A.M., Gil, M., Gonnet, G.H. & Dessimoz, C. Inferring hierarchical
orthologous groups from orthologous gene pairs. PLoS ONE 8, e53786
(2013).
55. Linard, B., Thompson, J.D., Poch, O. & Lecompte, O. OrthoInspector: comprehensive orthology analysis and visual exploration.
BMC Bioinformatics 12, 11 (2011).
56. Katoh, K. & Toh, H. Parallelization of the MAFFT multiple sequence
alignment program. Bioinformatics 26, 1899–1900 (2010).
57. Thomas, P.D. GIGA: a simple, efficient algorithm for gene tree inference in
the genomic age. BMC Bioinformatics 11, 312 (2010).
58. DeLuca, T.F., Cui, J., Jung, J.-Y., St Gabriel, K.C. & Wall, D.P. Roundup 2.0: enabling comparative genomics for over 1800 genomes. Bioinformatics 28, 715–716 (2012).
59. Gonnet, G.H., Hallett, M.T., Korostensky, C. & Bernardin, L. Darwin v. 2.0:
an interpreted computer language for the biosciences. Bioinformatics 16,
101–103 (2000).
60. Wikipedia contributors. Least squares inference in phylogeny.
Wikipedia, The Free Encyclopedia https://en.wikipedia.org/w/index. php?title=Least_squares_inference_in_phylogeny&oldid=552325441 (2013) (last accessed 7 March 2016).
61. Felsenstein, J. Inferring Phylogenies (Palgrave Macmillan, 2004). 62. Gene Ontology Consortium. Gene Ontology Consortium: going forward.
Nucleic Acids Res. 43, D1049–D1056 (2015).
63. Lin, D. An information-theoretic definition of similarity. in Proceedings of
the 15th International Conference on Machine Learning (ed. Shavlik, J.W.)
296–304 (Morgan Kaufmann, San Francisco, California, USA, 1998).
npg
© 201
6 Nature
America, Inc.