ÉCOLE DE TECHNOLOGIE SUPÉRIEURE UNIVERSITÉ DU QUÉBEC
THESIS PRESENTED TO
ÉCOLE DE TECHNOLOGIE SUPÉRIEURE
IN PARTIAL FULFILLEMENT OF THE REQUIREMENTS FOR THE DEGREE OF DOCTOR OF PHILOSOPHY
Ph. D.
BY
Seyed Ali NIKNAM
BURRS UNDERSTANDING, MODELING AND OPTIMIZATION DURING SLOT MILLING OF ALUMINIUM ALLOYS
MONTREAL, MAY 27 2013 © Copyright 2013 reserved by Seyed Ali Niknam
© Copyright reserved
It is forbidden to reproduce, save or share the content of this document either in whole or in parts. The reader who wishes to print or save this document on any media must first get the permission of the author.
BOARD OF EXAMINERS THIS THESIS HAS BEEN EVALUATED BY THE FOLLOWING BOARD OF EXAMINERS
Professor Victor Songmene, Thesis Supervisor
Department of Mechanical Engineering at École de technologie supérieure
Professor Ilian Bonev, President of the Board of Examiners
Department of Automated Manufacturing Engineering at École de technologie supérieure
Professor Tan Pham, Member of the Board of Examiners
Department of Mechanical Engineering at École de technologie supérieure
Dr Nejah Tounsi, External Examiner Research officer
Aerospace Manufacturing Technology Centre (AMTC) National Research Council Canada (NRC), Montréal
Dr Ali Bonakdar, Independent External Examiner
Manufacturing Engineering Specialist & Engineering Commodity Leader Rolls-Royce, Canada
THIS THESIS WAS PRENSENTED AND DEFENDED
IN THE PRESENCE OF A BOARD OF EXAMINERS AND PUBLIC IN APRIL 02 2013
DEDICATION
This thesis is dedicated to my loving parents and my beloved spouse for their love, endless supports and encouragements.
ACKNOWLEDGMENT
The last few years of my life have been the most challenging and rewarding because I truly had the opportunity to meet and understand people from many different countries who enriched my life by sharing a wide range of customs and cultural backgrounds. I am deeply grateful to all my advisors that opened my eyes and guided my steps in the long and winding road to the fantastic world of manufacturing science.
I would like to express my sincere gratitude to my advisor, Professor Victor Songmene, for the opportunity he has given me to work at the Laboratory of Products, Processes and Systems Engineering (LPPSE). Without his thrust, guidance, patience and supports, my research would not have been successful. Undoubtedly, he was the most influential person during my Ph.D and I hope the bond that we established will continue for many years to come.
My immense appreciation extends to Prof Tan Pham, Prof Ilian Bonev, Dr Nejah Tounsi and Dr Ali Bonakdar for serving as members of jury of my Ph.D defense committee and for providing valuable comments.
I appreciate National Sciences and Engineering Research Council of Canada (NSERC) and Consortium for Research and Innovation in Aerospace in Quebec (CRIAQ) for their financial support for this project. A partially financial support by Fonds Québécois de la Recherche sur la Nature et les Technologies (FQRNT) by the intermediary of the Aluminium Research Centre Canada– REGAL is gratefully acknowledged.
Sincere thanks are extended to my colleagues at LPPSE for their discussions and assistance in different parts of this research project. Special thanks go to Dr Yasser Zedan, Dr Jules Kouam, Dr Riad Khettabi, Dr Abdelhakim Djebara, Dr Imed Zaghbani, Dr Rene Kamguem, Mr Alireza Jalali, Mr Monzer Davoud, Mr Walid Joma and Mr Hossein Hamedanian.
I wish to give my wholehearted thanks to my parents for their unwavering supports, kind words, well-wishing and patience for abiding by my absence.
Special thanks go to my beloved wife for her support, encouragement and patience and for lifting much of the burden of life during the final stages of this thesis.
BURRS UNDERSTANDING, MODELING AND OPTIMIZATION DURING SLOT MILLING OF ALUMINIUM ALLOYS
Seyed Ali NIKNAM
ABSTRACT
Nowadays due to global competition, manufacturing industries must provide high quality products on time and within the cost constraints to remain competitive. High quality mechanical parts include those with better surface finish and texture, dimension and form accuracies, reduced tensile residual stress and burr-free. The burr formation is one of the most common and undesirable phenomenon occurring in machining operations, which reduces assembly and machined part quality. Therefore, it is desired to eliminate the burrs or reduce the effort required to remove them. Amongst machining operations, slot milling has a more complex burr formation mechanism with multiple burrs appear in machined part edges with non-uniform dimensions. The ultimate goal of this research work is burr minimization in slot milling operation. To this end, new strategies for understanding, modeling and optimizing burrs during slot milling of aluminum alloys are proposed for improving the part quality and ultimately reducing the non-value added expenses caused by deburring processes. In order to have a better understanding of slot milling burr formation mechanism, multi-level experimental studies and statistical methods are used to determine the effects of machining conditions, tooling and workpiece materials on burrs size (height and thickness) when using dry high speed condition. It was found that optimum setting levels of process parameters to minimize each burr are dissimilar. The analysis of results shows that cutting tool, feed per tooth and depth of cut have certain level of influence on slot milling burrs. However most of the burrs are strongly affected by interaction effects between process parameters that consequently complicate developing burr size prediction models.
An analytical model is proposed to predict the thickness of the largest burr during slot milling of ductile materials. The model is based on the geometry of burr formation and continuity of work at the transition from chip formation to burr formation, which also takes into account the effect of the cutting force involved in the machining process. A computational model is also developed to predict the exit up milling side burr thickness based on the use of cutting parameters and material properties such as yield strength and specific cutting force coefficient, which are the only unknown variables in the model. Both analytical and computational models are validated using experimental results obtained during slot milling of 2024-T351 and 6061-T6 aluminium alloys.
Machining parameters optimization to minimize the burr size could have a negative impact on other machining performance characteristic, such as surface finish, tool life and material removal rate. Therefore, surface finish is also investigated with burr formation in this
research work. For simultaneous multiple responses optimization, a new modification to the application of Taguchi method is suggested by proposing fitness mapping function and desirability index. The proposed modification is validated by simultaneous minimization of surface roughness and thickness of five burrs during slot milling of 6061-T6 aluminium alloy. The optimization results demonstrate the potential and capability of the proposed approach.
Key words: slot milling, aluminium alloy, burr, analytical modeling, machining conditions, optimization.
BURRS UNDERSTANDING, MODELING AND OPTIMIZATION DURING SLOT MILLING OF ALUMINIUM ALLOYS
Seyed Ali NIKNAM
RESUME
De nos jours, en raison de la compétition mondiale, les industries manufacturières doivent produire des pièces de qualité élevée et à temps pour demeurer compétitives. Les pièces mécaniques de qualité incluent celles ayant un meilleur fini de surface et une meilleure texture, une bonne précision de forme et dimensionnelle, des contraintes résiduelles réduites et des pièces sans bavures. La formation de bavures, l’un des phénomènes indésirables courants rencontrés lors des opérations d’usinage, réduit la qualité des pièces usinées et celle des assemblages. Par conséquent, il est désiré d’éliminer les bavures ou de réduire l’effort requis pour les enlever.
Parmi les opérations d'usinage, le rainurage est une opération du fraisage provoquant des mécanismes de formation de bavures plus complexes. Ainsi de multiples bavures apparaissent dans une partie des bords usinés avec des dimensions non uniformes. Le but ultime de ce travail de recherche est la minimisation des bavures en opération de rainurage. À cette finalité, de nouvelles stratégies sont proposées pour la compréhension, la modélisation et l'optimisation des bavures pour le rainurage des alliages d'aluminium, afin d’améliorer la qualité des pièces et la réduction des coûts occasionnés par les processus d'ébavurage.
Afin de mieux comprendre les mécanismes de formation des bavures au rainurage, des études statistiques basées sur des plans d’expériences multi-niveaux sont utilisés pour déterminer les effets des conditions de coupe, de l’outil et des matériaux usinés sur la taille des bavures (hauteur et épaisseur) pendant le fraisage à haute vitesse des alliages d’aluminium. Il a été trouvé que les conditions optimales d’usinage permettant de minimiser chacune des bavures diffèrent d’une bavure à l’autre. L’analyse des résultats montre que l’outil de coupe, l’avance et la profondeur de coupe ont une influence variable sur la taille des bavures formées lors du rainurage. Cependant, la plupart des bavures sont fortement influencées par les interactions entre les paramètres des procédés, ce qui complique d’avantage le développement des modèles de prédiction des bavures. Ces résultats peuvent aider pour des travaux subséquents portant sur le fraisage de précision des alliages d’aluminium ou d’autres alliages légers. Ensuite, un modèle analytique est proposé permettant de prédire l’épaisseur des bavures lors du fraisage des matériaux ductiles. Ce modèle est basé sur la géométrie de la bavure lors de la transition entre la formation des copeaux et la formation des bavures au cours de l’usinage et qui prend en compte l’effet de l’énergie de coupe impliquée dans le procédé. Un modèle numérique est aussi développé permettant de prédire l’épaisseur de la bavure de sortie en fraisage basé sur les paramètres de coupe et les propriétés du matériau telles que la limite
d’élasticité et les coefficients des forces spécifiques de coupe, qui sont les seuls inconnus dans le modèle. Les deux modèles (analytique et numérique) sont validés en utilisant les résultats expérimentaux obtenus lors du rainurage des alliages d’aluminium 2024-T351 et 6061-T6.
L’optimisation des paramètres d’usinage pour minimiser la taille des bavures peut avoir des effets négatifs sur d’autres caractéristiques de performance d’usinage tels que le fini de surface, la vie des outils de coupe et le taux d’enlèvement de métal. C’est la raison pour laquelle le fini de surface est aussi analysé en même temps que la formation des bavures dans cette étude. Pour sélectionner les meilleurs niveaux des paramètres du procédé d’usinage, une nouvelle méthode basée sur les surfaces de réponses et sur les fonctions de désirabilité est proposée et utilisée. La méthodologie proposée est validée sur la minimisation simultanée du fini de surface et de cinq types de bavures pendant le fraisage de l’alliage d’aluminium 6061-T6. Les résultats de cette optimisation démontrent le potentiel et la performance de la méthode proposée.
TABLE OF CONTENTS
Page
INTRODUCTION ...1
CHAPTER 1 LITERATURE REVIEW ...7
1.1 Introduction ...7
1.2 Definition and characterization of burr ...7
1.2.1 Burr formation mechanism ... 10
1.2.2 Burr shapes... 13
1.2.3 Burr size measurement and detection methods ... 16
1.2.4 Burr removal (deburring) ... 17
1.2.5 Concerns on burr formation ... 22
1.3 Understanding and modeling of milling burr formation ...23
1.3.1 Milling burrs shapes ... 23
1.3.2 Parameters governing milling burr formation ... 26
1.3.3 Milling burr formation modeling ... 32
1.4 Optimization methods ...38
1.4.1 Taguchi method ... 38
1.4.2 Response surface methodology (RSM) ... 39
1.4.3 Desirability function ... 39
1.5 Conclusion of literature review and refining of problematic ...40
CHAPTER 2 INVESTIGATION OF FACTORS GOVERNING SLOT MILLING BURR FORMATION ...43 2.1 Introduction ...43 2.2 Experimental procedure ...44 2.2.1 Experimental plan ... 44 2.2.2 Experimental observations ... 46 2.2.3 Assumptions ... 48
2.3 Results and discussion ...49
2.3.1 Method of analysis ... 49
2.3.2 Effects of process parameters on slot milling burrs ... 50
2.3.3 Response surface models ... 74
2.3.4 Controllable response... 82
2.4 Conclusion ...88
CHAPTER 3 MODELING OF BURR THICKNESS IN MILLING OF DUCTILE MATERIALS ...91
3.1 Introduction ...91
3.2 Theoretical modeling of milling burr thickness ...92
3.3 Experimental results and discussion ...99
3.4 Computational results and discussion ...103
CHAPTER 4 SIMULTANEOUS OPTIMIZATION OF BURR SIZE AND SURFACE
FINISH DURING SLOT MILLING OPERATION ...113
4.1 Introduction ...113
4.2 An overview of Taguchi Method ...115
4.3 Proposed methodology...116
4.4 Experimental results...123
4.4.1 Experimental procedure ... 123
4.4.2 Analysis of responses ... 124
4.5 Multiple responses optimization ...133
4.6 Experimental validation ...139
4.7 Conclusion ...142
CHAPTER 5 SUBSTANTIAL SUMMARY OF THE RESEARCH WORK ...143
5.1 Introduction ...143
5.2 Dominant process parameters on slot milling burrs size ...144
5.3 Controllable responses ...146
5.4 Milling burr size modeling of ductile materials ...147
5.5 Multiple responses optimization in slot milling...151
5.6 Key contributions and outcomes of the thesis ...152
CONCLUSION…. ...157
RECOMMENDATIONS ...159
ANNEX I CONFERENCE ARTICLE 1: BURR FORMATION DURING DRY MILLING OF WROUGHT ALUMINUM ALLOYS ...161
ANNEX II JOURNAL ARTICLE 1: FACTORS GOVERNING BURR FORMATION DURING HIGH-SPEED SLOT MILLING OF WROUGHT ALUMINUM ALLOYS ...163
ANNEX III CONFERENCE ARTICLE 2: STATISTICAL INVESTIGATION ON BURR THICKNESS DURING MILLING OF 6061-T6 ALUMINIUM ALLOYS ...165
ANNEX IV JOURNAL ARTILCE 2: MODELING OF BURR THICKNESS IN MILLING OF DUCTILE MATERIALS ...167
ANNEX V CONFERENCE ARTICLE 3: EXPERIMENTAL INVESTIGATION AND MODELING OF MILLING BURRS...169
ANNEX VI JOURNAL ARTICLE 3:
SIMULATANESOU OPTIMIZATION OF BURRS SIZE AND
SURFACE FINISH WHEN SLOT MILLING 6061-T6 ALUMINIUM ALLOYS ...171
ANNEX VII CONFERENCE ARTICLE 4: ANALYSIS AND OPTIMIZATION OF EXIT BURR SIZE AND SURFACE ROUGHNESS IN MILLING USING
DESIRABILITY FUCNTION ...173 BIBLIOGRAPHY ………..174
LIST OF TABLES
Page
Table 1.1 The most frequently used deburring processes ...19
Table 2.1 Experimental process parameters and their levels ...45
Table 2.2 Mechanical properties of studied aluminium alloys (Committee and Knovel, 2004)) ...46
Table 2.3 Statistical summary of results ...74
Table 2.4 Statistical summary of burr height models ...81
Table 2.5 Statistical summary of burr thickness models ...82
Table 2.6 Statistical summary of Ft designmodels ...86
Table 3.1 Cutting parameters and their levels ...100
Table 3.2 Experimental and modeling results ...101
Table 3.3 Statistical summary of regression models between experimental and modeled Bt ...103
Table 3.4 Experimental and simulated results when Z=3; D=19.05 mm; β=30̊ and vc =300m/min ...109
Table 3.5 Statistical summary of the regression models between experimental and simulated results ...109
Table 4.1 Cutting parameters and their levels ...123
Table 4.2 Experimental responses ...125
Table 4.3 Statistical results of responses ...133
Table 4.4 Response characteristic terms (n = 6 and N = 54) ...134
Table 4.5 ANOVA table for ηψ ...135
Table 4.6 Desirability of proposed setting levels of process parameters ...137
LIST OF FIGURES
Page
Figure 1.1 Examples of burr definition (Gillespie, 1996) ...8
Figure 1.2 Burr definition by ISO 13175 (Aurich et al., 2009) ...8
Figure 1.3 Measurement values of burr (Schäfer, 1975) ...9
Figure 1.4 Micrograph of the chip root showing the exit failure, negative shear and foot formation (Pekelharing, 1978) ...10
Figure 1.5 Burr/breakout formation model (Iwata, Osakada and Terasaka, 1984): (a) initiation, (b) development and (c) final burr formation ...11
Figure 1.6 Burr formation mechanism in ductile and brittle materials (Hashimura, Hassamontr and Dornfeld, 1999) ...13
Figure 1.7 Schematic of Poisson, Tear and Rollover burr (Gillespie, 1996) ...14
Figure 1.8 Types of machining burr (Aurich et al., 2009) ...15
Figure 1.9 Burr detection and measurement methods (Aurich et al., 2009) ...17
Figure 1.10 Example of machined part edges require deburring (adapted from (Gillespie, 1999)) ...18
Figure 1.11 Manual deburring (Tiabi, 2010) ...20
Figure 1.12 A robot arm combined with deburring brush (Means, 1986) ...21
Figure 1.13 Milling burr formation classification-location (adapted from (Hashimura, Hassamontr and Dornfeld, 1999)) ...24
Figure 1.14 Milling exit burr classification-shape ...24
Figure 1.15 Face milling burrs (Lee, 2004) ...25
Figure 1.16 Slot milling burrs (Lee, 2004) ...26
Figure 1.17 Major process parameters for FEM simulation of metal cutting (Sartkulvanich, 2007) ...36
Figure 2.1 Experimental devices: (a) 3-Axis CNC machine (b) Cutting tool used ...45
Figure 2.2 Optical microscope used for burr size measurement ...46
Figure 2.3 Profilometer used for surface roughness measurement ...47
Figure 2.4 Cutting forces in normal, axial and feed directions ...48
Figure 2.5 Slot milled machined parts with (a) burr formation with tiny scales; (b) large burr formation ...51
Figure 2.6 Pareto chart of (a) B1 height, (b) B1 thickness ...53
Figure 2.7 Pareto chart of (a) B2 height, (b) B2 thickness ...54
Figure 2.8 Direct effect plot of (a) B1 height, (b) B1 thickness ...55
Figure 2.9 Direct effect plot of (a) B2 height, (b) B2 thickness ...56
Figure 2.10 Slot milling exit burrs ...57
Figure 2.11 Interaction effect of tool - depth of cut (BC) on (a) B1 height and (b) on B1 thickness ...61
Figure 2.12 Interaction effect of depth of cut-cutting speed (CE) on (a) B2 height and (b) B2 thickness ...62
Figure 2.13 Pareto chart of (a) B5 height, (b) B5 thickness ...64
Figure 2.14 Direct effect plot of (a) B5 height, (b) B5 thickness ...65
Figure 2.15 Slot milling top burrs ...66
Figure 2.16 Pareto chart of (a) B4 height, (b) B4 thickness ...67
Figure 2.17 Pareto chart of (a) B8 height, (b) B8 thickness ...68
Figure 2.18 Direct effect plot of (a) B4 height, (b) B4 thickness ...69
Figure 2.19 Direct effect plot of (a) B8 height, (b) B8 thickness ...71
Figure 2.20 Interaction effect of material- feed per tooth (AD) on (a) B4 height and (b) B8 height ...72
Figure 2.21 Interaction effect of tool-cutting speed (BE) on (a) B4 thickness and (b) B8 thickness ...73
Figure 2.22 3D contour plot of burr thickness studied at optimum
cutting conditions ...77
Figure 2.23 3D contour plot of burr height at optimum cutting conditions ...80
Figure 2.24 (a) Pareto chart of B1 thickness in linear design model, (b) Direct effect plot of B1 thickness ...83
Figure 2.25 2 D contour plot of B1 thickness: (a) Tool 1, (b) Tool 2, (c) Tool 3 ...85
Figure 2.26 Pareto chart of Ft in linear design model ...86
Figure 2.27 Direct effect plot of Ft ...87
Figure 2.28 Exponential regression model between Ft and B1 thickness ...87
Figure 3.1 Slot milling burrs ...92
Figure 3.2 (a) Exit geometry in end milling; (b) geometry of burr initiation and formation (adapted from (Ko and Dornfeld, 1991)) ...93
Figure 3.3 Slot milling under orthogonal cutting conditions (adapted from (San-Juan, Martín and Santos, 2010)) ...96
Figure 3.4 Experimental and modeled Bt for AA 2024-T351(using Eq(3.20)) ...102
Figure 3.5 Experimental and modeled Bt for AA 6061-T6 (using (Eq(3.20)) ...102
Figure 3.6 Scheme of the proposed theoretical model for Bt prediction ...108
Figure 3.7 Experimental and simulated Bt for AA 2024-T351(using Eq(3.32)) ...110
Figure 3.8 Experimental and simulated Bt for AA 6061-T6 (using Eq(3.32)) ...110
Figure 4.1 Procedure of multiple responses optimization using Taguchi method ....122
Figure 4.2 Measurement overview of exit up milling side burr (B1) ...124
Figure 4.3 (a) Pareto chart and (b) main effect plot of B1 burr thickness ...127
Figure 4.4 (a) Pareto chart and (b) main effect plot of B2 burr thickness ...128
Figure 4.5 (a) Pareto chart and (b) main effect plot of B4 burr thickness ...129
Figure 4.6 (a) Pareto chart and (b) main effect plot of B5 burr thickness ...130
Figure 4.8 (a) Pareto chart and (b) main effect plot of surface roughness (Ra) ...132 Figure 4.9 Pareto chart of ηψ ...135
Figure 4.10 Main effect plot of ηψ ...136
Figure 4.11 3D contour plot of ηψ at cutting speed 300 m/min ...138
Figure 4.12 3D contour plot of ηψ atcutting speed 750 m/min ...138
Figure 4.13 3D contour plot of ηψ atcutting speed 1200 m/min ...139
Figure 4.14 Main effect plot of optimized ηψ ...141
Figure 5.1 The main and specific research objectives ...144 Figure 5.2 Variation of resultant cutting force during slot milling of
AA 2024-T351 ...150 Figure 5.3 Variation of resultant cutting force during slot milling of
AA 6061-T6 ...150 Figure 5.4 The links between main objective and specific research objectives ...155
LIST OF SYMBOLS
Symbol Units Description
Bt (mm or μm) Burr thickness
Bh (mm or μm) Burr height
ap mm Axial depth of cut
vc m/min Cutting speed
fz mm/z Feed per tooth
n rev/s Spindle speed
Z - Number of flutes/tooth
D (mm or μm) Tool diameter
θ (deg) Tool rotation angle
θp (deg) Cutter pitch angle
φj (deg) Immersion angle for flute j
h(φ) (mm or μm) Chip thickness
hm (mm or μm) Average chip thickness per revolution
γ0 (deg) Lag angle
Kc (N/mm2) Specific cutting force coefficient
Ks (N/mm2) Specific cutting force coefficient when hm = 0.2mm
Kte (N/mm2) Tangential edge force coefficient
Kre (N/mm2) Radial edge force coefficient
Kae (N/mm2) Axial edge force coefficient
Ktc (N/mm2) Tangential cutting force coefficient due to shearing action
Krc (N/mm2) Radial cutting force coefficient due to shearing action
Kac (N/mm2) Axial cutting force coefficient due to shearing action
∆ap mm Elements of thickness
dFt,j N Tangential force acting on a differential flute element j
Ft N Tangential force
Fr N Radial force
Fa N Axial force
Φ (deg) Shear angle
Rε (mm or μm) Insert nose radius
L (mm or μm) Tool chip contact length
λ (deg) Friction angle
µ - Friction coefficient
β (deg) Helix angle
θex (deg) Exit angle
θst (deg) Entrance angle
Ψ (deg) In plane exit angle
dx (mm or μm) Distance of the tool moved from onset of plastic hinging k0 (N/mm2) Yield shear strength
σe (N/mm2) Yield strength
∆Wb (Nm) Work done for burr formation at the transition point
∆Wc (Nm) Work done for chip formation at the transition point
Mp - Mapping function
ψ - Fitness mapping function
R - Range of a response
MR - Fitness mapping range
M - The Maximum of MR
ω - Weighting coefficient
μ Mapping coefficient
Yi - Non-identical response
m Mean value of responses
σ Standard deviation of responses
η - Signal to noise ratio
ηψ - Signal to noise ratio of fitness mapping function
di - Desirability of each response
Di - Desirability of all transformed responses
κ - Optimization rate
ε - Prediction error
t - Weight exponent value
F - F-ratio
P - P-value
DOF - Degree of freedom
MS - Mean of square
INTRODUCTION
As manufacturing processes become advanced, precision components require more attention for both surface and edge generation. More precise and burr-free components with tight tolerances and better surface finish are being requested. This is especially true in aerospace and automobile industries. High quality products must be precisely manufactured according to design specifications and at low manufacturing costs. To fulfill these requirements, the manufacturing process should be well understood and its parameters optimized.
A phenomenon similar to chip generation is burr formation, which is a common problem that occurs in several industrial sectors, such as aerospace, ship construction, automobile, etc. It has also been among the most troublesome impediments to high productivity and automation, which largely affects the machined part quality. Therefore it is beneficial to limit the burr formation rather than deburring in subsequent finishing operations. In fact, deburring is expensive, time consuming and is considered as a non-productive operation. Throughout intensive research works during the last decades, the knowledge on the mechanisms of burr formation and deburring is understood to a good extent, followed by introduction of comprehensive and integrated strategies for burr prevention and minimization. Despite of all achievements, there are still many challenges on understanding, modeling and optimization of burr formation process and size, by means of burr size minimization and consequently production growth and cycle time reduction.
Defining the problem
The burr formation process seems to be simple, but in fact, it is a highly complex phenomenon, involving many independent parameters that make the understanding of the burr formation mechanism more complicated. Most factors such as work part, tool, process and cutting conditions can have direct effects on burr formation. Other involved factors are machining instability due to vibrations, fluctuation of cutting forces and tool state (e.g. builds up edge formation, tool wear). Due to non-uniform chip thickness, tool runout and complex
interaction effects between cutting process parameters, the milling burr formation has a relatively complex mechanism than other machining modes, such as turning.
The main concerns when dealing with edge finishing are burr minimization and control and proper selection and automation of deburring operations. To avoid these undesirable expenses, burr size minimization and control are key factors. The burr size minimization or effectively burr prevention can be done through proper understanding of the basic mechanisms of burr formation and then studying the optimum cutting parameters. However it is a complicated task as burr formation is remarkably influenced by direct and interaction effects between process parameters.
One other approach for burr size minimization is to develop predictive models of burr size. To this end, the use of analytical and numerical methods is welcomed. Amongst numerical methods, finite element method (FEM) is a reasonable approach to model the metal cutting and burr formation processes (Toropov and Ko, 2006). Currently, the FEM is used to model the effects of cutting processes and process parameters on thermal and dynamic aspects of machining operations, computational assessment of tool and machined part geometry, residual stress, tools wear, chip and burr formation mechanism (Bansal, 2002). The main disadvantage of FE-burr formation models is that the obtained results are highly affected by the accuracy of input boundary conditions, which are not yet advanced and, therefore, are usually simplified. In addition, the results are dependent to software applied, time consuming and they usually require further experimental data for model (Niknam and Songmene, 2013).
Amongst machining operations, a few studies (Chern and Dornfeld, 1996; Ko and Dornfeld, 1996; Ko and Dornfeld, 1991) on analytical modeling of milling burr formation have been reported. Hence, most of the previous investigations have employed experimental approaches (Chern, 1993; Gillespie, 1976; Rangarajan and Dornfeld, 2004; San-Juan, Martín and Santos, 2010; Tsann-Rong, 2000). Amongst reported works on milling burr size modeling, none of them have dealt with slot milling burrs. Therefore, developing predictive models to simulate slot milling burrs size (mainly burr thickness) using material properties and cutting
parameters with no need to measure the burrs is certainly recommended. Special concentration should be paid to ductile materials such as aluminium alloys, which have a wide range of applications in automotive and aerospace industries.
As per author's knowledge, surprisingly except few works (Chen, Liu and Shen, 2006; Mian, Driver and Mativenga, 2011b; Tang et al., 2011), very low volume of information is also available on factors governing slot milling burr formation. This is due to complex mechanism of slot milling burrs that involves three modes with various shapes and geometries as feed direction burrs (entrance and exit burrs), sideward and cutting direction burrs, which appear in eight edges of the machined part. Furthermore, most of the existing research works in literature characterize the burr height, while from deburring perspective, the burr thickness is more of interest, because it describes the time and method necessary for deburring a workpiece (Aurich et al., 2009). Furthermore, only few studies (Lekkala et al., 2011; Mian, Driver and Mativenga, 2011b) used statistical tools to determine the dominant process parameters on milling burr formation.
In most of the machining operations more than one type of burr occurs. Optimizing those factors leading to minimal burr size could have detrimental effects on other machining performance index, such as surface finish. Thus the use of appropriate techniques for simultaneous multiple responses optimization is certainly recommended. According to (Dhavamani and Alwarsamy, 2011), Fuzzy logic (FL), genetic algorithm (GA), Neural Network (NN), Taguchi method and response surface methodology (RSM) are the latest optimization techniques that are being applied successfully in industrial applications. Amongst, Taguchi-based optimization and desirability function have produced a unique and powerful optimization discipline that differs from traditional techniques (Phadke, 1989). The original Taguchi method is designed to optimize a single response (Gaitonde, Karnik and Davim, 2009), while most of the products have multiple performance characteristics. Optimization of multiple responses in Taguchi-style experiments has received little attention, because Taguchi design can not be applied directly, as each performance characteristic may not have the same measurement unit. Hence, it is essential to propose new modifications to
original Taguchi method for multiple responses optimization, as limited modifications have been suggested so far (Kilickap, 2010).
Research objectives
The goal of this research project is to propose new strategies for understating, modeling and optimizing burrs during slot milling of aluminium alloys. The ultimate goal of this work is burr size minimization.
The specific research objectives can be summarized as follows:
1. To investigate the factors governing burr formation during slot milling of aluminium alloys.
2. To adapt and validate predictive models of burr size when milling ductile materials. 3. To suggest and validate new modifications to application of Taguchi method for
simultaneous multiple responses optimization during milling operation.
Structure of thesis
This thesis consists of five chapters. It starts with an introduction, followed by chapter one on literature review, three other chapters on various research tasks, and a chapter on substantial summary of the work presented, which links the outcomes of each chapter to proposed research objectives. Finally some conclusions, recommendations and future plans will be presented. The experimental conditions and parameters used in this research work are presented at the beginning of each chapter.
The thesis is organized as follows:
Chapter 1 presents a comprehensive overview on burr formation mechanism, prediction, minimization and removal. Special focus is paid to milling burrs characterization, modeling and minimization. This chapter also includes a review of burr size measurements and
detection methods. An overview of optimization methods is presented, followed by a conclusion of the literature review.
Chapter 2 presents a set of experimental works to understand the formation mechanism and dominant process parameters on five visible and large burrs during slot milling of 2024-T351 and 6061-T6 aluminium alloys (AAs). The factors investigated include the workpiece material, cutting tool coating and geometry, and machining parameters.
Chapter 3 presents an analytical model of milling burr size (thickness) in ductile materials based on the geometry of burr formation and the theory of energy conservation. A computational model is also adopted and validated to predict the thickest milling burr along exit up milling side. This model only requires the use of material properties and cutting parameters to predict the burr thickness.
Chapter 4 proposes new modifications and applications of Taguchi method for correct selection of optimum setting levels of process parameters for multiple responses optimization. The proposed approach is validated by simultaneous minimization of burrs size and surface finish in slot milling of AA 6061-T6.
Chapter 5 presents a substantial summary of research work presented in chapters 2-4. It allows linking the outcomes of this work and the previous studies, and helps clarifying certain aspects and shortcomings that were identified in the problematic and research objectives. The discussion also shows the achievements of this research work on improving certain aspects of science related to burr size minimization during slot milling of aluminium alloys.
CHAPTER 1
LITERATURE REVIEW
1.1 Introduction
Aluminium alloys are among the most machined metals. Machining of aluminium alloys features substantially higher cutting speeds and considerably lower cutting forces, as compared to that of steel (Zedan, 2011). The common alloying elements for aluminium are copper, silicon, manganese, zinc and tin. They are also classified as wrought or cast alloys depending on the processing used.
The major machinability assets related to aluminium alloys include tool life, chip characteristics, chip disposal, surface finish and burr formation. When proper conditions such as sharp cutting tools are used, aluminium alloys acquire a fine finish, thereby minimizing the necessity of protracted deburring and polishing operations. Burr formation is the main reason for tool change in milling of aluminium alloys (Rangarjan, 2005). Therefore, there is a growing need for minimizing burr formation that allows the use of cutting tools for a longer period of time and producing parts of higher quality. This led us to conduct research studies on understating, modelling and optimizing burrs size in slot milling of aluminium alloys.
1.2 Definition and characterization of burr
In current industry, there are still many concerns on workpiece geometries generated by industrial instruments. One of the main concerns is known as ‘Burr’.
According to (Aurich et al., 2009, p. 2):
“Burr is a body created in a workpiece surface during the manufacturing of a workpiece, which extends over the intended and actual workpiece surface and has slight volume in comparison with the workpiece, undesired, but to some extent, unavoidable”.
Gillespie’s burr definition (Gillespie, 1996) is limited to cutting and shearing processes. In his definition, all the materials extending pass the theoretical intersection of machined part surfaces correspond to burr (see Figure 1.1).
Burr Burr
Burr Theoretical workpiece edge
Figure 1.1 Examples of burr definition (Gillespie, 1996)
ISO 13715 defined the edges on a workpiece as burr (see Figure 1.2), if they have an overhang greater than zero (Aurich et al., 2009).
Figure 1.2 Burr definition by ISO 13175 (Aurich et al., 2009)
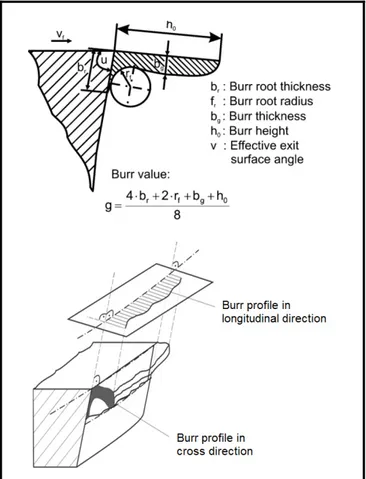
As can be seen in Figure 1.3, to better describe the burr, a new term called as “burr value” was defined in (Schäfer, 1975). It contains the burr root thickness (bf), burr height (h0), burr
thickness (bg) and burr root radius (rf). The burr root thickness (bf) is the thickness of the burr
root area measured in the cross-section. The burr height (h0) is defined by the distance
between the ideal edge of the workpiece and the highest point in the cross sectional area. The burr root radius (rf) is determined by positioning a circle to the burr root. The burr thickness
(bg) describes the thickness parallel to the burr root area at a distance of (rf), as measured in
the cross-section (Schäfer, 1975). The burr height and thickness are used to determine the tool replacement and schedule and also burr removal difficulties (Rangarjan, 2005). However the longitudinal profile of the burr is not highly informative in most cases, as it is rarely used to describe burrs. In addition it seems that the burr value can not be also used as an efficient parameter to better select the deburring method.
Figure 1.3 Measurement values of burr (Schäfer, 1975)
1.2.1 Burr formation mechanism
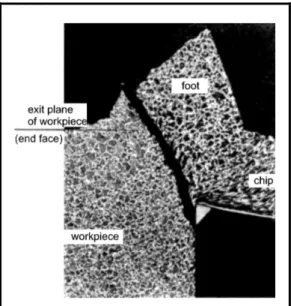
Pekelharing (1978) was the first person who described burr formation mechanism in metal cutting. He presented that negative shear is responsible for exit failure of cutting tools and root type burrs in milling (see Figure 1.4). The first fundamental work on burrs was published in (Gillespie, 1976). He developed an analytical model to illustrate burr formation mechanisms, which could predict burr properties.
Figure 1.4 Micrograph of the chip root showing the exit failure, negative shear and foot formation (Pekelharing, 1978)
Sofronas (1975) was among the first researchers who studied the burr formation mechanism. He stated that burrs are in general a result of plastic deformation flow during cutting process. Gillespie introduced six physical processes leading to burr formation (Gillespie, 1999):
1. Lateral flow of material (it occurs whenever a solid is compressed); 2. Bending of material (e.g. chip rollover);
3. Tearing of chip;
4. Redeposition of material; 5. Incomplete cut-off ;
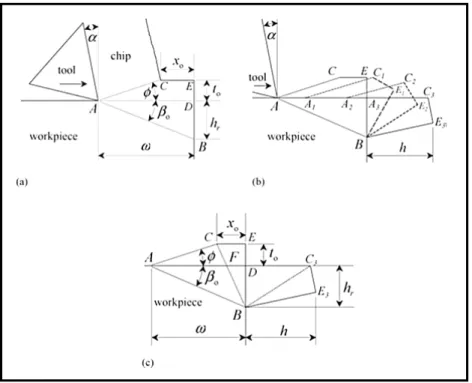
According to (Gillespie, 1999), processes 1-3 involve plastic deformation of the machined part. Flow of material into crack in sixth process happens during burr formation in molding or primary shaping. Burr formation mechanism in orthogonal cutting can be divided into three stages: (1) initiation, (2) burr development and (3) final burr formation. Initiation of burr formation is characterized by the “negative deformation angle” denoted as βo, and the
initial tool distance of the tool tip A from the end of workpiece, ω (see Figure 1.5(a)). Iwata et al. (1984) called AB as “negative deformation plane”. Nakayama and Arai (1987) have proposed a simple model of burr formation mechanism that includes the following three stages: (1) initiation, (2) transition and (3) push-out stage. Chern and Dornfeld (1996) proposed a model based on SEM observations of micro machining tests, which could perfectly predict the burr breakout.
Figure 1.5 Burr/breakout formation model (Iwata, Osakada and Terasaka, 1984): (a) initiation, (b) development and (c) final burr formation
According to (Hashimura, Hassamontr and Dornfeld, 1999), the burr formation mechanism is affected by mechanical properties of the workpiece, in addition to cutting conditions, such as
tool and workpiece geometry. This largely varies the burrs shape, locations and generation sources, especially when changing the workpiece. Therefore, the importance of burrs classification is evolved. Hashimura et al. (1999) classified the individual stages of burr formation for ductile and brittle materials (see Figure 1.6). From a certain stage of his model (stages 6-8), the burr formation is considered separately for ductile and brittle materials (see Figure 1.6). Stages 1–5 explain burr development without crack and stages 6–8 describe chip separation by crack propagation for ductile and brittle materials. In stage 6-I, crack initiates at the tool tip in the primary shear zone in a direction along the cutting line in ductile materials, which causes crack growth along primary shear zone (stage 7-I). The crack causes chip separation along the cutting line, therefore positive burr remains on the corner of the workpiece.
“The crack initiates at the tool tip in the negative shear zone and its propagation direction is towards the pivoting point (stage 6-II) in brittle materials. The induced crack in secondary shear zone causes chip separation from the workpiece. In stage 7-II, the crack grows along the negative shear zone. Moving along the cutting line, the tool induces crack growth and the crack mode may vary from shearing mode to opening mode. The workpiece edge also deforms slightly due to crack propagation. Stage 8-II indicates the end of burr formation in brittle materials. The crack separates the chip along with the part of the workpiece above the negative shear line. As a result, an area consisting of the fractured surface and a small amount of deformed material remains on the workpiece edge. In this case, the burr breaks out and is called a negative burr”(Aurich et al., 2009, p. 7).
Figure 1.6 Burr formation mechanism in ductile and brittle materials (Hashimura, Hassamontr and Dornfeld, 1999)
1.2.2 Burr shapes
Nowadays, there are several burr descriptions depending on application, manufacturing process, formation mechanism, shape and material properties (Aurich et al., 2009). Gillespie (1996) defined four main types of machining burrs as follows: Poisson burr, Rollover burr, Tear burr and Cut-off burr (see Figure 1.7). The Poisson burr is a result of the material’s tendency to bulge to the sides when it is compressed until the incidence of permanent plastic deformation (Nisbet and Mullet, 1978). Narayanaswami and Dornfeld (1994) called this phenomenon as side burr, because, according to engineering mechanics, “Poisson effect” is only present in the elastic range. The rollover burr is essentially a chip which is bent rather
than sheared resulting in a comparatively large burr. This type of burr is also known as an exit burr, because it is usually formed at the end of a cut. The tear burr is the result of material tearing loose from the workpiece rather than shearing clearly. It is similar to the burr formed in punching operations. The cut-off burr is resulted by workpiece separation from the raw material before the separation cut is finished (Gillespie, 1976).
Figure 1.7 Schematic of Poisson, Tear and Rollover burr (Gillespie, 1996)
Two types of burrs known as primary and secondary burrs were introduced by Kishimoto et al.(1981).
“Through proper selection of cutting conditions and tool geometry, the rollover burr will be separated at its thinnest portion, and only a small burr will remain on the edge of the machined part”(Aurich et al., 2009, p. 7).
According to (Aurich et al., 2009), the former and latter burrs are known as primary and secondary burrs, respectively. Beier (1999) described a secondary burr as remaining material at the edge of a part after deburring process. From (Aurich et al., 2009), secondary burrs formed after the breakage of the primary burrs. However, they are smaller than depth of cut,
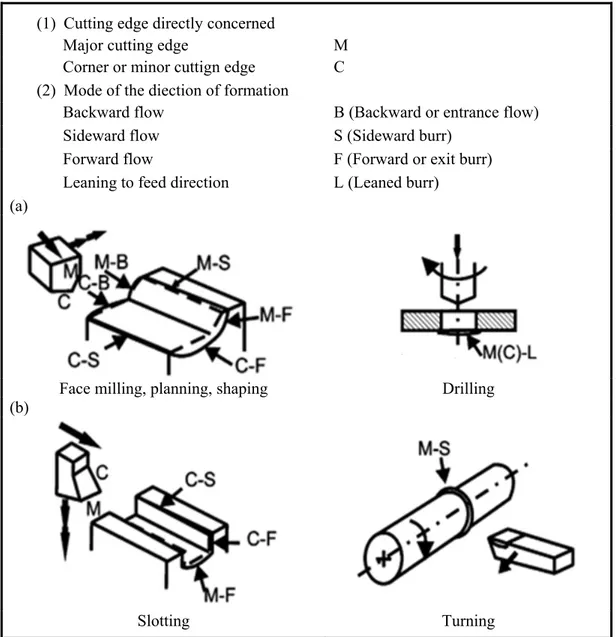
while primary burrs are larger (Kishimoto et al., 1981). Nakayama and Arai (1987) studied side burrs through experimental investigations. They described the burr formation in various machining processes by combining two classification systems as: (1) by direct concerning of cutting edge; (2) by mode and direction of burr formation. The various types of machining burrs are shown in Figure 1.8.
(1) Cutting edge directly concerned
Major cutting edge M
Corner or minor cuttign edge C (2) Mode of the diection of formation
Backward flow B (Backward or entrance flow)
Sideward flow S (Sideward burr)
Forward flow F (Forward or exit burr)
Leaning to feed direction L (Leaned burr)
(a)
Face milling, planning, shaping Drilling
(b)
Slotting Turning
Figure 1.8 Types of machining burr (Aurich et al., 2009)
1.2.3 Burr size measurement and detection methods
Due to the vital role of product quality, more attention has been paid to burr size measurement methods with particular attention on burrs geometrical characterization. The correct selection of burr size measurement methods depends on a number of factors such as the desired level of quality and requested measurement accuracy. However, according to (Aurich and Publica, 2006), over 71% of the interviewed companies still use the finger nail test for burr detection.
Three main burr size measurement systems are as follows: • Mechanical systems
• Electrical systems • Optical systems
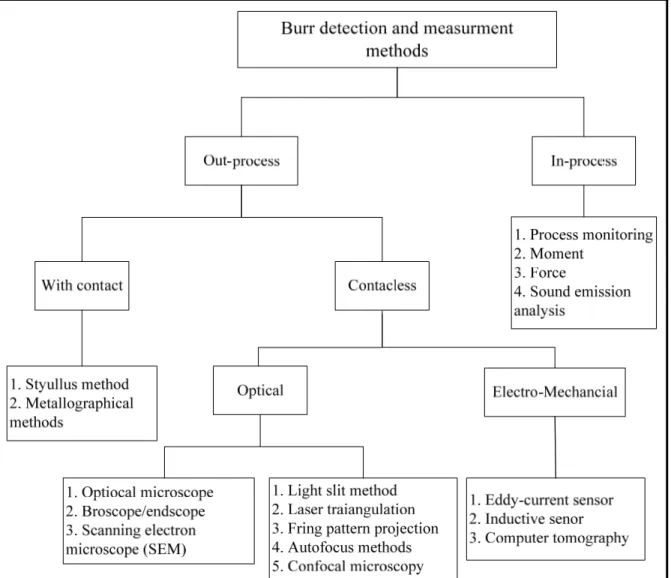
According to Figure 1.9, burr detection and measurement methods can be classified into in-process and out-in-process techniques. The out-in-process techniques can be further grouped to with contact and contactless methods. Burr formation can be monitored by using indirect and direct methods. Direct methods consist of laser, optical and ultrasonic sensors. There are many optical systems for burr size measurement and detection with successful industrial implementations, such as camera systems, microscopes, laser and interferometer (Ko and Park, 2006; Lee, Huang and Lu, 1993; Tsai† and Lu, 1996; Wulf and Hayk, 2007). However these systems are expensive and difficult to use, while indirect methods are more cost effective. Amongst indirect methods, several studies used electrical systems for burr size measurement using capacitive sensor, capable of online monitoring of burrs and also inductive sensor systems for quantitative burr characterization and metal parts edges evaluation (Jagiella and Fericean, 2004; Lee, Park and Dornfeld, 1996; Olvera and Barrow, 1998). In addition, (Kishimoto et al., 1981; Lee and Dornfeld, 2001) reported the use of silicon caoutchouc method to measure cross-sectional profiles of burrs using universal projector and AE as feedback sensing techniques in precision laser deburring process.
Figure 1.9 Burr detection and measurement methods (Aurich et al., 2009)
1.2.4 Burr removal (deburring)
Burrs have always been a serious concern in the surface and edge finishing of machined parts. According to (Gillespie, 1981), achieving an excellent edge quality when using deburring processes is often difficult. Even if the machined part is remarkably small, it may have several edges (see Figure 1.10), which require linear deburring, especially when machined part undergoes several operations.
Figure 1.10 Example of machined part edges require deburring (adapted from (Gillespie, 1999))
Deburring process classification
Several classifications of deburring processes were proposed in (Gillespie, 1999; Przyklenk, 1986; Schäfer, 1975). The most complete one was made in (Gillespie, 1999). It encompasses all deburring methods, starting by manual deburring using hands to high technology finishing systems using CNC and industrial robots. He has identified 122 deburring and edge finishing processes which can be classified under following categories:
1. Mechanical deburring processes; 2. Thermal deburring processes; 3. Chemical deburring processes; 4. Electrical deburring processes;
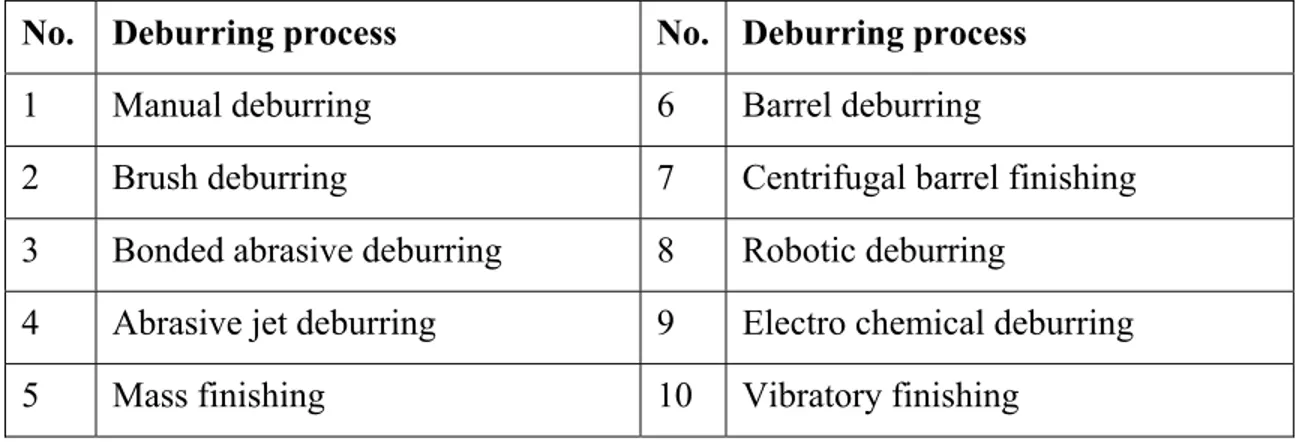
In order to achieve the best surface and edge finishing quality, the appropriate selection of deburring processes is essential. Gillespie (1999) has identified the most frequently used deburring processes (see Table 1.1).
Table 1.1 The most frequently used deburring processes
No. Deburring process No. Deburring process
1 Manual deburring 6 Barrel deburring
2 Brush deburring 7 Centrifugal barrel finishing 3 Bonded abrasive deburring 8 Robotic deburring
4 Abrasive jet deburring 9 Electro chemical deburring 5 Mass finishing 10 Vibratory finishing
Selection of deburring process
Most of deburring tools and processes are developed for materials with specific geometries. Therefore, correct selection of deburring process is essential. The first approach for deburring process selection was proposed in (Schäfer, 1975). Later, a software tool was developed for the same purpose (Ioi, Matsunaga and Kobayashi, 1981). In this tool, burr shape, surface roughness, workpiece properties, weight and volume were used to create the database. Thilow (2008) also introduced an industrial system for similar purpose. The available deburring processes for burr removal in aluminium parts are introduced in (Przyklenk and Schlatter, 1987). According to (Narayanaswami and Dornfeld, 1994), factors governing deburring complexity are burr location, size, and number of edges to be deburred. Furthermore, a clear knowledge on how deburring process itself affects the workpiece dimensions and surface quality is a crucial factor for correct selection of deburring process (Gillespie, 1999). Unfortunately, all reported deburring processes have certain levels of side effects on machined part. This thesis does not, however, try to present the main advantages, disadvantages and restrictions related to each deburring process. The following passages present the basic information on some of the highly used deburring processes in today’s industry.
Manual deburring
Manual deburring is still known as the most widely used operation for many reasons, including extreme flexibility, low cost and lack of technology needed. According to (Gillespie, 1999), manual deburring is associated with wasting of time and asset, fatigue, frustration, etc. Moreover, in most of the industrial sectors, manual deburring is implemented in dry conditions by non-qualified operators (see Figure 1.11). This consequently increases the waste rate and delay in production lines.
Figure 1.11 Manual deburring (Tiabi, 2010)
Mechanical deburring
During mechanical deburring processes, the burrs are reduced or removed by mechanical abrasion. The use of dry blasting for automatic deburring is examined in (Mchugh, 1988). Chen et al. (1991) presented a dynamic model for burr removal with a cooperative brushing tool. A deburring method for milled surfaces was proposed in (Anzai et al., 1993). In this work, an inductor producing a co-current magnetic field is adapted to the milling spindle. Ultrasonic deburring was investigated in (Lee et al., 2004). More mechanical deburring systems were also recently developed (Avila et al., 2004; Beier and Nothnagel, 2004).
Robotic deburring
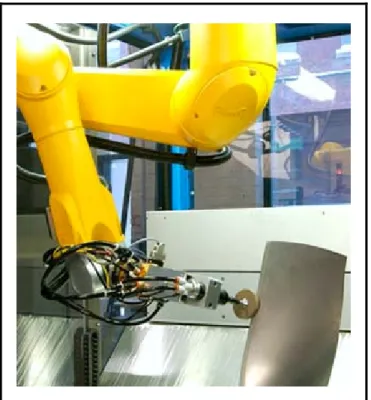
Robotic deburring is used to reduce the work load and guarantee an adequate workpiece quality level.The use of robots for deburring operation was reported in (Asakawa, Toda and Takeuchi, 2002; Lee, Huang and Lu 2001). In (Asakawa, Toda and Takeuchi, 2002), automatic chamfering of a hole on a free-curved surface is presented on the basis of CAD model using an industrial robot. Different deburring processes are applied by robots with various difficulties in each case (Aurich et al., 2009). Amongst, an overview of a robot arm combined with deburing brush is depicted in Figure 1.12. Hirabayashi et al. (1987) presented deburring robots equipped with force sensors for automatic deburring of elevator guide rails. A framework for robotic deburring applications in various industrial sectors was proposed in (Oliveira and Valente, 2004).
Figure 1.12 A robot arm combined with deburring brush (Means, 1986)
1.2.5 Concerns on burr formation
Recent studies have shown tremendous concerns on burr formation and deburring operations as follows:
1. Small finger injuries for assembly workers.
2. Source of debris (bits of burrs) during operation, thereby reducing the life time of the machined part.
3. Changing the parts resistance and reduce the tool life as well as efficiency (Ko and Dornfeld, 1991).
4. Presenting a hazard in handling of machined parts, which can interface with subsequent assembly operations.
5. The adhered burrs to the work part may become loose during operation and consequently cause difficulties and damages.
After a basic understanding of the mechanisms underlying the burr formation, the focus of research works has turned to deburring operations, which are in fact expensive, time consuming, non-productive and non-value added processes. As pointed out in (Gillespie, 1999), deburring and edge finishing of precision components may constitute as much as 30% of the cost of the finished parts. In practice, it is often necessary to combine several deburring and edges finishing processes to achieve the desired edge accuracy and surface finish requirements. In fact, the secondary finishing operations are difficult to automate, therefore may become a bottleneck in production lines (Gillespie, 1996).
In a recent study by Aurich et al. (2009) the costs are estimated up to €500 million per year only in Germany. According to (Gillespie, 1999), deburring concerns both the edges and surfaces of the workpiece. Furthermore, presence of burrs in manufactured components is a serious concern in terms of customer and supplier relations, as generally products are stamped as “sharp edge free’ or “free of burrs”. Then, it is recommended to limit burr formation rather than deburring them in subsequent finishing operations. In many cases,
increasing the burr size is a key element of tool wear, leading to replacing of cutting tools that are otherwise still operating without problem (Aurich et al., 2009).
Deburring side effects usually appear on the dimensions, surface finish, cleanliness, flatness, plating, soldering, welding, residual stress, surface imperfection, corrosion rate, fatigue resistance, electrical resistance, luster and color of the machined part. Proper understanding of the basic mechanisms of burr formation and then correct selection of optimal cutting parameters are strongly suggested for burr size minimization.
1.3 Understanding and modeling of milling burr formation
1.3.1 Milling burrs shapes
Milling burrs are created when cutting tool enters and exits the machined parts. Hashimura et al.(1999) classified milling burrs according to their location and formation mechanism (see Figure 1.13). As can be seen in Figure 1.14, a nomenclature to classify exit burrs was proposed in (Chern, 1993; Hashimura, Hassamontr and Dornfeld, 1999). Under certain cutting conditions, large burrs are formed that pose difficulties for deburring operations. These large burrs are usually generated along the cutting direction and their height is consistent and approximately equal to depth of cut. In some cases, a burr is separated in its thinnest part, leaving only a small portion adhered to machined part surface. The burr height in this case is much smaller than the depth of cut.
According to Figure 1.15, the face milling burrs are considered as a two-dimensional (2D) problem, generated as cutting tool follows its path through the machined part. The main face milling burrs are exit burr, side burr, and top burr, which are created respectively along (1) the edge between the machined surface, (2) the edge between the transitional surface and the exit surface, and (3) the edge between the top surface and the transition surface (Lee, 2004).
Figure 1.13 Milling burr formation classification-location (adapted from (Hashimura, Hassamontr and Dornfeld, 1999))
Figure 1.14 Milling exit burr classification-shape
Burr formation mechanism in end milling and slot milling operations are even more complex than the one in face milling. Unlike in face milling, subsequent tools passing through do not usually remove the burrs produced by previous tools in end milling. As a result, side burrs and top burrs are stocked on the part, possibly leading to several problems. In slot milling operation, entrance burrs along up milling side and entrance burrs are smallest in size. The top burrs along up/down milling sides and entrance and exit burrs along down milling side are on a medium-scale, comparatively.
As shown in Figure 1.16, the exit burr along up milling side and exit bottom side burr are the largest burrs (Chen, Liu and Shen, 2006). Considering the smaller size of entrance burrs as compared to exit burrs, more focus has been paid to understand the mechanism of burr formation at the exit zone of the milling process. Therefore, series of experiments were conducted by varying different factors in sequence to observe the variation of exit burrs (Gillespie, 1976; Shaw, 1984; Tang et al., 2011; Tsann-Rong, 2000).
Figure 1.15 Face milling burrs (Lee, 2004)
List Burr name B1 Exit up milling side
B2 Exit bottom side
B3 Exit down milling side
B4 Top down milling side
B5 Entrance down milling side
B6 Entrance bottom side
B7 Entrance up milling side
B8 Top up milling side
Figure 1.16 Slot milling burrs (Lee, 2004)
1.3.2 Parameters governing milling burr formation
Burr formation is considered as a crucial industrial concern. The previous studies have shown that it is almost impossible to avoid burr formation (Tiabi, 2010). Burr formation studies under following situations are much of interest:
1. Situations where burr size minimization is demanded;
2. Situations where regulation and standardizing the burrs are demanded; 3. Situations where burr removal (deburring) is demanded;
To examine these situations, it is necessary to monitor the burr formation behavior with respect to changes made in cutting conditions. Gillespie and blotter (1976) observed that burrs cannot be prevented by only changing the feed rate, cutting speed and tool geometry. According to (Aurich et al., 2009; Sofronas, 1975; Tseng and Chiou, 2003), the principle factors governing milling burr formation are as follows:
1. Machined part (geometry, dimension, mechanical properties, etc.); 2. Cutting parameters (cutting speed, feed rate, depth of cut, etc.);
3. Cutting tool (material, shape, geometry, rake angle, lead angle, helix angle, etc.); 4. Machine tool (rotational speed, dynamic strength, etc.);
5. Manufacturing strategy (tool path, coolant, back cutting, lubrication, MQL, etc.); 6. Other parameters (e.g. cutting forces);
However, this summary is still inadequate due to complex interaction effects between process parameters, as their degree of influence on burr formation vary considerably by simple addition or removal of cutting parameters and/or changing the material. In other words, the dominant process parameters on burr formation cannot consistently be separated into direct and indirect factors (Aurich et al., 2009). The following passages present the dominant process parameters on milling burr formation mechanism and size.
Machined part (workpiece)
The machined part properties (e.g. chemical, mechanical) have significant effects on burr formation process. The dominant mechanical properties usually reported in the literature are hardness, ductility, yield strength and elongation (Leopold and Wohlgemuth, 2010). According to (Aurich et al., 2009), a burr forms if the material escapes the cutting process and occurs at tool entry and exit. This has led to following outcomes:
• Larger burrs tend to be formed with increase in the material ductility.
• Burr formation reduces, if the material is restricted to deform in the force direction.
The most commonly used materials in aerospace industries are aluminium alloys, titanium alloys, nickel based alloys and composite materials. Some of these materials such as aluminium alloys are ductile. Ductility is one of the most important material property (Leopold and Wohlgemuth, 2010). According to (Kim and Dornfeld, 2002), machining of ductile materials tends to form larger burrs, particularly at higher levels of cutting speed and feed rate. However, when the material is brittle, fractured burrs are formed on the edge part. This phenomenon can be reinforced at higher cutting speed and feed rate, creating irregular burrs. The metallographic characteristics of machined part could influence the burr
formation, as the orientation of the machining direction could metallographically generate less distortion; consequently less burr formation is anticipated (Kim and Dornfeld, 2002).
Workpiece geometry
The workpiece edge angle is the most prominent geometrical element of the workpiece that highly affects the burr formation mechanism. According to (Przyklenk, 1986), cutting tests on the edge angle lower than 90º generate long and thin burrs, while short and thick burrs are formed on the parts with edge angle of 90º or larger.
Surface treatment
According to (Sofronas, 1975), the burr size increases with increase in the ratio of the chip and workpiece shear stress (τc/τw). To reduce the burrs size, either, there should exist an
increase in the shear stress of the part (τw), or decrease in shear stress of the chip (τc). The
disadvantage of this method is that cracks may develop in hardened surface part, causing difficulties in controlling of the burr formation process. Increase the temperature hardens most of the materials and consequently affects the machining and deburring performance, even if the created burrs are small. According to (Gillespie, 1999), an attempt to prevent plastic deformation reduces the incidence of burr formation. His proposed methods include laser treatments, hard machining, localized mechanical processes, chemical and thermal treatments. In addition, chamfering on the external edges of the machined part before cutting operation is an excellent approach to prevent the material deformation at the part edge and consequently burr size reduction (Tiabi, 2010).
Cutting Conditions
According to (Avila and Dornfeld, 2004), burr height irregularly varies when changing cutting conditions. Increase the cutting speed led to reduced burr size. In addition, milling operations at higher levels of feed rate reduces the burr size, while creating secondary burrs
that are easier to remove. From (Rangarajan, 2001), when the machined part surface is hardened in high speed machining, a transition from ductile to brittle behavior may occur. This phenomenon may lead to decreased burr height. Chern (1993) analyzed the burr formation during face milling of aluminium alloys. He found that secondary burr formation is dominated by depth of cut and feed rate. Nakayama and Arai (1987) revealed that the burr size can be reduced by limiting the undeformed chip thickness. The cutting conditions, tool and workpiece geometry may reduce the shear strain supported by the chip. Therefore, burr reduction may occur. Kim and Dornfeld (2002) showed that higher levels of depth of cut increases the burr size, subjected to other cutting parameters used.
According to (Tseng and Chiou, 2003), milling burrs are considered as Poisson burrs, which are not highly effected by cutting conditions. Wang and Zhan (2003b) stated that the burrs height in cutting direction are reduced with increase in the depth of cut, feed rate, cutting edge angle and back rake angle. Furthermore, the use of larger corner radius led to longer burr. According to (AM De Souza et al., 2003; Schäfer, 1978), lower level of feed rate led to reduced burr size. Contrary, (Jones and Furness, 1997; Kishimoto et al., 1981; Wang and Zhang, 2003b) found that higher level of feed rate reduces the burr size. This exhibits that the outcomes of experimental studies are not always similar. Olvera and Barrow (1998) found that exit angle and depth of cut influence the exit burr in the cutting direction, whereas depth of cut is the main factor affecting the exit burr in the feed direction. According to (Olvera and Barrow, 1996; Shefelbine and Dornfeld, 2004a), the use of high levels of axial depth of cut (ap) increases the possibility of burr size reduction, but, it may also cause inevitable damages
to cutting tool, machine and machined part functionality. Therefore, the use of very high and/or low levels of cutting parameters is not suggested during milling operation. In order to reduce the costs and increase productivity, the use of optimization methods for correct selection of process parameters is strongly recommended.
Cutting tool geometry
According to (Bansal, 2001), the use of larger axial rake angle and smaller lead angle led to smaller burrs. Larger nose radius increases the incidence of burr formation (Aurich et al.,
2009). Avila and Dornfeld (2004) showed that tool geometry and in-plane exit angle Ψ have significant effects on burr size and edge breakout during face milling of aluminium-silicon alloys (AlSi9Cu3 and AlSi7Mg). Tripathi and Dornfeld (2006) reported the possibility of burr free condition when using diamond end mill tools at high cutting speed. According to (Gillespie and Blotter, 1976), the use of sharp cutting edge tools with positive rake angle avoids built up edge (BUE) formation ,thus reduces burr size. According to (Jones and Furness, 1997), milling tests with the exit angle of 76○-118○ generate smaller burr, while Luo et al. (2008) showed that the largest burrs were created in exit angle of 90○.This exhibits that defining the optimum exit angle for burr size minimization in milling operations is a difficult task.
Machining strategy
According to (Chu and Dornfeld, 2004; Wang and Zhang, 2003a), correct selection of machining strategy has positive effects on burr formation mechanism. The main machining strategies proposed until now include:
1. Optimization of the tool path planning, including machining direction and the tool engagement angle;
2. Using inserts and backup materials; 3. Using modified cutting parameters; 4. Using coolant and lubrication;
Tsann-Rong (2000) reported that the burr height is strongly dependent on the milling process. According to (Olvera and Barrow, 1998), the exit angle and tool nose geometry have significant influences on exit burrs characteristics. Bansal (2002) found that the use of milling inserts with positive axial rake and negative radial rake angles result in a good trade-off between small burr size and good surface quality. As to an improved tool path, this approach is also limited, as complex geometries would require optimized tool paths and higher cycle time (Aurich et al., 2009). Luo et al. (2008) revealed that the friction angle becomes larger with increase in exit angle and oblique cutting angle. This led to longer exit