Publisher’s version / Version de l'éditeur: CHC Technical Report, 2002-04
READ THESE TERMS AND CONDITIONS CAREFULLY BEFORE USING THIS WEBSITE.
https://nrc-publications.canada.ca/eng/copyright
Vous avez des questions? Nous pouvons vous aider. Pour communiquer directement avec un auteur, consultez la
première page de la revue dans laquelle son article a été publié afin de trouver ses coordonnées. Si vous n’arrivez pas à les repérer, communiquez avec nous à PublicationsArchive-ArchivesPublications@nrc-cnrc.gc.ca.
Questions? Contact the NRC Publications Archive team at
PublicationsArchive-ArchivesPublications@nrc-cnrc.gc.ca. If you wish to email the authors directly, please see the first page of the publication for their contact information.
For the publisher’s version, please access the DOI link below./ Pour consulter la version de l’éditeur, utilisez le lien DOI ci-dessous.
https://doi.org/10.4224/12328748
Access and use of this website and the material on it are subject to the Terms and Conditions set forth at
Testing the Compressive Strength of Sea Ice with a Borehole Jack: Third Season
Frederking, R.; Johnston, Michelle; Timco, Garry
https://publications-cnrc.canada.ca/fra/droits
L’accès à ce site Web et l’utilisation de son contenu sont assujettis aux conditions présentées dans le site
LISEZ CES CONDITIONS ATTENTIVEMENT AVANT D’UTILISER CE SITE WEB.
NRC Publications Record / Notice d'Archives des publications de CNRC: https://nrc-publications.canada.ca/eng/view/object/?id=37c6a25b-d19a-40ee-ae77-c2a5d7c0e68c https://publications-cnrc.canada.ca/fra/voir/objet/?id=37c6a25b-d19a-40ee-ae77-c2a5d7c0e68c
TESTING THE COMPRESSIVE STRENGTH OF SEA ICE
WITH A BOREHOLE JACK: THIRD SEASON
FIELD INSTRUCTIONS FOR DECAYED ICE STRENGTH
TESTING SPRING/SUMMER 2002
R. Frederking and M. Johnston
Canadian Hydraulics Centre National Research Council
Technical Report HYD-TR-05 April 2002
TESTING THE COMPRESSIVE STRENGTH OF SEA ICE
WITH A BOREHOLE JACK: A THIRD SEASON
FIELD INSTRUCTIONS
FOR DECAYED ICE STRENGTH TESTING
SPRING/SUMMER 2002
R. Frederking and M. Johnston Canadian Hydraulics Centre National Research Council of Canada
Ottawa, Ont. K1A 0R6 Canada
Technical Report HYD-TR-05
ABSTRACT
This report was prepared as part of a joint research project between Canadian Ice Service and Canadian Hydraulics Centre. During the project the properties of level Arctic sea and ridged sea ice will be measured in late spring and early summer 2002. The third season of measurements will be made on decaying level ice. The 2002 field program involves an added component; intermittent measurements of the properties of ridged ice will be made. This report provides instructions on measuring and documenting the properties of decaying first year sea ice. Outlined is a procedure by which the confined compressive strength of sea ice is measured with a borehole jack. Also included are instructions pertaining to measurements of ice thickness, ice temperature, density, salinity, freeboard and snow depth.
TABLE OF CONTENTS
1. Borehole Jack Test Protocol for Level Ice ...1
1.1 Pre-Test Preparations...1
1.2 Field Test Procedure for Level Ice...1
2. Borehole Jack Test Protocol for Additional Level Ice Sites...6
3. Borehole Jack Test Protocol for Ridged Ice (June measurements)...6
4. In-situ Temperature Measurements in Level Ice and Ridged Ice ...7
5. Hushh Pup Pump...8
6. Data Sheet for Decayed Ice Program 2002... 10
7. Campbell Scientific System... 11
1.3 Setting up PC208W on Personal Computer (normally, needed only once)... 11
1.3.1 Setting up the Data Logger with PC208W... 11
1.3.2 Setting up Storage Module (SM716) with PC208W... 11
1.3.3 Storing Program in Storage Module ... 11
1.4 In-Camp Operations Each Day Before Field Tests ... 12
1.4.1 Powering up and Downloading Program to Data Logger ... 12
1.4.2 Synchronizing the Clock ... 12
1.5 On Ice Operations at Test Site: Before Testing ... 13
1.5.1 Start Logging ... 13
1.5.2 Display Output on the Keypad ... 13
1.5.3 Stop Logging ... 14
1.6 In Camp Operations: Post Test and Back in Camp ... 14
1.6.1 Downloading data from Storage Module (SM716) to computer ... 14
1.6.2 Viewing data ... 15
1.6.3 Erasing data from Storage Module... 15
1.7 Miscellaneous Information... 15
1.7.1 Physically Connecting Data Logger, CR10 to Computer ... 15
8. Campbell Box Wiring Diagrams... 16
Power Supply ... 16
9. Julian Day Calendar for 2002 ... 18 Appendix A Example... A-1 List of Contacts... A-3
LIST OF FIGURES
Figure 1 Measurements of ice thickness, freeboard and snow depth ...5
Figure 2 Top view of Hushh-pup pump ...8
Figure 3 Hushh-pup pump and cable for pressure transducer ...9
Figure 4 Borehole jack face and cable for displacement gauge...9
Figure 5 Sample data sheet ... 10
Figure 6 Photograph of Campbell Scientific data logging box ... 17
Figure 7 Internal connections in Campbell Scientific box... 17
TESTING THE COMPRESSIVE STRENGTH OF SEA ICE
WITH A BOREHOLE JACK: A THIRD SEASON
FIELD INSTRUCTIONS, SPRING/SUMMER 2002
1.
Borehole Jack Test Protocol for Level Ice
1.1 Pre-Test Preparations
1) Assemble borehole jack, hoses, pressure gauge, transducer and pump in camp. 2) Attach pressure cable and displacement cable to white Campbell box.
3) Check that Campbell logger battery voltage is greater than 10.5 V. (see included Campbell instructions)
4) Prepare Campbell logger and set the time on the data logger (CR10) with the keypad. (see Campbell instructions). Keypad may be left connected and inside enclosure en route to site.
5) Run pump to extend and retract jack (note readout on Campbell logger keypad). 6) Place white logger enclosure in aluminum shipping box.
7) Place assembled borehole jack system on Komatik.
It is preferable to leave the borehole jack assembly connected when not in use. By
leaving the assembly connected, the operator avoids getting snow and ice into the quick couple connectors (debris in the connections causes problems with oil flow). At the
beginning of each test day, please check the hydraulic and electrical connections to make sure that they are tight!
1.2 Field Test Procedure for Level Ice
1) Pick sample area of level, uniform sea ice, about 500 m by 500 m.
Ice should be level with no sign of roughness or pressure ridging. Also pick an area with a moderate snow thickness.
The sample area will be used for the borehole jack tests that are conducted throughout the decay season; borehole jack tests will be done repeatedly (at various test sites) within the 500 m x 500 m sample area. There will be (roughly) two test sites per week in the sample area in level ice. Every test site should be at least 5 m from the test site used on the previous day.
2) Connect cable for pressure transducer and cable for displacement transducer directly to Campbell Scientific logger.
4) Check (with the keypad) that logging program has been downloaded from the storage module to the Data logger (*0 should give “LOG1”, as opposed to “LOG”).
5) Select where the three boreholes are to be drilled.
Boreholes should be in a circular pattern and about 1.5 to 2.0 m apart. Tests will be conducted in three separate holes at every (bi-weekly) test site. 6) Provide some shade before starting the borehole jack tests.
Place the wooden core holder in the shade, so that the extracted ice core will not be exposed directly to the sun.
7) Measure the (undisturbed) snow depth at each test hole. Record on Data
Sheet.
8) Shovel the snow from around the test hole Clear enough area to stand in comfortably.
9) As soon as the ice surface has been exposed, measure the ice surface
temperature. Record the ice surface temperature on the Data Sheet.
Drill a shallow hole in the surface and insert the Fluke Multi-meter). The Fluke should stabilize quite quickly.
10) Measure the ice thickness and freeboard (Figure 1). Record on the Data Sheet. A 1.6 m rod (with an attachment on the end) has been provided to measure the ice thickness.
Freeboard should be measured precisely by placing the wooden straight edge across hole and measuring down to the water surface with the ruler on a pair of calipers.
11) Use 15 cm diameter corer to make a borehole in the ice. 12) Take a full thickness ice core.
If several tries are required to take a full thickness core, remember to process the core piece that you have BEFORE adding the extension rod to the corer and taking subsequent pieces.
14) Process ice core (as required):
Core from Borehole #1:
q First core is used for ice temperature profile:
⇒ Use the Fluke Multimeter with attached temperature probe to measure ice core temperatures. Ice temperature should be
measured as quickly as possible to avoid atmospheric effects. ⇒ One person should mark and drill holes in the core at 15 cm
intervals, while the next person inserts the temperature probe into the
holes and records the temperature on Data sheet.
⇒ The temperature probe should remain in the ice between
consecutive holes (rather than leaving the probe exposed and taking extra time to come down from the air to ice temperature).
⇒ Record measurements on Data sheet.
Core from Borehole #2:
q Second core is used for salinity measurements.
⇒ Discs 2 cm salinity samples should be cut at 15 cm intervals. The ice core must be sectioned and bagged immediately for
accurate salinity measurements.
⇒ One person can cut the core while the other puts the 2 cm disc it into labeled bags (preferably double bag samples and don’t reuse bags).
⇒ The salinity bags should be labeled in camp before moving to the test site.
⇒ Back in camp, measure ice salinities with the Orion digital
salinometer.
⇒ Record measurements on Data sheet.
Core from Borehole #3:
o If you are not at testing level ice at the main site, the third core is not used for measurements and can be discarded.
o If you are testing level ice at the main site, you can use the third core for density measurements (if there is time and if a bandsaw is available). See instructions below:
⇒Brine drainage occurs immediately!
⇒ The core should be sectioned very quickly for accurate ice density measurements.
⇒ Make density samples about 10 to 15 cm long (by cutting ice with bandsaw).
⇒One person should section the ice while the other places the density samples in bags immediately after they have been sectioned. ⇒ Weigh the samples (and any brine that has accumulated) in their bags.
⇒ Remove the sample from the bag and measure the length and diameter (at least four different values) of the sample.
⇒ Record measurements on Data sheet.
15) Lower jack into hole to a depth of 0.30 m. Note orientation of jack (when
possible).
16) Start Data logger with Keypad (see instructions in back of report)
17) Note start time of data logger on Data Sheet.
18) Display output for the displacement (mV) on the keypad (see instructions at
back of report).
Do not look to the keypad to provide an indication of pressure. Rather, read
pressure from the pressure dial close to the pump.
19) Start the pump.
Put switch on pump in the down position. In that mode you can use the hand held device to activate the jack.
20) Set large, black pump lever to Extend position.
21) Activate jack by pressing the button on the hand held device.
22) Monitor displacement output on the keypad (channel #1, see instructions in back of report).
THE FULLY RETRACTED JACK (0 MM EXTENSION)
SHOULD READ 89 MV ON THE KEYPAD.
THE FULLY EXTENDED JACK (50 MM MAXIMUM EXTENSION)
SHOULD READ 2200 MV ON THE KEYPAD.
23) Stop the borehole jack test just before the maximum jack extension is approached (2200 mV). Terminate test if the readout on the pressure dial gauge stops increasing (or starts to decrease).
24) Switch lever to Retractposition and immediately retract jack.
Listen for free running sound of pump when jack is fully retracted. Move the lever to the neutral position
NOTE: IF PRESSURE ON DIAL GAUGE REACHES 35 MPA,
STOP PUMP AND RETRACT. SEA ICE SHOULD NOT BE THIS STRONG – YOU HAVE
⇒ NOTE: Tests at each depth in a single borehole take less than 5 minutes. Assuming 4 to 5 tests per hole, the testing should be completed in 1½ to 2 hours. If you plan to do density measurements, allow additional time!
25) Loosen jack in hole, rotate 90oand lower to next depth, 0.60 m.
26) Repeat steps 19 to 25. 27) Stop data logger.
You should have four different tests (from 0.30 to 1.2 m) that give a depth profile of borehole strength for that borehole.
28) Put the core pieces back into the hole. 29) Move to location of second borehole. 30) Repeat steps 12 to 28.
31) Move to location of third borehole location. 32) Repeat steps 12 to 28. 150 mm bore hole ICE ICE freeboard
sea water surface
straight edge
snow depth
ice thickness ice core removed
from borehole Ice Thickness cm precision Freeboard: mm measuring precision Snow depth: cm precision
: measure from straight edge on ice surface,
measure with rulers on caliper from lower edge of straight edge to water surface.
measure undisturbed snow depth with meter stick
use 1.6 m ice thickness rod provided,
2.
Borehole Jack Test Protocol for Additional Level Ice Sites
In the past two seasons, measurements have focused solely upon level, first year sea ice in a specific location. This year, the program will be expanded to include conducting property measurements and borehole jack tests once again at a main site near camp, but also at up to five additional areas of level first year sea ice. The additional areas of ice will be selected as areas of ice in RADARSAT imagery that have interesting microwave signatures. A fixed wing aircraft (and helicopter) will be used to visit the additional level ice sites up to four times during the sampling season.
The Borehole Jack Test Protocol discussed in the previous pages should be adhered to when conducting measurements at these additional ice sites.
3.
Borehole Jack Test Protocol for Ridged Ice (June measurements)
Obtaining intermittent strength measurements in an area of ridged or deformed first year ice is part of this year’s field program. Ridged ice will require considerably more time for drilling and testing than level ice. For that reason, it is suggested that the properties of ridged ice be measured only in June. During the month of June, a person from Canadian Ice Service will be in charge of conducting borehole jack measurements in level and ridged ice.
As the ridged ice is being drilled with the 15 cm diameter corer, it would be useful to note how the cutting is progressing. Ridged ice is an inhomogeneous mixture of ice blocks that provides different resistances to the core barrel cutter. Large voids can be experienced when drilling through ridged ice, in which case the corer would push through the gap very easily. It would be useful to note when the voids occurred during coring. The core operator can call out the cutting resistance (approximate ice depth) to another person who is taking notes.
Similarly, the core from ridged ice will be very fragmented. It may be difficult to piece together the extracted cores. Try to remember where the voids in the ice occurred when piecing together the core and marking depths on the core (for salinity and temperature measurements).
When measuring ridged ice, follow the same protocol as required for measurements in level ice. Because testing in ridged ice is more involved than level ice, it is suggested that (on each test day) only two boreholes be drilled and tested in ridged ice. Borehole jack tests should be conducted (at depth intervals of 0.30 m) from the ice surface to a
depth of 2.10 m. A 2.4 m depth indicator rod was provided to indicate the different test
depths. The rod comes in three pieces, which connect using the bolts and wing nuts provided. When looking at the depth indicator rod, note that there are also brass nuts/bolts that are permanently in place and should not be moved. Use the wing nut to assemble/dissemble the rod. Red tape was used to indicate the tests depths (from 0.30 m to 2.1 m).
4.
In-situ Temperature Measurements in Level Ice and Ridged Ice
This year, a temperature chain will be installed in level ice near the main borehole jack test site. A second temperature chain will be installed in an area of ridged or deformed ice. The depth spacing for in situ temperature measurements is 10 cm for level ice and 40 cm for ridged ice. Ice temperatures at each site will be logged using a Campbell Scientific data logger (CR10s) in conjunction with an AM416 multiplexer.
Each temperature chain contains an array of shielded, copper-constantan thermocouple wire and one thermistor probe. The thermocouple wire is used at all sampling depths and the thermistor is installed at one of the same depths as the thermocouple wire. Because the thermistor probe has a higher sensitivity than the thermocouple wire, comparing output at the same depth will provide an indication of the error associated with the (less sensitive) thermocouple. The two thermistor probes and all thermocouple pairs were tested in an ice-bath in the laboratory before they were installed in the field. Instructions for installing the temperature chains will be provided in a separate
5.
Hushh Pup Pump
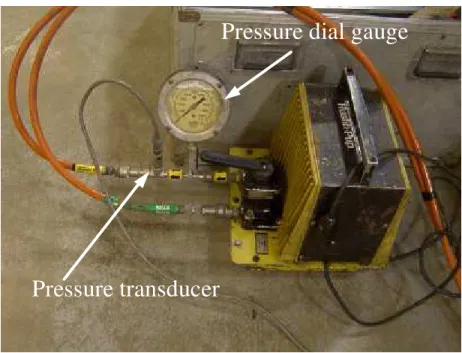
Figure 2 shows the top view of electric yellow Hushh-pup hydraulic pump. The EXTEND and RETRACT lever positions are shown (as marked by “E” and “R” on the pump itself). The pressure gauge and pressure transducer are connected between the pump and the hydraulic hose for the output (from the extend side of the pump).
The hydraulic hose for jack extension and the hose for jack retraction have different connectors so there is only one way to connect each of them to the pump.
Make sure to insert the pressure transducer next to the pressure dial gauge. Attach
the other end of the pressure transducer output cable (grey cable, Figure 3) to the Campbell logger. RETRACT EXTEND Hushh-pup pump N U E T R A L E R
Figure 2 Top view of Hushh-pup pump
The hydraulic line connections to the pump are shown in Figure 3. Figure 4 shows the end platen/face plate of the borehole jack and the cable for the displacement gauge (grey cable).
Figure 3 Hushh-pup pump and cable for pressure transducer
Figure 4 Borehole jack face and cable for displacement gauge
Pressure transducer
Pressure dial gauge
Black cable for displacement
gauge (potentiometer)
6.
Data Sheet for Decayed Ice Program 2002
Date: Julian Day:
Core 1 Core 2 Core 3 (for temp) (for salinity) (for density)
snow depth, cm ice surface temp, °C ice thickness, cm freeboard, cm
depth, cm temp. ‰ density (Mg/m³) start start start
0 depth, cm time time time
15 30 30 45 60 60 75 90 90 105 120 120 135 150 150 165 180 180 195 210 Photograph?______ Notes/Description/Sketch of Site
Data Sheet - Decayed Ice Strength Test Program 2002
Borehole Jack Strength
Hole 1 Hole 2 Hole 3
7.
Campbell Scientific System
This manual is written for PC208W version 3.2.
NOTE: Identify the Storage Module and the Data Logger (see Figure 6 and Figure 7). Only the Storage Module need be taken from the Campbell Box to download the data acquired after the borehole jack tests. There is no need to remove the Data Logger.
Acronyms: SM716 – Storage Module
CR10 – Data logger WP – Wiring Panel PS – power Supply
1.3 Setting up PC208W on Personal Computer (normally, needed only once) 1.3.1 Setting up the Data Logger with PC208W
1. Select “Setup” (left hand corner) on PC208W main menu to open the Setup window
2. Select the Hardware tab 3. Select COM (COM1)
4. Click on “Add Devices” button and add CR10 (as CR10 Data logger) 5. Switch setting (for Borehole jack ice strength) = 9600 Baud Rate 6. Save the devices and the setting by clicking on the “Save Edits” button 1.3.2 Setting up Storage Module (SM716) with PC208W
1. Use SC532 (9 pin peripheral to RS interface) cable
2. “Peripheral” side connected to the SM716 through the blue ribbon cable and “RS232” side connected to the computer.
3. Needs 120V 9V DC supply to make connection.
4. Select “StgModule” on PC208W main menu to open the Storage Module (SMS) window
5. Select the middle top tab (SM192/SM716)
6. Select the Setup tab (on the bottom of the left hand half of the SMS window) – make sure the right port - COM (COM1/COM2) and Baud Rate (in our case 9600) is selected
1.3.3 Storing Program in Storage Module
1. Select “StgModule” on PC208W main menu to open the Storage Module (SMS) window
2. Click on the “Connect” button 3. Select the Programs tab
4. Store a program → Select the check box “Prog 8” → Click on the “Store” button
your local drive. Should download BHJ_2002.dld for recording readings 10 times per second.
5. Select the Advanced tab (on the right hand half of the SMS window) 6. Change “Storage Mode” option to “Fill and Stop”
7. The Storage Module setup should be as
on the Programs tab Program No.8 = USED
on the Status tab under “Switch Settings” : 76800/9600 Baud Fill and Stop /ASCII Mode /Address 1
8. Click on the “Disconnect” button
9. Now the program is stored in the SM716.
1.4 In-Camp Operations Each Day Before Field Tests 1.4.1 Powering up and Downloading Program to Data Logger
1. Ensure that the power switch in the power supply (PS12 12V POWER SUPPLY) is in
OFF position.
2. Place the Storage Module in white Campbell Scientific box
3. Connect the Storage Module with the blue ribbon cable to the wiring panel/data logger.
4. Turn on the power switch inside the PS12 12V POWER SUPPLY (note; CHG light does
not come on). The program is now automatically downloaded from Storage module to Data logger. Close white box.
5. Use Multimeter to check battery voltage of PS12 12V POWER SUPPLY, it should be at
least 10.5 V. The terminals on the battery pack in the power supply are easily accessible. (The minimum voltage to operate the logger is 9.5 V).
NOTE: the SM716 has to be connected to the CR10 prior to turning on the power switch so the program from the SM716 is automatically downloaded to the CR10. Keep power on continuously while tests are being run and data logged.
6. On keypad, the “HELLO” message is displayed (logger is checking memory). Wait until number “96” appears on the display.
7. Press *0. LOG1 must appear on display. Proceed with appropriate keystrokes. 8. If LOG appears (or something other than LOG1), the program has not been
downloaded from the SM716. Trouble-shoot the problem because the program needs to be downloaded for any data recording.
--- NOTE: Press *0 each time the keypad is disconnected from the storage module --- 1.4.2 Synchronizing the Clock
The clock has to be set up every time the power is turned on. Press keystrokes as described in the following procedure:
Procedure: *5 (HH:MM:SS appears on display = current Data logger time)
A (0500 appears on display), Type in “02” (for Year 2002), you should see 0502
A (050000 appears on display) Type in the number indicating Julian Day (i.e. 100 for April 10th ; you should see 05100
A (050000 appears on display) ? Type in the time (HH and MM, i.e. 1545 for 3:45 p.m.) you should see 051545
A clock set and running appears on display (in this case 15:45:SS) *0 to exit the instruction for synchronizing the clock
WARNING: Be sure to leave the power on!! Otherwise all the time settings are lost,
and any data stored on the CR10 are lost. The program does not need to be downloaded manually to the data logger; transfer from the storage module to the data logger is done automatically when the power is turned on. The storage module has to be connected to the CR10 with the blue ribbon cable prior to turning the power on. If the power is turned off and then on again, the clock has to be synchronized again (using the Keypad). 1.5 On Ice Operations at Test Site: Before Testing
• Connect pressure output to cable from pressure transducer (near dial gauge, Figure 3) to white Campbell Scientific logger box
• Connect displacement output cable from borehole jack (Figure 4) to white Campbell Scientific logger box.
• Press *0 (LOG1 appears on display), and then proceed with the keystrokes as described below.
1.5.1 Start Logging
The following keystrokes have to be entered into the Keypad to activate data recording. Procedure: *6 (060000 appears on display)
A (01 0.#### appears on display)….#### represents a four digit number D (00000000 appears on display)
1 (10000000 appears on display; if first 0 is not changed to 1 the test has not been activated!!! => repeat the whole procedure!)
1.5.2 Display Output on the Keypad
This provides a means to check in the field that the Data logger has stored data. Displacement data are being stored in location 1, the pressure data in location 2. Step through the locations using the keystrokes in the following procedure:
Procedure: *6 (060000 appears on display) Use A to advance through locations
A (01 “displacement reading in mV” appears on display, second digit indicates the location, i.e. here 01 = location 1)
A (02 “pressure reading in mV” appears on display, second digit indicates the location, i.e. here 02 = location 2)
Use B to back up through locations
B (01 “displacement reading in mV” appears on display, second digit indicates the location, i.e. here 01 = location 1)
Only the displacement should be displayed when doing a borehole strength tests. Use the displacement as a record of how much jack extension you have.
WHEN THE JACK IS FULLY RETRACTED,
THE DISPLACEMENT OUTPUT SHOULD READ 89 MV.
WHEN THE JACK IS FULLY EXTENDED
(MAXIMUM DISPLACEMENT OF 50 MM),
THE DISPLACEMENT OUTPUT SHOULD READ 2200 MV.
USE THE DIAL GAUGE NEAR THE PUMP TO GIVE A
RECORD OF PRESSURE!
1.5.3 Stop Logging
The following keystrokes have to be entered into the Keypad to stop recording the data. Procedure: *6 (060000 appears on display)
A (01 0.#### appears on display)….#### represents four digit number D (10000000 appears on display)
1 (00000000 appears on display; if first digit (1) is not changed to 0 the test has not been stopped!!! => repeat the whole procedure!)
When back in the camp, turn the power off (turn off the power switch), remove the storage module (SM716) and download data to the laptop computer.
1.6 In Camp Operations: Post Test and Back in Camp
1.6.1 Downloading data from Storage Module (SM716) to computer
⇒ Download data at the end of each day after returning to base camp.
Downloading data from a full storage module – takes about 15 minutes. Erase and Test the storage module – takes about 4 minutes
Downloading new program – takes about 30 sec, depending on the size of the program.
1. Select “StgModule” on PC208W main menu to open the Storage Module (SMS) window
2. Click on the “Connect” button 3. Select the Data tab
4. Select the “New Name for Each file” option button from “File Naming Options” 5. Click on “Get All” button to download all files stored in the storage module. Dialog
box appears asking for the name of the file = select the path where you want to have the file stored and the name under which you want to store the file. Suggested name BHJ### where ### is the Julian Day of the tests. Then wait while data downloads. Note that the file is a comma delimited ACSII file with a .DAT file extension. 6. Click on the “Disconnect” button
7. After making sure data file is backed-up, STORE PROGRAM IN SM716.
IMPORTANT!! All raw data files (BHJ###.DAT) should be backed-up onto a floppy diskette.
1.6.2 Viewing data
1. Select “View” on PC208W main menu to open the View window File Open select the proper path and the file. The columns in each file represent: Array ID; Julian Day; Time (hh:mm); Seconds; Displacement (mV); Pressure (mV), respectively (See example below)
10,108,1920,32.5,2144,4.626 10,108,1920,32.75,2143,4.626 10,108,1920,32.88,2144,4.626 10,108,1920,33.13,2143,4.626 10,108,1920,33.25,2144,4.626
Use “View” to check that the beginning and end times on the file correspond to field notes.
1.6.3 Erasing data from Storage Module 1. Select the Erase tab
2. Click on the “Erase and Test Module” button (if full takes about 10 – 15 minutes) 1.7 Miscellaneous Information
1.7.1 Physically Connecting Data Logger, CR10 to Computer
⇒ (should not need, because all data will be downloaded from Storage Module. Given for informative purposes only)
Through SC32A (optically isolated RS232 interface) cable Data logger = to Data logger
8.
Campbell Box Wiring Diagrams
Figure 6 shows the general layout of the components in the white Campbell Box. Figure 7 is a schematic of the wiring from the displacement transducer and the pressure transducer to the wiring panel. The wires in the Campbell Box have been labeled. The connections are described below.
D External DISPLACEMENT Connector
The displacement cable from the borehole jack should be attached to the appropriate connector on the Campbell Scientific box.
Output from the DISPLACEMENT sensor goes into the left side of the terminal strip bolted to side of white Campbell box.
Insert red wire from displacement side of terminal strip to 1H on wiring panel (wire labeled “displ: out to 1H”).
Insert green wire coming from displacement side of terminal strip to “G” on logger wiring panel.
Insert yellow wire from excitation (on left side of terminal strip) for displacement gauge into 5V on wiring panel. The yellow wire is labeled “to 5V on panel”.
P External PRESSURE Connector
The pressure transducer cable from borehole jack should be attached to the appropriate connector on the Campbell Scientific box.
Output from the PRESSURE sensor goes into a simple voltage divider on right side of the terminal strip bolted to the white Campbell box.
Insert white wire from OUT to 1L on wiring panel (labeled “pres. O 1L”).
Insert green wire coming from pressure side of terminal strip to “G” on logger wiring panel.
Insert blue wire from excitation for pressure transducer (on right side of terminal strip) into 12V on wiring panel. The blue wire is labeled “to 12V on panel”.
Power Supply
Output from 12V POWER SUPPLY:
• Red wire (+) to 12V on wiring panel
Removable
Storage module Data logger
Cables to displacement and pressure transducers Connector for displacement cable Connector for pressure cable
Figure 6 Photograph of Campbell Scientific data logging box
Input from displacement and pressure transducers S M 7 1 6 S to ra g e M o d u le 1 2 V P o w e r S u p p ly AG AG AG AG E3 AG 6L 6H 5L 5H 4L 4H EXC +S G -S +S EXC AG AG E2 E2 AG AG 3L 3H 2L 2H 1L 1H 12 V 12 V 12 V G G G G G G G G G 5 V 5 V C 1 C 2 C 3 C 4 C 5 C 6 C 7 C 8 P 2 P1 Displacement Pressure
9.
Julian Day Calendar for 2002
month 1 2 3 4 5 6 7 8 9 10 11 12 13 14 15 16 17 18 19 20 21 22 23 24 25 26 27 28 29 30 31 JAN 1 2 3 4 5 6 7 8 9 10 11 12 13 14 15 16 17 18 19 20 21 22 23 24 25 26 27 28 29 30 31 FEB 32 33 34 35 36 37 38 39 40 41 42 43 44 45 46 47 48 49 50 51 52 53 54 55 56 57 58 59 MAR 60 61 62 63 64 65 66 67 68 69 70 71 72 73 74 75 76 77 78 79 80 81 82 83 84 85 86 87 88 89 90 APR 91 92 93 94 95 96 97 98 99 100 101 102 103 104 105 106 107 108 109 110 111 112 113 114 115 116 117 118 119 120 MAY 121 122 123 124 125 126 127 128 129 130 131 132 133 134 135 136 137 138 139 140 141 142 143 144 145 146 147 148 149 150 151 JUN 152 153 154 155 156 157 158 159 160 161 162 163 164 165 166 167 168 169 170 171 172 173 174 175 176 177 178 179 180 181 JUL 182 183 184 185 186 187 188 189 190 191 192 193 194 195 196 197 198 199 200 201 202 203 204 205 206 207 208 209 210 211 212 AUG 213 214 215 216 217 218 219 220 221 222 223 224 225 226 227 228 229 230 231 232 233 234 235 236 237 238 239 240 241 242 243DAY OF THE MONTH JULIAN DAYS FOR 2002
Figure 8 Julian Day Calendar for 2002
Appendix A
Example
0 500 1000 1500 2000 2500 0 1000 2000 3000 4000 5000 Time (seconds) Displacement (mV) -100 100 300 500 700 900 1100 1300 1500 Pressure (mV) disp (mv) press (mV)
Sample time series trace from borehole jack; laboratory conditions (minimal pressure generated)
jack fully extended
jack fully retracted
Example of consecutive borehole jack tests under laboratory conditions
With the borehole jack used in 2002, the displacement output is 88 mV when fully retracted and about 2200 mV when the jack is fully extended (50 mm).
List of Contacts
Robert Frederking
Canadian Hydraulics Centre
National Research Council of Canada Bldg M-32, Montreal Road
Ottawa, Ontario K1A 0R6 613 999 2349
Robert.frederking@nrc.ca Michelle Johnston
Canadian Hydraulics Centre 613 990 5141 Michelle.Johnston@nrc.ca Campbell Scientific 11564 149th St. Edmonton, Alberta T5M 1W7 780 454 2505
REPORT No./ NO DU RAPPORT CHC-TR-0XX PROJECT No./ NO DU PROJECT 59_615_00 SECURITY CLASSIFICATION/ CLASSIFICATION DE SECURITÉ Top Secret/Très secret
Secret Confidential/Confidentiel Protected/Protégée _X Unclassified/Non classifiée DISTRIBUTION/DIFFUSION Controlled/Controlée X_ Unlimited/Illimitée
DECLASSIFICATION: DATE OR REASON/DÉCLASSEMENT: DATE OU RAISON
TITLE, SUBTITLE/TITRE, SOUS-TITRE
TESTING THE COMPRESSIVE STRENGTH OF SEA ICE WITH A BOREHOLE JACK, THIRD SEASON: FIELD INSTRUCTIONS FOR SPRING/SUMMER 2002
AUTHOR(S)/AUTEUR(S)
R. FREDERKING and M. JOHNSTON SERIES/SÉRIE
UNLIMITED TECHNICAL REPORT
CORPORATE AUTHOR/PERFORMING ORGANIZATION/ AUTEUR D'ENTREPRISE/AGENCE D'EXÉCUTION National Research Council of Canada
Canadian Hydraulics Centre
SPONSORING OR PARTICIPATING AGENCY/AGENCE DE SUBVENTION OU PARTICIPATION CANADIAN ICE SERVICE
DATE APRIL 2002
FILE/DOSSIER SPECIAL CODE/ CODE SPÉCIALE PAGES 20 FIGURES 8 REFERENCES 0 NOTES
DESCRIPTORS (KEY WORDS)/MOTS-CLÉS
BOREHOLE JACK, FREEBOARD, ICE THICKNESS, SALINITY, DECAYED ICE SUMMARY/SOMMAIRE
This report was prepared to aid in measuring and documenting the properties of decayed ice. Outlined is a
procedure by which to measure the confined compressive strength of sea ice with a borehole jack. Also included are instructions pertaining to measurements of ice thickness, temperature, salinity, freeboard and snow depth.
ADDRESS/ADDRESSE
Canadian Hydraulics Centre
National Research Council of Canada Montreal Road, Ottawa, K1A 0R6, Canada