HAL Id: hal-03199974
https://hal.archives-ouvertes.fr/hal-03199974
Submitted on 16 Apr 2021
HAL is a multi-disciplinary open access
archive for the deposit and dissemination of sci-entific research documents, whether they are pub-lished or not. The documents may come from teaching and research institutions in France or abroad, or from public or private research centers.
L’archive ouverte pluridisciplinaire HAL, est destinée au dépôt et à la diffusion de documents scientifiques de niveau recherche, publiés ou non, émanant des établissements d’enseignement et de recherche français ou étrangers, des laboratoires publics ou privés.
aggregation?
Christine Vauthier, Bernard Cabane, D. Labarre
To cite this version:
Christine Vauthier, Bernard Cabane, D. Labarre. How to concentrate nanoparticles and avoid aggregation?. European Journal of Pharmaceutics and Biopharmaceutics, Elsevier, 2008, 69 (2), pp.466 -475. �10.1016/j.ejpb.2008.01.025�. �hal-03199974�
How to concentrate nanoparticles and avoid aggregation?
C. Vauthier
a,*, B. Cabane
b, D. Labarre
caCNRS UMR 8612, Univ Paris‐Sud, 92296 Chatenay‐Malabry, France bLaboratoire PMMH, CNRS UMR 7636, ESPCI, 75231 Paris Cedex, France cUniv Paris‐Sud, CNRS UMR 8612, 92296 Chatenay‐Malabry Cedex, France Received 8 November 2007; accepted in revised form 23 January 2008 Available online 1 February 2008
Published in:
Eur J Pharm Biopharm 2008;69:466–475. https://doi.org/10.1016/j.ejpb.2008.01.025
Corresponding author.
C. Vauthier, CNRS, UMR 8612, Laboratoire de Physicochimie, Pharmacotechnie et Biopharmacie, Univ Paris‐Sud, Faculté de Pharmacie, 5 Rue J.B. Clément, 92296 Chatenay‐Malabry Cedex, France.
E-mail address: christine.vauthier@u‐psud.fr; Tel.: +33 1 46 83 56 03; fax: +33 1 46 83 53 12.
Abstract
Most of the methods that are used to produce pharmaceutical suspensions of nanoparticles for drug‐ targeting yield suspensions having a low content in drug carriers. This can be a dramatic limitation when the volume of suspension that would have to be administered in vivo to reach therapeutic concentrations of the drug is much above the acceptable range. Concentrating the drug‐carrier suspension by centrifugation, lyophilization and evaporation is often inapplicable because aggregates are formed. Here we present a simple method that is able to increase the concentration of nanoparticle suspensions without forming aggregates. It consists in a dialysis of the suspensions against a polymer solution. This causes an osmotic stress, which produces a displacement of water from the nanoparticle suspension towards the counter‐dialyzing solution. Various types of nanoparticle suspensions can be concentrated in near equilibrium conditions, and the result is controlled and reproducible. Concentration factors up to 50 were obtained in a few hours at room temperature. The original characteristics of the nanoparticles were fully preserved in the concentrated dispersion.
Keywords
: Nanoparticles; Osmotic pressure; Dialysis; Dextran; Concentration1. Introduction
For the past 30 years, the explosive growth of nanotechnology has brought challenging innovations in pharmacy. Areas of application are wide, concerning the treatment of major health diseases including severe infections, cancer and metabolic disorders [1]. However, such new drugs need development of highly specific delivery carriers, e.g. long circulating nanoparticles. Since the discovery of the first biodegradable polymeric nanoparticles in 1979, systems based on polymeric nanoparticles have been developed as alternatives to liposomes [2]. Thanks to progress in polymer chemistry and in polymeric colloids, such systems can be almost tailor made, and many types of nanoparticulate drug carriers have been proposed. See for example [3–11]. The content in nanoparticles of the suspensions obtained by most methods of synthesis used for preparing pharmaceutical formulations is generally quite low [11– 13]. Thus, the clinical use of the drug formulated in the nanoparticles can be seriously hampered if the volume of suspension that has to be administered in order to reach therapeutic concentrations of the drug is too high, due to a low concentration in nanoparticles. In this case, nanoparticle suspensions need to be concentrated. However, most of the methods of concentration proposed so far are not fully satisfactory because aggregates can form due to an over‐concentration of nanoparticles in some regions of the suspension [14–17]. In addition, several methods are almost impossible to apply to nanocapsules which can be damaged during the process [14].
The aim of the present work is to propose a new and easy process to increase the concentration of nanoparticles in pharmaceutical suspensions in a controllable manner and to avoid aggregation phenomena. It is based on the application of an osmotic stress on the nanoparticle suspension, which is simply entrapped in a dialysis bag. Through this osmotic stress, water molecules are displaced from the inside of the bag towards the outside dialysis solution until equilibrium is reached from both side of the dialysing membrane. Such kind of dialysis methods has been used as an analytical method for polymer molecular weight determination and to study the stability and the structure of colloidal dispersions [18,19]. Yet it was never used as a method of concentration of pharmaceutical formulations of nanoparticle suspensions.
2. Materials and methods
2.1. Materials
Dextran (MW 66,900) from Leuconostoc mesenteroides was provided by Sigma (Saint Quentin Fallavier, France) and Dextran (MW 100,000) from Leuconostoc ssp. was purchased from Fluka. Isobutylcyanoacrylate used as the monomer in the preparation of nanoparticles was a gift from Henkel Biomedical (Dublin, Ireland). Poly(epsiloncaprolactone) (PCL) from Sigma (Saint Quentin Fallavier, France) was used to prepare nanospheres and nanocapsules. Pluronic F68 from BASF was used as the surfactant in the preparation of the nanospheres and nanocapsules. Miglyol812 was provided by Hu¨ls France (Puteaux). Cerium IV from cerium ammonium nitrate was purchased from Fluka (Saint Quentin Fallavier, France).
Dialysis membranes (Spectra PorBiotech membranes MWCO 15,000, and Spectra Porcellulose ester membrane MWCO 100,000) were obtained from BioBlock Scientific (Illkirch, France). All preparations were made with Milli® Qwater (Waters, Saint Quentin en Yvelines, France).
2.2. Methods
2.2.1. Preparation of nanoparticles
Poly(isobutylcyanoacrylate) (PIBCA) nanospheres (PIBCA‐NS) were prepared by redox radical emulsion polymerization of the corresponding monomer using dextran (MW 66,900) as described in previous papers [2,20– 22]. Briefly, 0.5 mL of IBCA was added under strong magnetic stirring to 10 mL of 0.2 Mnitric acid containing 0.1375 g dextran 66,900 and 16 mM cerium IV. The nitric acid solution was purged with nitrogen during 10 min prior to the addition of the monomer and maintained at 40 C. After 1 h of polymerization, the nanoparticle suspension was cooled down to 20 C in an ice bath.
Nanospheres (PCL‐NS) and nanocapsules (PCL‐NC) of poly(epsilon‐caprolactone) (PCL) were prepared by the nanoprecipitation technique. The nanospheres were obtained by nanoprecipitation of 200 mg PCL dissolved in 20 mL of acetone in 40 mL water containing 500 mg Pluronic F68. To obtain nanocapsules, 0.2 mL of Miglyol812 was added to the acetonic solution of PCL (20 mL, 200 mg/mL). The procedure was continued as described for the preparation of PCL‐NS. Acetone and part of the water were evaporated from the suspensions obtained after nanoprecipitation by roto‐evaporation under vacuum to a final volume of 20 mL.
For several experiments, the nanoparticle suspensions were further purified 3 times by dialysis against water (Spectra Porcellulose ester dialyzing membrane MWCO 100,000) to remove eventual residual dextran or PluronicF68. These purified nanoparticle suspensions were named PIBCA‐NSpurif, PCL‐NSpurif and PCL‐NCpurif, respectively.
2.2.2. Concentration experiments by dialysis
A weighted amount of the nanoparticle suspensions (3 g) was introduced in a dialysis bag (Spectra Por Biotech membranes MWCO 15,000) and dialyzed against solutions of dextran 100,000 at concentrations varying from 25 to 300 g/L in water. The volume of the counter‐dialysis medium ranged from 3 to 10 mL. Dialysis was performed at room temperature (20 C) in disposable conical centrifuge tubes of 50 mL. At the end of the dialysis, the concentrated dispersion of nanoparticles was collected from the dialysis bag and its weight was measured again. Each experiment was performed in triplicate.
2.2.3. Evaluation of the kinetic of the concentration phenomena occurring through dialysis
The weight of the dialysis bag containing the nanoparticle sample was measured using an analytical balance (Sartorius TE124S, Goettingen, Germany) at the beginning of the experiments and at different time intervals during 25 h. In parallel, the weight of the counter‐dialyzing medium was also measured. The weight loss of the dialysis bag and the weight gain of the counter‐dialyzing solution were plotted against time. The initial slope of the curve was used to determine the rate of water transfer from the dialyzing bag to the counter‐dialyzing medium and expressed in g/h. Results were obtained from the mean values of three determinations performed on independent experiments carried out in identical conditions, i.e. same concentration in dextran in the counter‐dialyzing medium, same volume of counter‐dialyzing medium, same type of the parent nanoparticle suspension.2.2.4. Concentration experiments by evaporation
A 5 mL sample of the PIBCA‐NSpurif dispersion was concentrated by evaporating part of the water using a rotoevaporator (Buchi rotavapor R215 equipped with a vacuum controller Buchi V 850 and a heating bath Buchi B491) operated at 45 C under a reduced pressure of 50 mbar. The evaporation was stopped when the amount of dispersion remaining in the balloon was about 1/10 of the initial volume. The amount of remaining dispersion was measured by weighting the vessel before the introduction of the suspension, after the addition of the 5 mL nanoparticle dispersion and after the evaporation to determine how much water was removed from the sample during evaporation? A concentration factor Fce was calculated from the ratio between the mass of the nanoparticle dispersion introduced in the vessel and the mass of nanoparticle suspension remaining after evaporation.
2.2.5. Concentration experiments by lyophilization
A 1 mL sample of the PIBCA‐NSpurif dispersion was lyophilized. Then, in order to prepare a concentrated dispersion of the nanoparticles, a volume of water (100 ll) corresponding to the desired concentration factor (10) was added to the lyophilized powder.
2.2.6. Concentration experiments by ultracentrifugation
A 3 mL sample of the PIBCA‐NSpurif dispersion was ultracentrifuged at 100,000 g during 30 min (Ultracentrifuge Beckman‐Coulter Optima LE‐80K, Rotor Ti 70.1, Beckman Instruments, Villepinte, France). After centrifugation, the pellet was redispersed in 0.3 mL of the supernatant using a vortex (15 min) to reconstitute a suspension of nanoparticles with the desired concentration factor (10).
2.2.7. Determination of the nanoparticle concentrations in the different suspensions
Concentrations of nanoparticles in suspensions were determined gravimetrically. A known aliquot of the suspensions was lyophilized, and the weight of the dried sample was measured using a precision balance (Sartorius TE124S, Goettingen, Germany). All measurements were performed in triplicates. A Student t‐test was applied to evaluate significant differences between raw and purified samples from the same type of nanoparticles. Concentrations in nanoparticles were expressed in mg/mL.2.2.8. Nanoparticle size measurements and morphologies
Nanoparticle sizes were evaluated before and after concentration by Photon Correlation Spectroscopy using a Zetasizer ZS 90 (Malvern Instruments, Orsay, France). The morphology of the nanoparticles was observed by Scanning Electron Microscopy with a LEO‐GEMINI 1530 Scanning Electron microscope (Leica, Rueil‐Malmaison, France). The samples were lyophilized and coated with a 2 nm thick platinum palladium layer with a Cressington Sputter Coater 208HR (Cressington, Roissy, France).2.2.9. Calculations of the concentration factors
Concentration factors, determined from the gravimetric measurements, Fg, were calculated by the ratio between the concentrations of the initial, Ci, and the final, Cf, nanoparticle suspensions:
[1]
Concentration factors, determined from the measurements of the mass of the nanoparticle suspensions, Fv, were calculated from the ratio between the initial mass of nanoparticle suspension, Mi, and the mass of suspension recovered at the end of the experiment, Mf:
[2]
3. Results and discussion
The characteristics of the nanoparticles before concentration were in agreement with the characteristics of similar nanoparticles obtained in previous studies (Table 1).
Concentration experiments were performed by dialysis of nanoparticle suspensions through an ethyl cellulose dialysis membrane of a molecular weight cutoff of 15,000 against a solution in which dextran 100,000 was dissolved at different concentrations. According to the work of Bonnet‐Gonnet et al. [18], the osmotic pressure, P, of dextran 100,000 solutions can be represented by a polynomial function of the dextran concentration, Cdex, in g/L:
[3]
According to this equation, the osmotic pressures applied in this work on the nanoparticle suspensions ranged from 0.04 x 10⁵ to 2.22 x 10⁵ Pa, using solutions containing 50 to 300 g/L of dextran 100,000 (Table 2).
The application of a solution of high osmotic pressure on a dialysis bag containing a suspension of nanoparticles produces an osmotic stress on the nanoparticle suspension, which in turn induces the displacement of water molecules from the inside to the outside of the dialysis bag. This displacement of water molecules occurs naturally to counterbalance the difference in osmotic pressure taking place between the two compartments separated by the dialysis membrane, which was chosen to allow only exchanges of water and ions while it retained polymers and particles. Using this process, it is expected that the suspension of nanoparticles entrapped in the dialysis bag will be ‘‘dewatered” until an osmotic equilibrium is reached from both sides of the dialysis membrane. Indeed, reaching the osmotic equilibrium will stop the dewatering process. Thus, this should be an efficient way to control the total amount of water removed from the nanoparticle suspension, and hence the concentration factor.
The kinetics of the transfer of water between a suspension of PIBCA‐NSpurif and the counter‐dialyzing medium consisting in 5 mL of dextran 300 g/L is reported in Figure 1. The weight loss of the dialysis bag and the weight gain of the counter‐dialyzing medium are reported in Figure 1A and B, respectively. It can be noted that the weight loss of the dialysis bags was counter‐balanced by the weight gain of the counter‐dialyzing medium. As expected, the results obtained here confirmed that water molecules were transferred from the nanoparticle suspension to the dextran solution.
Table 1: Characteristics of the nanoparticles in the initial suspensions obtained from the different preparation procedures. Nanoparticles
PIBCA‐NS PCL‐NS PCL‐NC
Hydrodynamic diameters (nm) 277 ± 16 202 ± 1 318 ± 15
SDa
27 50 56
Zeta potential in NaCl 1 mM (mV) 10.6 ± 0.8 33 ± 2 41 ± 3
a SD width of the size distribution.
Table 2: Concentrations in nanoparticles obtained after dialyzing 3 g of PIBCA‐NSpurif for 25 h against
counter‐dialyzing solutions with different dextran concentrations or different volumes. Dextran (g/L) Π (105 Pa or atm) Volumea (mL) C
f (mg/mL) 50 0.042 5 48.3 ± 0.1 75 0.091 5 53.8 ± 0.3 100 0.166 5 56 ± 2 200 0.805 5 299 ± 3 300 2.219 5 398 ± 3 300 2.219 3 426 ± 2 300 2.219 7.5 379 ± 4 300 2.219 10 434 ± 4 aVolume of counter‐dialyzing medium.
Figure 1. Kinetics of weight loss from the dialysis bag (A) and of weight gain in the counter‐dialysis
medium (B) during an experiment where 3 g of a PIBCA‐NSpurif suspension was dialyzed against 5 mL
of counter‐dialyzing solution containing 300 g/L of dextran 100,000.
The initial slope of the curves was used to calculate the initial rate of transfer of water between the two compartments. Then a plateau was reached after several hours indicating that no more water was transferred in the counter‐dialyzing solution after a period of 10–12 h. As explained above, the appearance of the plateau indicated that equilibrium between both compartments was reached, which ended the transfer of water. It can be seen in Table 3 that the initial rates of transfer were almost identical, whereas the plateau values were symmetrical within a difference of 4% in the absolute value. The standard deviations found for these data were small indicating a good reproducibility of the experiments. It is noteworthy that the size of the dialysis bags was not calibrated, which could cause slight variations in the surface of exchange between the two compartments. A close examination of the error bars of the curves of Figure 1 shows that the rates of water transfer between the two compartments were only slightly affected, whereas the plateau values corresponding to the total amount of water transfer were not at all affected in the given experimental conditions.
Table 3: Rate of water exchange calculated from the initial slope of the kinetic curves obtained by dialysis of 3 g of suspensions of PIBCA‐NS against 5 mL of dextran 300 g/L
Experiment Dialyzing bag weight loss Counter‐dialyzing medium weight gain
Initial rate (g/h) R2 Plateau (g) Initial rate (g/h) R2 Plateau (g) Purified suspension 0.31 ± 0.02 0.9992 2.63 ± 0.01 0.32 ± 0.02 0.9985 +2.50 ± 0.02 Raw suspension 0.21 ± 0.02 0.9612 2.63 ± 0.02 0.19 ± 0.01 0.9620 +2.32 ± 0.03 R2, linear regression coefficient.
3.1. Effect of the dialyzing conditions
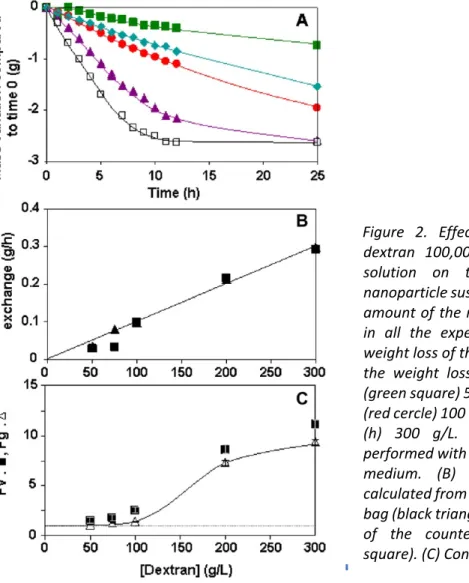
The osmotic stress applied to the nanoparticle suspension could be tuned through the choice of the dextran concentration in the counter‐dialyzing solution (Table 2). This greatly affected both the initial rate of water transfer between the two compartments (Figure 2B) and the plateau value that was reached after 10–12 h of dialysis (Figure 2A). As shown in Figure 2C, the values of the concentration factor Fv were generally slightly above those of the corresponding concentration factor Fg but in a reasonable range for such experiments (10%). Both concentration factors rose up to a value around 10 with the increase of the dextran concentration in the counter‐dialyzing medium (Figure 2C). The nanoparticle concentration in the corresponding suspensions recovered after 25 h of dialysis rose up to a value of 400 mg/mL (Table 2). These results clearly show that the higher the osmotic stress applied on the nanoparticle suspension (i.e. increasing dextran concentrations in the counter‐dialyzing solution), the more water was removed from the nanoparticle suspension after 25 h, hence the more efficient was the process of nanoparticle concentration. In the experiments carried out with the higher dextran concentration (300 g/L) in the counter‐dialyzing solution, the dialyzing system reached the plateau value indicating that the dewatering process of the nanoparticle suspension was efficiently controlled by the initial concentration of dextran in the counter‐dialyzing medium. Figure 3 presents the results obtained from experiments in which the dextran concentration in the counter‐dialyzing solution was kept constant (300 g/L) but the volume of the counter‐dialyzing medium was increased (3–10 mL). The curves giving the kinetics of water transfer between the dialyzing bag and the counter‐dialyzing solution were roughly superimposed (Figure 3A). Thus, the rates of the exchange of water and the plateau values were almost the same when the volumes of counter‐
Figure 2. Effect of the concentration of dextran 100,000 in the counter dialyzing solution on the concentration of the
nanoparticle suspension of PIBCA‐NSpurify. The
amount of the nanoparticle sample was 3 g in all the experiments. (A) Kinetic of the weight loss of the dialysis bag: (A) Kinetics of the weight loss of the dialysis bag: effect (green square) 50 g/L, (blue diamond) 75 g/L, (red cercle) 100 g/L, (purple triangle) 200 g/L, (h) 300 g/L. Dialysis experiments were performed with 5 mL of the counter‐dialyzing medium. (B) Rate of water exchange calculated from the weight loss of the dialysis bag (black triangle) and from the weight gain of the counter‐dialyzing medium (Black square). (C) Concentration factors.
dialyzing solutions of size were varied in a range extending from the volume of the parent nanoparticle suspension (3 mL) to more than 3 times this volume (10 mL). After 25 h of dialysis, the final concentration of the suspension reached a mean Cf = 409 ± 25 mg/mL, and the concentration factor was Fv = 10.5 ± 1 (Figure 3C and Table 2). The fact that identical plateau values were reached at the end of the experiment reflects a practical limitation of the concentration method: when the concentration factor is very high, the dialysis bag take a flat shape and the suspension is pushed into a few highly curved regions of the bag. Then the mechanical bending elasticity of the bag opposes further concentration. This problem could easily be taken care of by refilling the bags, at the expense of a much longer processing time. For moderate concentration factors (<10) this problem does not occur. Figure 4A and B present electron micrographs of the suspension that was concentrated by a factor of 10. These images show individualized nanoparticles, similar to those in the parent suspension. Accordingly, this shows that the nanoparticle morphology was not altered during the concentration process. The size distribution of the nanoparticles was also evaluated by photon correlation spectroscopy. This technique requires a dilution of suspensions before the measurement. The concentrated suspensions that were recovered after dialysis were easy to dilute. Their size distributions were identical to those of the parent suspensions (Figure 5A) indicating that no aggregation of the nanoparticles took place during the concentration process.
Figure 3. Effect of the volume of the dextran 100,000 solution used as counter‐dialyzing solution on the
concentration of the PIBCA‐NSpurif
nanoparticle suspension. The weight of the nanoparticle sample was 3 g in all the experiments (blue arrow in frame C). (A) Kinetics of the weight loss of the dialysis bag: (blue diamond) 3 mL, (Black square) 5 mL, (purple triangle) 7.5 mL, (red cercle) 10 mL. The dialysis experiments were performed with a solution of dextran of 300 g/L. (B) Rate of water exchange calculated from the weight loss of the dialysis bag (black triangle) and from the weight gain of the counter‐dialyzing medium (black
Figure 4. Scanning electron micrographs of the nanoparticle suspensions before (A), (C), (E) and after concentration (B), (D), (F) by dialysis of 3 g of the nanoparticle suspension against 5 mL of a solution of
dextran 100,000 at a concentration of 300 g/L. (A and B) PIBCA‐NSpurif. (C and D) PCL‐NS. (E and F) PCL‐
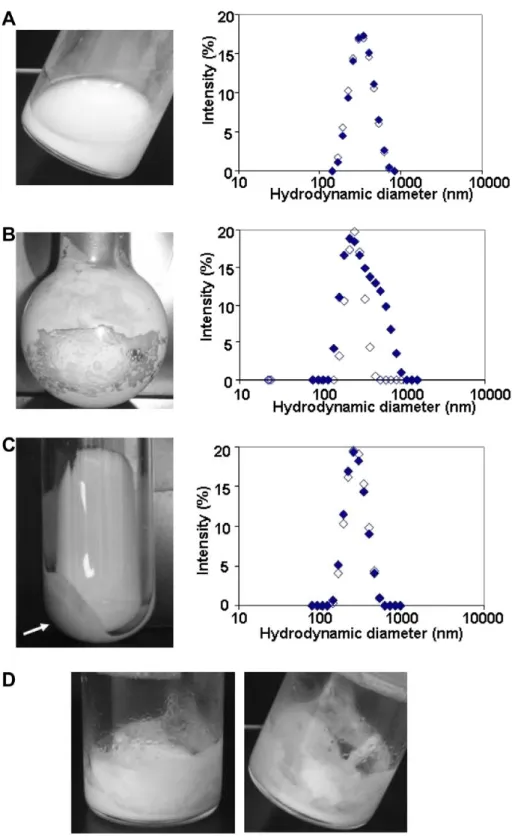
Figure 5. Characteristics of concentrated PIBCA‐NSpurif suspensions obtained by different methods of
concentration: (A) dialysis (concentration factor = 9.4); (B) evaporation (concentration factor = 8); (C) ultracentrifugation (concentration factor = 10); (D) lyophilization (concentration factor = 10). Left column: pictures of the concentrated suspensions. Right column: graph giving the size distribution of dispersed particles in samples (A), (B) and (C) as evaluated by light scattering. Open symbols: parent nanoparticle suspension. Closed symbols: concentrated nanoparticle suspensions. The arrow on the picture (C) indicates the presence of the remaining pellet.
3.2. Comparison with other concentration techniques
The performance of the new concentration method based on dialysis was compared to those of three other methods for concentrating the same nanoparticle dispersions, i.e., evaporation, ultracentrifugation and lyophilization.
Through evaporation, a concentration factor of 8 was reached after evaporating part of the water of the sample. However, using this method, it was difficult to control the amount of water that was removed from the nanoparticle sample. The size distribution of the nanoparticles, as evaluated by light scattering, was clearly modified (Figure 5B). In addition, the concentrated dispersion contained larger aggregates (which were not measured by the light scattering technique because they sedimented to the bottom of the light scattering cell) (Figure 5B). With other dispersions, aggregation was less prominent, but the control of the final concentration was still unreliable, in contrast with the good control that was achieved through the dialysis method. After ultracentrifugation, the nanoparticles formed a compact pellet which was hard to redisperse in a volume of supernatant 10 times lower than the initial volume of the parent nanoparticle suspension to reach a concentration factor of 10. Indeed, after 15 min of strong agitation using a vortex at the maximum speed, the nanoparticles were still not fully redispersed. A pellet remained in the tube with a mass of 43% of its initial mass indicating that only 57% of the nanoparticles were effectively redispersed (Figure 5C). Although the complete redispersion of the nanoparticles was difficult after ultracentrifugation, the obtained suspension showed the same size characteristics and size distribution than the parent suspension (Figure 5C). These features result from the fact that the centrifugation method produces a gradient of osmotic pressure in the sediment [19].
Lyophilization can be an alternative technique for producing concentrated nanoparticle dispersions if the nanoparticles can be fully redispersed. One attempt was made to prepare a concentrated dispersion of PIBCA‐NSpurif starting from the lyophilized parent suspension, by adding the required volume of water to reach the same concentration factor (10) that was obtained through dialysis. This attempt was not successful because the amount of water added to the lyophilized sample was not enough to fully wet the powder, i.e. the added amount of water did not form a continuous phase (Figure 5D).
3.3. Application of the process to different nanoparticles
As a last part of this work, the same osmotic stress method was applied to other types of nanoparticle suspensions, including nanospheres and nanocapsules. These suspensions contained free macromolecules in addition to the nanoparticles. These mainly included large macromolecules such as PluronicF68 and dextran used as stabilizing agents and other small contaminant molecules. According to the difference in concentrations found between the raw and the purified suspensions, this can represent up to 90% of the solid content of the raw dispersion. In the case of the PCL‐NS, it corresponds to almost the total amount of PluronicF68 added in the preparation medium indicating that only a low amount of the surfactant was included in the nanoparticles structure (see PCL‐NS in Table 4). Table 4. Concentrations and concentration factors of nanoparticle suspensions dialyzed against 5 mL of a 300 g/L dextran solution for 25 h Raw Purified Parent suspension (mg/mL) Concentrated suspension (mg/mL) Concentration factor Fg Parent suspension (mg/mL) Concentrated suspension (mg/mL) Concentration factor Fg PIBCA‐NS 118 ± 6 444 ± 3 3.7 42.0 ± 0.2 398 ± 3 9.4 PCL‐NS 28.6 ± 0.2 52 ± 1 1.9 3.4 ± 0.1 170 ± 2 50.0 PCL‐NC 40.5 ± 0.2 85 ± 1 2.1 15.7 ± 0.6 198 ± 3 12.6 The weight of the sample of nanoparticle suspension was 3 g.
The effect of such free macromolecules was investigated by comparing the concentration processes of purified vs. non‐purified suspensions. The purification was designed to remove all remaining free reagents that had been used during the preparation of the nanoparticles and were not included within the nanoparticle structure.
The kinetics of water exchange between the nanoparticle suspension and the counter‐dialyzing medium had the same shape as in the previous experiments (data not shown) and the plateau was also reached after 10– 12 h of dialysis. The initial rate of water exchange was systematically higher with the purified suspensions when compared to the corresponding raw nanoparticle suspensions (Figure 6). On the other hand, the rate of the water exchange was not greatly affected by the type of nanoparticles. The concentration factors obtained for the purified nanoparticle suspensions were much higher than those reached for the non‐purified suspensions (Table 4). The facts that the concentration factor was lower when applying the method to non‐purified suspensions can be explained by the presence of the free macromolecules in the suspensions. These free macromolecules produced an osmotic pressure that opposed the osmotic pressure applied on the other side of the dialysis membrane, and therefore reduced the net osmotic stress applied to the suspension. Thus, the presence of free macromolecules in the initial nanoparticle suspension limits the total amount of water that will be exchanged during the dialysis and therefore the efficacy of the concentration procedure in a given condition of concentration in dextran in the counter‐dialyzing medium. Figure 6. Effect of the purification of the nanoparticle suspension on the initial rate of water exchanged evaluated during dialysis of 3 g of nanoparticle suspensions against 5 mL of a solution of dextran 100,000 at a concentration of 300 g/L. Filled column: raw nanoparticle suspensions. Dashed column:
purified nanoparticle suspensions. Statistical analysis by Student t‐test. **p < 0.01, ***p < 0.001.
Still, the method could be used with the raw dispersions, leading to concentration factors up to 3.7. The nanoparticles of the concentrated suspensions showed the same characteristics than those of the parent suspensions (Figure 4C– F). This indicated that the integrity of the nanoparticles, including nanocapsules, was fully preserved during the concentration procedure.
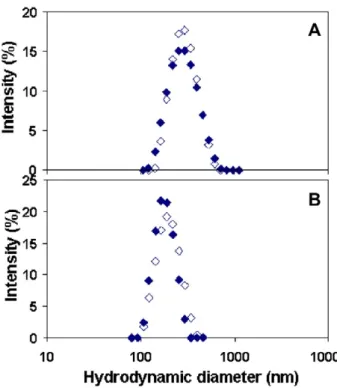
With the purified suspensions, very high concentration factors were obtained, up to 10 in the case of PIBCANSpurif and PCL‐NCpurif, and up to 50 in the case of PCL‐NSpurif. In these conditions, the size distributions of the concentrated suspensions remained identical to those of the parent suspensions (Figs. 5A and 7A), indicating that the characteristics of the nanoparticles were preserved even in the high concentration regime (Figure 7B).
Figure 7. Size distributions obtained from photocorrelation spectroscopy measurements of the nanoparticle dispersions. Open symbols: parent nanoparticle suspension. Closed symbols: concentrated
nanoparticle suspension. (A) PCL‐NCpurif. (B) PCL‐NSpurif.
4. Conclusion
The concentration of nanoparticles in pharmaceutical suspensions can be increased from initial formulation values by factors ranging from 10 to 50 without causing any aggregation of the nanoparticles. The method is based on the dialysis of a nanoparticle suspension against a polymer solution of high osmotic pressure using a dialysis membrane which only allows exchanges of small molecules especially water. The amount of water removed from the nanoparticle suspension can be controlled by the polymer concentration in the counter‐dialysis medium. Therefore, it is possible to predict the concentration in nanoparticles that will be reached in the final suspension.
The method presents many advantages. It is safe to use in the sense that the characteristics of the nanoparticles in the concentrated suspensions are fully preserved, even in the case of nanocapsules that are notoriously fragile objects. In contrast with other methods, it avoids aggregation of nanoparticles thanks to the concentration process which takes place near equilibrium. It also makes it possible to control the ionic strength of the nanoparticle suspensions since the chemical potentials of small ions that cross the membranes can be set in the counter‐dialysis solution. It is particularly simple, rapid and does not required sophisticated equipment. It can be applied to many types of nanoparticle formulations designed for pharmaceutical applications and only required a low amount of reagent. In the counter‐dialyzing medium, any water‐soluble polymer with a known osmotic pressure can be used. For instance, tables giving the osmotic pressure of solutions of dextran, poly(ethyleneglycol) and poly(vinylpirrolidone) are available from the following website:
http://www.brocku.ca/researchers/ peter_rand/osmotic/osfile.html.
Acknowledgements
The authors thank K. Broadley (Henkel Biomedical, Ireland) for his kind support providing the isobutylcyanoacrylate used in the preparation of the nanoparticles and K. Bouchemal who provided the poly(epsilon‐caprolactone) nanospheres and nanocapsules used in this work. Madeleine Besnard
(CNRS UMR 8612) and Audrey Valette (CNRSCECM, Vitry sur Seine) are kindly acknowledged for providing assistance in doing electron microscopy and size measurements. This work was supported by CNRS.
References
[1] P. Couvreur, C. Vauthier, Nanotechnology: intelligent design to treat complex disease, Pharm. Res. 23 (2006) 1417–1450. [2] P. Couvreur, B. Kante, M. Roland, P. Guiot, P. Bauduin, P. Speiser, Polycyanoacrylate nanocapsules as potential lysosomotropic carriers: preparation, morphological and sorptive properties, J. Pharm. Pharmacol. 31 (1979) 331–332.
[3] D. Quintanar‐Guerrero, E. Allemann, H. Fessi, E. Doelker, Preparation techniques and mechanisms of formation of biodegradable nanoparticles from preformed polymers, Drug Dev. Ind. Pharm. 24 (1998) 1113–1128.
[4] P. Legrand, G. Barratt, V. Mosqueira, H. Fessi, J.‐P. Devissaguet, Polymeric nanocapsules as drug delivery systems: a review, STP Pharma Sci. 9 (1999) 411–418.
[5] C. Vauthier, E. Fattal, D. Labarre, From polymer chemistry and physicochemistry to nanoparticulate drug carrier design and applications, in: M.‐J. Yaszemski, D.‐J. Trantolo, K.‐U. Lewamdrowski, V. Hasirci, D.‐E. Altobelli, D.‐L. Wise (Eds.), Biomaterial HandbookAdvanced Applications of Basic Sciences and Bioengineering, Marcel Dekker Inc, New York, USA, 2004, pp. 563–598. [6] P. Couvreur, G. Barratt, E. Fattal, P. Legrand, C. Vauthier, Nanocapsule technology: a review, Crit. Rev. Ther. Drug Carrier Syst. 19
(2002) 99–134.
[7] T. Delair, Colloidal particles: Elaboration from preformed polymers, in: A. Elaissari (Ed.), Colloidal Biomolecules, Biomaterials, and Biomedical Applications, Marcel Dekker Inc, New York, USA, pp. 329–347.
[8] S. Galindo‐Rodriguez, E. Allemann, H. Fessi, E. Doelker, Physicochemical parameters associated with nanoparticle formation in the salting‐out, emulsification‐diffusion, and nanoprecipitation methods, Pharm. Res. 21 (2004) 1428–1439. [9] S.‐A. Galindo‐Rodriguez, F. Puel, S. Briancon, E. Allemann, E. Doelker, H. Fessi, Comparative scale‐up of three methods for producing ibuprofen‐loaded nanoparticles, Eur. J. Pharm. Sci. 25 (2005) 357–367. [10] D. Moinard‐Checot, Y. Chevalier, S. Briancon, H. Fessi, S. Guinebretiere, Nanoparticles for drug delivery: review of the formulation and process difficulties illustrated by the emulsion‐diffusion process, J. Nanosci. Nanotechnol. 6 (2006) 2664–2681. [11] C. Vauthier, D. Labarre, G. Ponchel, Design aspects of poly(alkylcyanoacrylate) nanoparticles for drug delivery, J. Drug Target. 15 (2007) 641–663. [12] S. Desgouilles, C. Vauthier, D. Bazile, J. Vacus, J.‐L. Grossiord, M. Veillard, P. Couvreur, The design of nanoparticles obtained by solvent evaporation: a comprehensive study, Langmuir 19 (2003) 9504–9510. [13] P. Legrand, S. Lesieur, A. Bochot, R. Gref, W. Raatjes, G. Barratt, C. Vauthier, Influence of polymer behaviour in organic solution on the production of polylactide nanoparticles by nanoprecipitation, Int. J. Pharm. 344 (2007) 33–43. [14] W. Abdelwahed, G. Degobert, S. Stainmesse, H. Fessi, Freeze‐drying of nanoparticles: formulation, process and storage considerations, Adv. Drug Deliv. Rev. 58 (2006) 1688–1713. [15] K. Avgoustakis, Pegylated poly(lactide) and poly(lactide‐co‐glycolide) nanoparticles: preparation, properties and possible applications in drug delivery, Curr. Drug Deliv. 1 (2004) 321–333.
[16] S. Bozdag, K. Dillen, J. Vandervoort, A. Ludwig, The effect of freeze‐drying with different cryoprotectants and gamma‐irradiation sterilization on the characteristics of ciprofloxacin HCl‐loaded poly(D,L‐lactide‐glycolide) nanoparticles, J. Pharm. Pharmacol. 57 (2005) 699–707. [17] G. Dalwadi, H.A. Benson, Y. Chen, Comparison of diafiltration and tangential flow filtration for purification of nanoparticle suspensions, Pharm. Res. 22 (2005) 2152–2162. [18] C. Bonnet‐Gonnet, L. Belloni, B. Cabane, Osmotic pressure of latex dispersions, Langmuir 10 (1994) 4012–4021. [19] C. Martin, F. Pignon, A. Magnin, M. Meireles, V. Lelievre, P. Lindner, B. Cabane, Osmotic compression and expansion of highly ordered clay dispersions, Langmuir 22 (2006) 4065–4075. [20] C. Chauvierre, D. Labarre, P. Couvreur, C. Vauthier, Novel polysaccharide‐decorated poly(isobutyl cyanoacrylate) nanoparticles, Pharm. Res. 20 (2003) 1786–1793. [21] I. Bertholon, C. Vauthier, D. Labarre, Complement activation by core‐shell poly(isobutylcyanoacrylate)‐polysaccharide nanoparticles: influences of surface morphology, length, and type of polysaccharide, Pharm. Res. 23 (2006) 1313–1323.
[22] I. Bertholon, S. Lesieur, D. Labarre, M. Besnard, C. Vauthier, Characterization of dextran‐poly(isobutylcyanoacrylate) copolymers obtained by redox radical and anionic emulsion polymerization, Macromolecules 39 (2006) 3559–356.