This is an author-deposited version published in :
http://oatao.univ-toulouse.fr/
Eprints ID : 9237
To link to this article :DOI: 10.1016/j.ces.2013.03.005
URL : http://dx.doi.org/10.1016/j.ces.2013.03.005
O
pen
A
rchive
T
OULOUSE
A
rchive
O
uverte (
OATAO
)
OATAO is an open access repository that collects the work of Toulouse researchers and
makes it freely available over the web where possible.
To cite this version : Anne-Archard, Dominique and d'Olce,
Marguerite and Tourbin, Mallorie and Frances, Christine
Aggregation of silica nanoparticles in concentrated suspensions
under turbulent, shear and extensional flows. (2013) Chemical
Engineering Science, vol. 95 . pp. 184-193. ISSN 0009-2509
Aggregation of silica nanoparticles in concentrated suspensions
under turbulent, shear and extensional flows
D. Anne-Archard
a,b,n, M. d’Olce
a,b, M. Tourbin
c,d, C. Frances
c,daUniversité de Toulouse, INPT, UPS, IMFT (Institut de Mécanique des Fluides de Toulouse), Allée Camille Soula, F-31400 Toulouse, France bCNRS, IMFT, F-31400 Toulouse, France
cUniversité de Toulouse, INP, UPS, LGC (Laboratoire de Génie Chimique), BP 84234, 4 Allée Emile Monso, F-31432 Toulouse cedex 4, France dCNRS, LGC, F-31432 Toulouse Cedex 4, France
H I G H L I G H T S
! The shear and extensional flows that compose the turbulent flow are studied.
! Three experimental devices were used: a reactor, a Couette cell and a Taylor cell.
! The evolution of viscosity and parti-cle sizes during the aggregation were measured.
! The nature of the flow appear to have a great influence on the aggre-gation process.
! Different aggregate structures were suspected depending on the nature of the flow.
G R A P H I C A L A B S T R A C T
This study investigates granulometric and rheological measurements in destabilized colloidal silica suspensions under different type of flows. The study discusses the effects of the hydrodynamic conditions (shear and extensional flows) on the evolution of the size of the aggregates and the viscosity of the suspensions. Fig.: Volumetric particle size distributions of the suspension at the end of the destabilisation process for the various hydrodynamic conditions experimented.
Keywords: Particulate processes Suspension Nanoparticle Stability Hydrodynamics Rheology
a b s t r a c t
The production of nanoparticles in concentrated suspensions requires strict control of the stability of the systems which are strongly influenced by the physico-chemical properties and the hydrodynamic conditions they are placed in. This study deals with the analysis of the aggregation processes of a colloidal silica suspension destabilized by addition of salt under different flows: a turbulent flow performed in a stirred tank, a pure shear flow created thanks to a Couette geometry and an extensional flow obtained in a four-roll mill (Taylor cell). During the aggregation process, the silica suspensions behave as shear-thinning fluids and the variation of their apparent viscosity can be related to the evolution of the size distribution of the aggregates in the suspension. Pure shear and turbulent flows at an equivalent strain rate exhibit almost the same behaviour. The viscosity and the aggregate size decrease with the shear rate. On the contrary, the apparent viscosity and the aggregate size distributions were not very sensitive to a change of an extensional constraint within the considered range. Indeed, although aggregates obtained in the Taylor cell were bigger than in the Couette cell, the apparent viscosity was higher in the latter case. Different aggregate structures, characterized by their fractal dimension, were finally predicted depending on the hydrodynamic nature of the main flow under which they were produced.
1. Introduction
Nanoparticles have received increased attention these last 10 years in many industrial applications. Their useful properties are
n
Corresponding author at: Université de Toulouse, INPT, UPS, IMFT (Institut de Mécanique des Fluides de Toulouse), Allée Camille Soula, F-31400 Toulouse, France. Tel.: þ33 5 34 32 28 90.
closely linked to their particle size, or their great surface/volume ratio and also to their dispersion state. In concentrated suspen-sions, one important problem that often arises is the difficulty to control the process of aggregation and thus, in the long term, preserve product quality. The stability of colloidal suspensions depends on the forces which act on the particles. As pointed out by
Israelachvili (1992), particle movement can be induced by the free motion of the particles by diffusion (Brownian motion) or be controlled by the repulsive interparticle interactions or the effects of external gravitational or flow forces. Inversely, the aggregation process is strongly influenced by the physico-chemical properties of the system and the hydrodynamic conditions imposed during the process. Within suspensions where the particle movement is affected by the hydrodynamic forces, a modification of the hydro-dynamic conditions can increase or decrease the particle collision frequency, the sticking efficiency of particles to another one and the break up process of the largest aggregates. A balance between these mechanisms can be observed looking at the aggregation kinetics and the particle size distributions obtained at equilibrium. Such competition between the cohesive forces caused by the addition of a flocculent and disruptive forces caused by flow was pointed out byTolpekin et al. (2004).
While physico-chemical interactions are well identified as key factors in aggregation processes, the role of hydrodynamics is less well known. Yet, during an aggregation process, the build-up and the structure of an aggregate are also linked to the way particles or neighboring aggregates come close to each other. The same considerations apply to the breakage that accompanies aggrega-tion. In order to explore the influence of hydrodynamics, the nature and the ‘intensity’ of the flow must be borne in mind. The two best-known categories of simple flows are simple shear flows and shear-free flows (Bird et al., 1977). Simple shear flows are easy to achieve (Poiseuille flow, Couette flow), while shear-free flows are not, except for a short time as in a uniaxial extensional flow for example (stretching of a filament). During turbulent flow in a reactor commonly used in processes, particles and aggregates are subjected to both shear and extension, which furthermore are unsteady. To answer the question of the influence of hydrody-namics, it is then of particular interest to explore the case of steady simple flows. This is the goal of this paper where an aggregation process is studied using different flow configurations.
Simple flows were extensively used to study the deformation of drops or macromolecules and numerous experimentations were performed in Couette flows (Minale, 2010). Moreover the nature of the flow (shear or extension) was identified as of importance. For
example, and as demonstrated by Bentley and Leal (1986a)and
Ha and Leal (2001), the behaviour of viscous drops is known to be profoundly different in a hyperbolic strain flow (for which the vorticity is zero), and in a simple shear flow with a velocity gradient of the same magnitude.
As previously mentioned, creating shear-free flow is somewhat difficult and experimental devices based on filament stretching, contraction flow or opposed jets have sometimes been used. But the most commonly used device is the so-called four-roll mill first proposed by Taylor (1934). This Taylor cell is composed of four cylinders with parallel vertical axes, placed at the corners of a square. The cylinders rotate with an angular velocity ω, adjacent cylinders turning in opposite directions. This produces a purely
extensional flow near the centre of the device (Torza, 1975;
Higdon, 1993). The Taylor cell is well suited to studying the influence of an extension rate on an object, as long as the object is positioned and stays at the stagnation point (Kalb et al., 1981; Sherwood, 1984; Borrell and Leal, 2007; Ha and Leal, 2001; Hamberg et al., 2002). Approximation is less good when the flow is considered in the whole cell since the fluid is sheared near the tank wall and the elongation rate decreases strongly in these
regions. However, no device exists which allows a constant elongational rate to be maintained for the entire fluid over several hours.
The general objective of this study is to analyze the aggregation processes occurring in concentrated suspensions placed under hydrodynamic conditions similar to those encountered in real processes. More specifically, we aimed to characterize the influ-ence of the hydrodynamic conditions on the aggregation process. For that purpose, three different devices were considered. A stirred tank, similar to many industrial apparatuses, but characterized by rather complex hydrodynamics, was first used. The granulometric properties of the particles and the rheological behaviour of the suspensions were analyzed off-line. A Couette geometry, in which it was possible to apply a constant shear rate close to the mean shear rate imposed in the stirred tank, was then considered in order to analyze the effect of a pure shear flow on the silica aggregation process. There, the variations of the rheological properties were analyzed on-line, performing the aggregation process directly inside the Couette geometry. Finally, a four-roll Taylor cell, mainly characterized by an elongational flow, was used. As in the turbulent reactor, samples were withdrawn in that last case and characterized through particle size distribution and rheological measurements. A colloidal silica suspension, destabi-lized by addition of salt, was chosen as a model particulate system in our experiments.
2. Materials and methods 2.1. Material and analytical devices 2.1.1. The nanoparticle suspension
The fluid used in the experiments was a stable colloidal silica suspension: Klebosol 30R50 (AZ Electronic Materials, France). The initial solid content of Klebosol 30R50 was 30% w/w. The silica particles were spherical and relatively monodispersed around a volume mean size of 110 nm. By means of dynamic light scattering analysis and with measurements of pH and zeta potential, it was established that the suspension was stable and homogeneous (Tourbin and Frances, 2007). Klebosol 30R50 is a Newtonian fluid with a dynamic viscosity of 0:0025 70:0005 Pa s at 20 1C (Bohlin C-VOR Rheometer, Malvern Instruments Ltd).
Just before each experiment, the Klebosol suspension was desta-bilized by addition of salt (sodium chloride). The procedure consisted in mixing the Klebosol suspension with an 2 M aqueous salt solution leading to a final NaCl concentration of 0.8 M in the experimental device and a solid content of silica of 19% w/w. The salt solution was prepared with deionized water (pH~6, conductivity ~5–7 μS). The density of the final suspension was ρ ¼ 1135:6 kg m−3.
2.1.2. Particle size and structure characterization
Particle size analyses were done off-line by laser light diffrac-tion (Mastersizer 2000, Malvern Instruments Ltd) on samples taken during the aggregation process.
Furthermore, static light scattering is also used to obtain information about the structure of the aggregates (Thill et al., 2000). However, some assumptions had to be made. For a fractal aggregate with no multiple scattering, the angular scattered intensity can be expressed by
Idif f∝FðqÞ : SðqÞ ð1Þ where FðqÞ is the form factor, SðqÞ is the structure factor and q is the scattering vector. q is defined by
q ¼4πm λ sin θ 2 ! " ð2Þ
where m is the optical contrast, λ is the wavelength of the incident light, and θ is the scattering angle. The form factor is the scattered intensity from spherical primary particles (hereafter called scat-terers) and the structure factor is the Fourier transform of the average mass autocorrelation function. For fractal geometry, SðqÞ is a power law:
SðqÞ∝q−Df when r o o 1=qo oH ð3Þ
where Dfis the fractal dimension, r is the scatterer radius, and H is the distance above which the mass distribution inside the aggre-gate can no longer be considered as fractal.
Plotting the structure factor versus the scattering vector in a log–log graph, the apparent fractal dimension can be deduced from the slope of the decreasing linear part of the curve (Zhang and Buffle, 1996). For the sake of simplicity, the fractal dimension can also be determined from the plot of the scattered intensity versus the scattering angle. This method was applied to estimate the fractal dimension of silica aggregates after different operating times and for the different runs. Note that this method does not take into account the size polydispersity of the aggregates, so this structural value underestimates the real value of Df(Texeira, 1988).
2.1.3. Rheological characterization
For rheological measurements, a Bohlin C-VOR apparatus (Malvern Instruments Ltd) was used. The rheological properties of the suspensions were analyzed on samples taken during the aggregation process when performed in the stirred tank or in the Taylor cell. They were analyzed immediately after sampling, using a cone and plate geometry or serrated plates. Concerning the experiments performed with the Couette cell, the rheological properties of the suspensions were measured on-line since the Couette geometry was mounted directly on the rheometer.
Shear-thinning behaviour observed for the suspensions was fitted using a power-law model:
τ¼ k_γn ð4Þ
where τ and _γ are the shear stress and the shear rate, respectively, k is the consistency and n is the fluid index. _γ is calculated from the components of the strain rate tensor S:
_γ ¼ ffiffiffiffiffiffiffiffiffiffiffiffiffiffiffiffiffiffiffi2∑ i,j Si,jSj,i r with S ¼1 2ð∇V þ ∇V TÞ ð5Þ 2.2. Experimental devices 2.2.1. Reactor
The aggregation process was performed in a 1 L baffled vessel of diameter 10 cm with a 20 1C water jacket. An axial flow impeller A310 (Lightning) of diameter D ¼ 65 mm rotating at a constant rate N ¼ 7:5 s−1(revolutions per sec) was used during the
opera-tion. Note that lower stirring rates were not possible as part of the suspension solidified below 7.5 r.p.s.
The generally accepted definition for the Reynolds number in mixing systems is
Re ¼ ρND
2
η ð6Þ
where ρ and η are the fluid density and the fluid viscosity, respectively. Concerning non-Newtonian fluids with non-constant viscosity, the classical expression for mixing systems (Tanner, 1988) was used:
Re ¼ Ks1−nρN2−nD2
k ð7Þ
where Ks is the Metzner–Otto constant which is a function of the impeller-vessel configuration only. Numerous studies propose Ks
values and, for turbines, Ks lies in the range 10–13 (Chhabra,
2003). The Reynolds number varied during experiments and can
be calculated using the n and k parameters of the fluid which were measured all along the experiment. The range for the generalized Reynolds number was from 1700 to 2600. The flow was therefore in the intermediate regime and we can define a mean shear rate _γm
using the law: _γm¼ ffiffiffiffiffiffi P ηV s ð8Þ where η is the dynamic viscosity and V is the volume of fluid. The power consumption P is linked to the power number Np by P ¼ NPρN3D5. For the A310 impeller, Np is equal to 0.3 (Roustan,
2005)
2.2.2. Couette cell
A Couette cell was used to generate a pure shear flow. It was composed of an inner cylinder of radius R1¼ 33 mm and height
56 mm rotating at a velocity ω (rad s–1) in a fixed concentric outer
cylinder of diameter R2¼ 35:6 mm. The ratio R1=R2is close enough
to 1 that the shear rate _γccan be considered as constant in the gap.
This cell was directly mounted on the rheometer (Bohlin C-VOR, Malvern Instruments Ltd) which imposed the chosen shear rate and simultaneously measured the torque for the calculation of the shear stress. The viscosity was then computed.
The dimensions of the cylinders were chosen as a compromise between a gap compatible with the largest particles sizes (which reach 100 mm), a cell compatible with the rheometer device and a shear rate similar to the mean shear rate observed in the reactor. With the internal and external radius chosen, the variations of the shear rate on a radius were around 7 7% when the fluid is a Newtonian one, and 715% for a shear-thinning fluid with a fluid index equal to 0.5. Sand with a mean particle size of 250 mm was stuck to the wall to prevent slip effects (Coussot and Ancey, 1999; Buscall et al., 1993).
To prevent settling of the particles, a peristaltic pump drew the fluid from the bottom of the cell and injected it at the top. The pump rate was chosen in such a way that the shear rate in the pipe matched the shear rate in the cell. Comparison between particle sizes of samples taken at the top and at the bottom of the cell ensured that settling was avoided.
Due to the variations of the shear rate in the gap and to the evolution of the non-Newtonian characteristics of the suspension during an experiment, the shear rate is non-constant in space and in time. To impose a constant shear rate does not seem realistic, so we chose to work with a constant rotation speed ω during an experiment, which corresponds to a mean shear rate in the Couette cell: _γc. Three different values for this mean shear rate
were tested: 200 s−1, 100 s−1and 50 s−1. The corresponding values
for ω were estimated from the calculation of the average value of the shear rate in the gap for a Newtonian fluid. The spatial and temporal shear rate variations observed for each Couette experi-ment are reported inTable 1. These values were calculated using the fluid index values determined from on-line rheometry carried out during experiments, and according to a power-law behaviour (Bird et al., 1977) _γðrÞ ¼ −2ω1n 1− R1 R2 ! "2=n!−1 r R1 ! "−2=n ð9Þ Dimensions and shear rates were chosen to avoid inertia effects. The Reynolds number is based on the gap e ¼ R2−R1and
on the tangential velocity on the inner cylinder ωR1
Re ¼ ρR1ω ðR2−R1Þ
For non-Newtonian fluids, it is generalized by (Loureiro et al., 2006)
Re ¼ ρðωR1Þ
2−nen
k ð11Þ
The Taylor number which compares centrifugal inertia forces and viscous forces is defined by
Ta ¼ρ
2ω2R
1ðR2−R1Þ3
η2 ð12Þ
For R1≈R2, it has to be less than 1708 to avoid instabilities
(Taylor, 1923).
The maximum Reynolds numbers reached were respectively 125, 50 and 18 for the three _γcvalues 200 s−1, 100 s−1and 50 s−1,
and the maximum Taylor number was 90. As for the calculation of the shear rates ofTable 1, the real fluid index was used for Re and Ta estimation.
Experiments were performed in an air-conditioned room and temperatures in the Couette cell were 21 71 1C.
2.2.3. Taylor cell
The Taylor cell consists of four circular cylinders (radius R) centered on the corners of a square immersed in a tank as
presented in Fig. 1a. The resulting gap between two adjacent
cylinders is called h. The cylinders rotate at the same angular velocity ω but adjacent cylinders rotate in opposite directions. Hydrodynamics in the Taylor cell depends on the gap-to-diameter ratio h=2R and, as previously mentioned, the flow is not a pure extensional one. Considering all the works reporting studies with a four-roll mill, the range for the h=2R ratio is from 0.22 to 0.8. Most of these studies focused on the very central region of the Taylor cell to analyze the deformation of an object in an extensional flow. Only a few propose information on hydrodynamics in the whole cell. Among these,Bentley and Leal (1986b)recommend h=2R near to 0.25 (in the range 0.17–0.42), a value which results in a good match between the desired hyperbolic streamlines and the cylindrical roller surface, while Higdon (1993) suggests 0.6 to ensure a uniform extension rate in a square region between the cylinders. Observed from our own numerical simulation, a value of 0.3 leads to a flat profile in the gap between two cylinders.
Andreotti et al. (2001) among others (Lagnado and Leal, 1990;
Lee and Muller, 1999; Hsu and Leal, 2009) adopted this value. They demonstrated the appearance of instabilities of the two impinging jets in the centre of the cell for a Reynolds Reext (based on the
extension rate) higher than 17. In the same way,Lagnado and Leal (1990)focused on the initial appearance of 3D instabilities at the bottom of the cell. Using a Reynolds number based on the gap and on the tangential velocity on the cylinder, they observed such structures for Reynolds larger than 37. These two conditions were carefully examined for our cell. We chose the value 0.3 for the ratio h=2R.
The four-roll mill used in this study consisted of four cylinders of radius R ¼13.7 mm and height 120 mm rotating in a cylindrical tank of radius 57 mm. The four cylinders centers formed a square of side 35.6 mm. The gap h between two adjacent cylinders was 8.2 mm. (Fig. 1a). The cylinders rotation is controlled by stepper motors monitored by a generator (Fig. 1b).
To prevent the decantation of the suspension, a peristaltic pump drew up fluid at the bottom of the cell and injected it at the top. The pump rate was chosen low enough to avoid rupture of aggregates due to shear flow in the recirculation pipe. A constant-temperature bath regulated the constant-temperature of the Taylor cell to a value of 21.5 1C70.5 1C. To prevent slippage of the suspension on the walls, sand was glued to the cylinders as done for the Couette cell.
FollowingTorza (1975), the extensional rate in the stagnation zone of the cell was estimated by
_ε≈2ω π ln 2Rþ h h ! " ð13Þ
We use the definition of Lagnado and Leal (1990) for the
Reynolds number: Re ¼ ρωR h
η ð14Þ
To estimate the maximum Reynolds number observed during an experiment, the smallest value of the viscosity obtained using the rheograms of the fluid and the highest values of shear rate and extensional rate were considered. This maximum Reynolds number was reached at the end of the experiment and was equal to 6.6. The Reynolds was then always lower than the critical value of 37 observed byLagnado and Leal (1990)for end effects. In the
Table 1
Variations of the shear rate corresponding to the three experimental shear rates _γc(xx s−1/yy s−1stands for the wall shear rate on the
internal and on the external cylinders respectively).
Experimental shear rate _γc( s−1) 200 100 50
For the highest viscosity (first measure at t¼15′) ( s−1) 233/166 132/72 96/21
At the end of the experiment ( s−1) 218/178 112/87 58/41
same way, the maximum extensional Reynolds number as defined byAndreotti et al. (2001)was 3.7. This is lower than the critical value Ren
ext¼ 17 and thus ensures that the flow is stable in the
centre of the cell.
2.3. Experimental procedures 2.3.1. Methods for the reactor
Just after the addition of salt, the fluid (670 mL) was poured into the reactor and the impeller rotated for 6 h. From time to time, samples were taken for particle size distribution and rheological measurements. For granulometric analysis, a sample of 0.5 mL of the suspension was taken at the top of the tank and mixed with a 2 mL buffer at pH 2. At this pH, the suspension attains its maximal stability and the aggregation and disruption processes are stopped (Iler, 1979; Tourbin, 2006). Each particle size analysis, performed in dilute conditions, took less than 1 min. Concerning rheological characterization, the samples were ana-lyzed by simple shear measurements using a parallel geometry (gap ¼1 mm) with serrated plates (roughness 150 μm, diameter 60 mm). A three-point rheogram was determined by a 15 s-stepwise increase of the shear rate _γi.
The experiment was performed twice in order to ensure reproducibility.
2.3.2. Methods for the Couette cell
The fluid was poured into the Couette cell and the inner cylinder rotated at a constant shear rate _γc for 6 h. Every 2 s, the
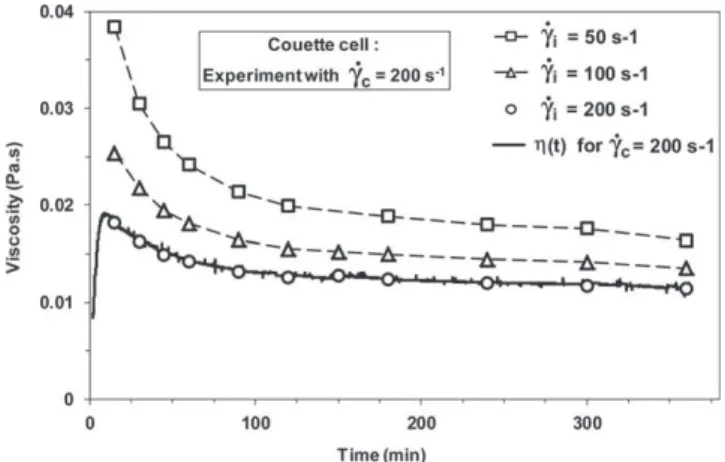
rheometer measured the viscosity. At certain times, to measure rheological property variations, a three-point rheogram was deter-mined with intermediate shear rates _γi (as presented inFig. 2) to
obtain the viscosity at 50, 100 and 200 s−1(for an experiment at
_γc¼ 200 s−1). Sequences like the one presented in Fig. 2 were
linked to pilot the rheometer during the whole experiment. To avoid disturbance of the aggregation process, the intermedi-ate shear rintermedi-ates _γi were always lower than the main shear rate _γc
and the length for this measure (65 s) was short enough to consider that the rheology was constant during this period. For granulometric measurements, just before each rheogram, a sample of 0.5 mL of the suspension was taken and analyzed as for the reactor experiment. Each experiment was performed twice in order to ensure reproducibility.
2.3.3. Methods for the Taylor cell
The fluid was poured into the Taylor cell and the cylinders rotated at a constant rate for 6 h. Three extensional rates were used and experiments were performed twice to ensure reprodu-cibility. As for the reactor, samples of suspension were analyzed (rheometry and granulometry) at regular intervals.
3. Aggregation in turbulent flow
Runs were performed in the reactor at a constant rotation speed (450 rpm). The influence of the rotation frequency on the aggregation process was studied previously (Tourbin and Frances, 2009). At 450 rpm, we can estimate that the mean shear rate _γmin
the reactor was about 110 s−1and the Reynolds number was 1760
for the maximum viscosity (t≈30 min) and 130 s−1and 2420 at the
end of the experiment.
The viscosity of the suspension for different shear rates is plotted versus time in Fig. 3. The viscosity increased abruptly during the first 30 min or so and then decreased smoothly until stabilization. Viscosity decreased with the shear rates _γi of
rheo-metry measurements, revealing a shear-thinning behaviour. Shear-thinning variations are presented along with the Couette and Taylor measurements.
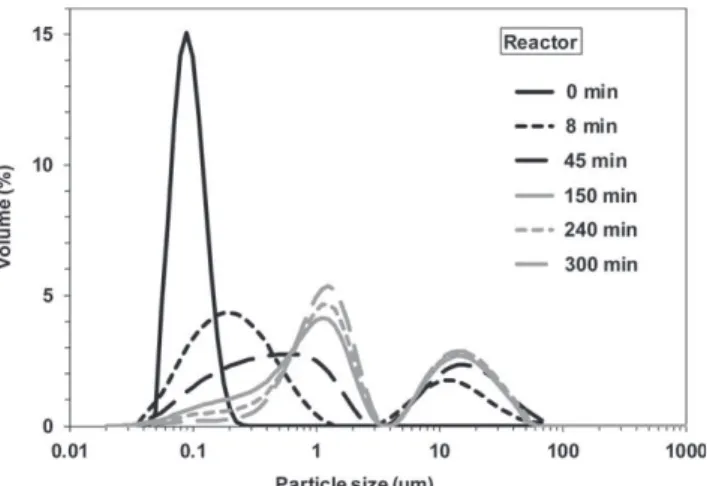
The particle size distribution (PSD) was also determined on samples taken at the same times at which the rheological proper-ties were characterized. For clarity, only the most relevant gran-ulometric curves are presented (Fig. 4). Initially, the silica particles were rather monodisperse with a volume mean size around 110 nm. Rapidly, large aggregates (with a size around 15 mm) were produced (see t ¼ 8 min inFig. 4). The particle size distributions thus became bimodal with a peak characteristic of the large aggregates and a second one corresponding to the presence of the initial single particles and small aggregates. During the first hour of the process, the large aggregate peak increased slightly in intensity and the second peak moved towards larger sizes. After 150 min, the initial particles had nearly all disappeared yielding a granulometric peak around 1.3 mm. During the following hours of the process, the particle size distributions continued to evolve but much less quickly. The peak of the smallest aggregates decreased slightly and the peaks of the intermediate and large aggregates increased in the same proportion.
Fig. 2. Example of a time sequence for a three-point rheogram.
Fig. 3. Evolution of the viscosity in the reactor for three shear rate measurements.
Fig. 4. Volumetric PSD of a silica suspension during the aggregation process performed in the reactor.
Thus, the size distribution drastically changed within the first hour of the process. During this period, the suspension viscosity also changed significantly. Initially, the formation of aggregates led to a rapid and strong increase of the viscosity. Before destabiliza-tion, the suspension was stable, and the silica particles subjected to repulsive interactions. After salt destabilization, attractive forces between the particles increased and became predominant; this led to a polydisperse suspension. The viscosity was maximal after around 20 min in the conditions of the experiment reproduced in
Fig. 3. Then, it decreased significantly even though the aggregation (and hence the particle size distribution) continued to change. The viscosity decrease is not so easy to explain. Indeed, various effects may occur and compete.
When the aggregates are created, if they are spherical and with given compactness and size, according to the Krieger and Dough-erty law (Barnes et al., 1989), the viscosity slowly increases because the global volume fraction of the solid part in the suspension increases owing to the liquid trapped inside the aggregates. On the other hand, there is also a morphological effect. Indeed, using results on the influence of particle shape reported by
Barnes et al. (1989), it can be said that for a constant number of aggregates, at a given number of particles aggregated and for a constant density of these aggregates, the increase in viscosity is minimal for spherical aggregates and maximal for high shape factor aggregates. However, for a given number of aggregates, if the aggregate compactness increases, the viscosity decreases.
The variation of fractal dimension versus time allows an estimate of the evolution of the compactness of the aggregates during a run. However the fractal dimension has a physical sense only if the number of primary particles constituting an aggregate is large enough. So, only data recorded after 1 h for the run performed with the reactor were considered. It was observed that the fractal dimension, deduced from the slope of the curve of the scattered intensity versus the scattering vector, decreased slightly from 1.3 (after 1 h of the process) to 1.00 (after 6 h). More detailed results will be given in Section 6. This suggests that the aggregate compactness decreased as their size increased.
So, the changes occurring in viscosity versus time probably result from competition during the aggregation process between the different effects mentioned above. When the aggregates appear, we first observe a quick increase of the viscosity. Then during the next hours of the aggregation process, there is still a slow reduction of the number of small particles and despite the decrease in the aggregate compactness, the global viscosity decreases.
To determine the effect of the flow conditions on the aggrega-tion process more precisely, two types of specific flow (the shear and the extensional flows) existing in stirred tanks were studied separately.
4. Aggregation and rupture in pure shear flow
Experiments were conducted for three shear rates _γc: 200 s−1
(Reo130, Tao1300), 100 s−1 (Reo 50, Tao205) and 50 s−1
(Reo18, Tao28). Viscosity η(t) measured for the _γc¼ 200s−1
experiment is plotted versus time in Fig. 5 together with the
viscosity for the the same experiment resulting from the three-point rheograms which give the viscosity at three different shear rates _γi. As for the reactor, this confirms a shear-thinning
beha-viour and shear-thinning can already be seen to be maximum after about 10 min.
Comparing now the three different experiments at 200, 100 and 50 s−1,Fig. 6 proposes the viscosity at the same shear rate
(50 s−1). These results clearly show differences between
suspen-sions during the experiments and demonstrate the influence of
hydrodynamics. The objects in these three suspensions then differ by their size, their morphology or their compactness.
In order to estimate the changes occurring in the particle size distributions, samples were taken during the runs. Values for the three different experimental shear rates _γc are reported in
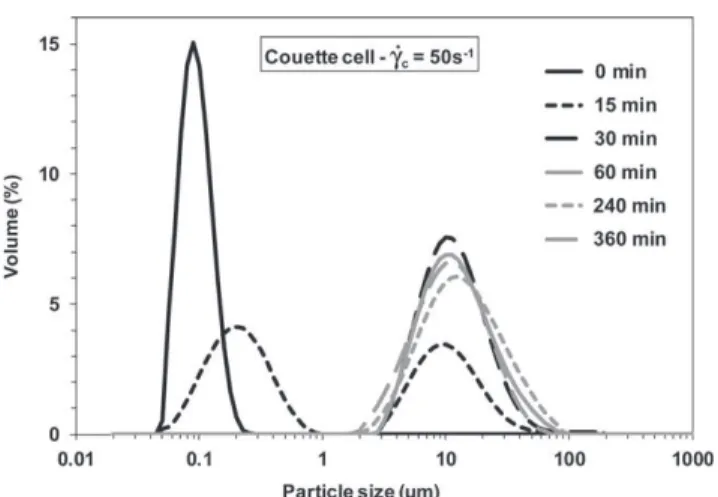
Figs. 7 and 8 versus time. For an imposed shear rate of 50 s−1
(Fig. 7) all the primary particles disappeared after 30 min to form aggregates. The aggregates obtained seem to be rather monodis-perse with a volume mean size around 10 μm. This mean size remained constant during the next hours of the experiment.
For a shear rate of 200 s−1 (Fig. 8), two distinct aggregate
populations appeared after a few minutes with mean sizes respec-tively around a few microns and 10 μm. But primary particles (or very small aggregates with a size around 200 nm) still occurred after several hours of the process.
For an intermediate shear rate of 100 s−1single particles were
no longer observed after 6 h of the process and the final size distributions presented only two populations (intermediate and large aggregates).
Whatever the shear rate imposed, it was observed that the fractal dimension of large aggregates decreased versus time, indicating that the complexity of the aggregates increased with their size. The values obtained from the scattering curves were rather low, varying between 1.2 and 1.6 at t¼ 1 h and 1.0 and 1.5 at t¼3 h depending on the shear conditions. See Section 6 for more details.
As a conclusion, the process of destabilization under shear leads to the formation of one or two populations of aggregates,
Fig. 5. Couette cell experiment at _γc¼ 200 s−1: viscosity of the suspension versus
time and viscosity at three specific shear rates _γi taken from the three-point
rheograms.
Fig. 6. Viscosity of the suspension in the Couette cell at 50 s−1 for the three
depending on the shear rate imposed in the Couette cell. The two populations of aggregates are characterized by a mean size around 2 or 3 μm and around 10 μm. These populations are similar to the ones formed in the stirred tank. Moreover, increasing the main shear rate, the aggregation is limited; indeed, all the primary particles were aggregated under a shear rate of 50 s−1but some
primary particles or very small aggregates still existed after several hours when the shear rate was higher. The hydrodynamic condi-tions affect the collision frequency (increasing the shear rate, the collision frequency increases), but also affect the collision effi-ciency, which expresses the ability when two particles collide, to form an aggregate (increasing the shear rate the collision effi-ciency probably decreases). Finally, the breakup of the largest aggregates (around 10 mm or more) can be observed for the highest shear rates generating aggregates with an intermediate size around a few microns.
Looking at the changes occurring in parallel in the granulo-metric and rheological properties versus time, it is clear that the presence of large aggregates (around 10 mm) leads to an increase of the viscosity as reported above inFig. 6.
5. Aggregation and rupture in extensional flow
Three rotation rates were used to obtain three extensional rates _ε estimated at 1.22 s−1, 2.45 s−1and 4.89 s−1according to the Torza
equation (Eq. (13)).We obtained very similar granulometric and rheological measurements for the three experiments. So only results obtained for the intermediate extension rate (2.45 s−1) will
be presented. As previously observed for the reactor and the Couette cell, an abrupt increase of the viscosity was also noted during the first 15/30 min, followed by a smooth decrease (Fig. 9). The granulometric results indicated that all primary particles disappeared after 30 min, and aggregates formed with a mean size around 20 μm (Fig. 10). These large aggregates do not seem to be subsequently broken down at these extensional rates. As reported before for the other geometries, the fractal dimension of the largest aggregates presents in the suspension decreased slightly versus time for the run performed under an extension rate of 2.45 s−1. For example, the fractal dimension of aggregates was
around 2.3 at t¼30 min, 1.9 at t¼3 h and 1.6 at t ¼6 h.
6. Comparison and shear-thinning behaviour
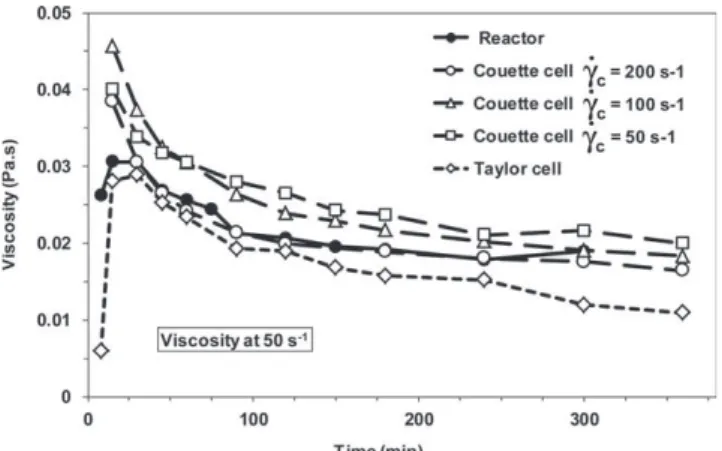
Figs. 11–13 allow a comparison of all the experiments:Fig. 11
presents the viscosity measured at the same shear rate (_γi¼ 50s−1)
versus time, Fig. 12 the size distributions at the end of each experiment andFig. 13the scattering intensity versus the scatter-ing vector for some experiments.
If we compare the viscosity of the three experiments measured at the same shear rate, _γi¼ 50s−1, we can note that the viscosity
obtained for the Couette cell at _γc¼ 200s−1was very close to that
in the reactor (Fig. 11). This can be accounted for by the fact that
Fig. 7. Volumetric PSD of the suspension in the Couette cell for a shear rate _γc¼ 50 s−1.
Fig. 8. Volumetric PSD of the suspension in the Couette cell for a shear rate _γc¼ 200 s−1.
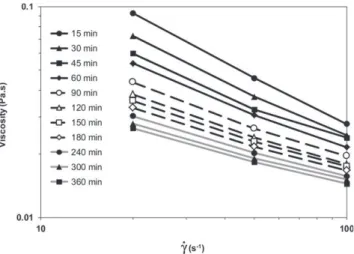
Fig. 9. Viscosity of the suspension in the Taylor cell versus time for an extensional rate _ε ¼ 2:45 s−1measured for four shear rates _γ
i.
Fig. 10. Volumetric PSD of the suspension in the Taylor cell for an extensional rate _ε ¼ 2:45 s−1.
the mean shear rate in the reactor at the end of the experiment is about 200 s−1. The maximum viscosity in the reactor was reached
a little later than for the Couette cell maybe due to the rapid evolution of the viscosity at the beginning of the experiment. Indeed in the Couette cell, the shear rate remained constant whereas in the reactor this induced a temporal change on the shear rate field. Aggregate sizes were similar between the two experiments but larger aggregates (2–15 μm) were present in the
reactor than in the Couette cell and, correspondingly, smaller aggregates of size 0.2 μm remained in the Couette cell. This can be explained by the shear field in the reactor. The shear rate is non-uniform in the reactor, so a weak shear rate area can lead to the creation of larger aggregates.
For the experiments performed with the Taylor cell, the viscosity of the suspension remained weaker than for the experi-ments in the reactor or the Couette cell. Surprisingly, the aggre-gates obtained were larger than those created under a pure shear flow (around 20 μm) whereas for the Couette cell, it was con-cluded that the larger the aggregates, the higher the viscosity was. One explanation could be that the aggregates created by exten-sional flow or by shear flow have different structures, leading to differences in the macroscopic suspension viscosity. As the results in the reactor and in the Couette cell were very similar, we can assume that extensional rate effects were insignificant in turbulent flow.
These results may also be explained in connection with the fractal dimensions determined by static light scattering. Reported scattering curves concern samples taken after 3 h of the process for which the presence of intermediate or large aggregates is large enough compared to the primary particle population. The calcu-lated fractal dimensions are typical of intermediate and/or large aggregates. Indeed, the method is not sufficiently sensitive to distinguish the fractal dimension of each sub-population of aggregates when the size distributions cover several populations. The last part of the curves, i.e. for the largest values of the scattering vector, gives the scattering intensity of the primary particles with a fractal dimension close to 3. We can observe in
Fig. 13that the curve corresponding to the run performed with the Taylor cell is significantly different from others and the corre-sponding fractal dimension is close to 2. The scattering curve for the reactor is similar to that of the Couette cell, and more precisely to the run performed at 100 s−1. This is coherent with the size
distributions of the aggregates, and more specifically the largest ones, which are rather similar for the runs performed with the reactor and the Couette cell at 100 s−1(seeFig. 12)
The fractal dimensions determined after 3 h of the process for each run performed under various conditions and for the three geometries used are reported in Fig. 14. The structure analyses gave a mean fractal dimension of 1.5 for the larger aggregates observed in each condition and for experiments in the reactor and in the Couette cell. The mean fractal dimension reached 2 for the experiments in the Taylor cell. It can then be observed that, not only were the aggregates larger and the viscosity lower in the extensional flow, the aggregates were also organized in more
Fig. 11. Viscosity of the suspension measured at the shear rate _γi¼ 50 s−1for the
Taylor cell, the reactor and the Couette cell experiments.
Fig. 12. Volumetric PSD of the suspension at the end of the destabilization process for the various hydrodynamic conditions experimented.
Fig. 13. Evolution of the scattering intensity versus the scattering vector for some hydrodynamic conditions experienced (t¼ 3 h).
Fig. 14. Comparison of the fractal dimensions of aggregates formed during various runs performed using the reactor, the Couette and the Taylor cells under different operational conditions (t ¼ 3 h).
compact structures, that could justifiably lead to the lower viscosity.
To study the shear-thinning behaviour of the suspension more precisely, we modeled the viscosity by a power law (Eq.(4)) using a linear regression of the viscosity versus shear rate (Fig. 15).
We obtained the two parameters: k and n. At t¼0, the suspension was a blend of two Newtonian fluids and it is reasonable to consider it as Newtonian. As a result, n was equal to 1 at t¼0. We then observed an abrupt decrease of n during the 15–30 first minutes
(Fig. 16a). The fluid then presented a strong shear-thinning behaviour after which, n slowly increased and stabilized.
An explanation can be that at the beginning of the experiment, the bonds between particles in the aggregates are weaker, so the aggregates may take different forms with the shear stress. Then particle shapes become increasingly stable and the shear-thinning behaviour is attenuated. For the Couette cell, the shear-thinning effect decreases with the main shear rate. This can be understood by the presence of large aggregates for low shear rates, more likely to change their shapes. Moreover, the low shear rates enable the presence of weak bonds between particles leading to more flexible aggregates. Suspension in the reactor was more shear-thinning than in the Couette cell for 200 s−1, this could be due to the
presence of fewer large aggregates.
Suspensions in the Taylor cell were less shear-thinning than in the Couette cell for 50 s−1although the aggregates were larger.
This is coherent with the higher fractal dimension estimated from granulometric measurements and can confirm a difference of shape between aggregates formed in the Couette and Taylor cells. Similar observations can be made on the consistency k. The suspension is a blend of two Newtonian fluids of viscosity 2.5 & 10–3
and 1.2 & 10–3Pa s. At t¼ 0, and before any aggregation can occur, the
suspension can be considered as having a low viscosity when compared to the first measured values at t¼15 min. This is confirmed on the Couette cell experiments where one viscosity (for _γ ¼ _γc) was
measured in a continuous way from t¼2 min (seeFig. 16b). So k reaches a maximum (not observed) and then decreases to a stable value at the end of the experiment. Comparing the three Couette cell experiments, the value of k is seen to decrease with the experiment shear rates.
7. Conclusion
The experimental results reported here show that flow has a great influence on the aggregation process. We first studied turbulent flow in a reactor. During the aggregation process, viscosity increased during about 20 min and then decreased gently to stabilization. The decrease of the viscosity can be interpreted as a re-shaping of the aggregates during the experiment. The aggregated fluid is shear-thinning and the more viscous the fluid is, the stronger its shear-thinning behaviour.
We then focused on the two types of flow occurring in a turbulent flow: shear and extensional flows. Suspensions in a pure shear flow at a rate equivalent to the mean shear rate in the reactor exhibit almost the same behaviour as in the reactor. The lower the shear rate, the larger the aggregates, and this leads to an increase of the viscosity and of the shear-thinning behaviour. This can be explained by the fact that large aggregates may take different shapes depending on the flow rate.
As the aggregation process in the reactor is very close to the aggregation in a pure shear flow, the effect of extensional flow can be ignored in turbulent flow in our case. However, pure shear and extensional flows lead to different aggregations. Indeed, whereas the extensional flow formed larger aggregates than in the Couette cell, the viscosity of the suspension was lower. The shear-thinning behaviour was also less strong in the Taylor cell, and this was attributed to a difference of shaping resulting from the prevailing stress: extensional or shear stress.
Nomenclature Latin letters
D impeller diameter (m)
Df fractal dimension (dimensionless)
e Couette gap (m)
Fig. 15. Three-point rheograms for the _γc¼ 100 s−1experiment in the Couette cell.
At each time, the shear-thinning behaviour is modeled by an Ostwald law.
Fig. 16. Power-law parameters n and k versus time for the Taylor cell, the reactor and the Couette cell experiments.
FðqÞ form factor (dimensionless)
h gap between two adjacent cylinders in the Taylor cell (m)
H maximal size for an aggregate to be considered as
fractal (m)
k consistency (kg m–1sn–2)
Idif f angular scattered intensity (cd)
Ks Metzner–Otto constant (dimensionless)
m optical contrast (dimensionless)
n fluid index (dimensionless)
N impeller rotation rate (rev s−1)
Np power number (dimensionless)
P power consumption (W)
PSD particle size distribution
q scattering vector (m−1)
r scatterer radius (m)
R radius of the Taylor cylinders (m)
Re Reynolds number (dimensionless)
Reext extensional Reynolds number (dimensionless)
Ren
ext extensional Reynolds number critical value (dimensionless)
R1 Couette inner cylinder radius (m)
R2 Couette outer cylinder radius (m)
S strain rate tensor (s−1)
Si,j components of the strain rate tensor (s−1)
SðqÞ structure factor (dimensionless)
t time (s)
Ta Taylor number (dimensionless)
V volume of fluid (m3)
Greek letters
ρ fluid density (kg m−3)
_γ shear rate (s−1)
_γc constant shear rate in the Couette cell (s−1)
_γi shear rate at which a rheological measurement is done
(s−1)
_γm mean shear rate in the reactor (s−1)
_ε extensional rate (s−1)
θ scattering angle (rad)
λ wavelength of the incident light (m)
η fluid dynamic viscosity (Pa s)
τ shear stress (Pa)
ω Couette rotation speed (rad s−1)
Acknowledgments
The authors gratefully acknowledge the financial support for a postdoctoral position (M. d’Olce) from the local cooperative structure of joint research FERMaT (FR 3089).
References
Andreotti, B., Douady, S., Couder, Y., 2001. An experiment on two aspects of the interaction between strain and vorticity. J. Fluid Mech. 444, 151–174.
Barnes, H.A., Hutton, J.F., Walters, K., 1989. An introduction to Rheology. Rheology Series, vol. 3. Elsevier.
Bentley, B.J., Leal, L.G., 1986a. An experimental investigation of drop deformation and breakup in steady, two-dimensional linear flows. J. Fluid Mech. 167, 241–283.
Bentley, B.J., Leal, L.G., 1986b. A computer-controlled four-roll mill for investiga-tions of particle and drop dynamics in two-dimensional linear shear flows. J. Fluid Mech. 167, 219–240.
Bird, R.B., Armstrong, R.C., Hassager, O., 1977. Dynamics of Polymeric Liquids. Wiley, New York.
Borrell, M., Leal, G.L., 2007. Interfacial activity of polymer-coated gold nanoparticles. Langmuir 23, 12497–12502.
Buscall, R., McGowan, J.I., Morton-Jones, A.J., 1993. The rheology of concentrated dispersions of weakly attracting colloidal particles with and without wall slip. J. Rheol. 37, 621–641.
Chhabra, R.P., 2003. Fluid mechanics and heat transfer with non-Newtonian liquids in mechanically agitated vessels. Adv. Heat Trans. 37, 77–178.
Coussot, P., Ancey, C., 1999. Rhéophysique des pâtes et suspensions. EDP Sciences, Paris.
Ha, J.W., Leal, G.L., 2001. An experimental study of drop deformation and break up in extensional flow at high capillary number. Phys. Fluids 13 (6), 1568–1576. Hamberg, L., Walkenström, P., Hermansson, A.M., 2002. Shaping of gelling
biopo-lymer drops in an elongation flow. J. Colloid Interface Sci. 252, 297–308. Higdon, J.J.L., 1993. The kinematics of the four-roll mill. Phys. Fluids A 5 (1),
274–276.
Hsu, A.S., Leal, L.G., 2009. Deformation of a viscoelastic drop in planar extensional flows of a Newtonian fluid. J. Non-Newton. Fluid Mech. 160 (2-3), 176–180. Iler, R.K., 1979. The Chemistry of Silica. Wiley, New York.
Israelachvili, J., 1992. Intermolecular and Surface Forces, second ed. Academic Press, London.
Kalb, B., Cox St, R.G., John Manley, R., 1981. Hydrodynamically induced formation of cellulose fibers, II. Fiber formation by deformation of drops with zero interfacial tension. J. Colloid Interface Sci. 82 (2), 286–297.
Lagnado, R.R., Leal, L.G., 1990. Visualization of three-dimensional flow in a four-roll mill. Exp. Fluids 9, 25–32.
Lee, E.C., Muller, S.J., 1999. Flow light scattering studies of polymer coil conforma-tion in soluconforma-tions in extensional flow. Macromolecules 32, 3295–3305. Loureiro, B.V., de Souza Mendes, P.R., Azevedo, L.F.A., 2006. Taylor–Couette
instabilities in flows of Newtonian and power-law liquids in the presence of partial annulus obstruction. J. Fluids Eng. 128 (1), 42–54.
Minale, M., 2010. Models for the deformation of a single ellipsoidal drop: a review. Rheol. Acta 49, 789–806.
Roustan, M., 2005. Agitation. Mélange—Caractéristiques des mobiles d’agitation. Techniques de l’Ingénieur, J3802, T.I, Sciences et Techniques.
Sherwood, J.D., 1984. Tip streaming from slender drops in a nonlinear extensional flow. J. Fluid Mech. 144, 281–295.
Tanner, R.I., 1988. Engineering Rheology. Clarendon Press, Oxford.
Taylor, G.I., 1923. Stability of a viscous liquid contained between two rotating cylinders. Phil. Trans. R. Soc. Lond. A 223 (605-615), 289–343.
Taylor, G.I., 1934. The formation of emulsions in definable fields of flow. Proc. R. Soc. Lond. Ser. A 146 (858), 501–523.
Texeira, J., 1988. Small-angle scattering by fractal systems. J. Appl. Crystallogr. 21, 781–785.
Thill, A., Lambert, S., Moustier, S., Ginestet, P., Audic, J.M., Bottero, J.Y., 2000. Structural interpretations of static light scattering patterns of fractal aggregates —II. Experimental study. J. Colloid Interface Sci. 228, 386–392.
Tolpekin, V.A., Duits, M.H.G., van den Ende, D., Mellema, J., 2004. Aggregation and break-up of colloidal particles aggregates in shear-flow studied with video microscopy. Langmuir 20, 2614–2627.
Torza, S., 1975. Shear-induced crystallization of polymers, I. The four-roller apparatus. J. Polym. Sci. 13 (1), 43–57.
Tourbin, M., 2006. Caractérisation et comportement de suspensions concentrées de nanoparticules sous écoulement: Application aux processus d’agrégation et de rupture. Thèse INPT, Toulouse.
Tourbin, M., Frances, C., 2007. A survey of complementary methods for the characterization of dense colloidal silica. Part. Part. Syst. Character. 24, 411–423. Tourbin, M., Frances, C., 2009. Monitoring of the aggregation process of dense colloidal silica suspensions in a stirred tank by acoustic spectroscopy. Powder Technol. 190, 25–30.
Zhang, J., Buffle, J., 1996. Multi-method determination of the fractal dimension of hematite aggregates. Colloids Surf. 107, 175–187.