HAL Id: hal-02977866
https://hal-univ-pau.archives-ouvertes.fr/hal-02977866
Submitted on 6 Jan 2021
HAL is a multi-disciplinary open access
archive for the deposit and dissemination of
sci-entific research documents, whether they are
pub-lished or not. The documents may come from
teaching and research institutions in France or
abroad, or from public or private research centers.
L’archive ouverte pluridisciplinaire HAL, est
destinée au dépôt et à la diffusion de documents
scientifiques de niveau recherche, publiés ou non,
émanant des établissements d’enseignement et de
recherche français ou étrangers, des laboratoires
publics ou privés.
A Novel Strategy for the Detection and Quantification
of Nanoplastics by Single Particle Inductively Coupled
Plasma Mass Spectrometry (ICP-MS)
Javier Jiménez-Lamana, Lucile Marigliano, Joachim Allouche, Bruno Grassl,
Joanna Szpunar, Stephanie Reynaud
To cite this version:
Javier Jiménez-Lamana, Lucile Marigliano, Joachim Allouche, Bruno Grassl, Joanna Szpunar, et al..
A Novel Strategy for the Detection and Quantification of Nanoplastics by Single Particle Inductively
Coupled Plasma Mass Spectrometry (ICP-MS). Analytical Chemistry, American Chemical Society,
2020, 92 (17), pp.11664-11672. �10.1021/acs.analchem.0c01536�. �hal-02977866�
A novel strategy for the detection and quantification of nanoplastics
by single particle inductively coupled plasma mass spectrometry
(ICP-MS)
Javier Jiménez-Lamana*, Lucile Marigliano, Joachim Allouche, Bruno Grassl, Joanna Szpunar and
Sté-phanie Reynaud
Universite de Pau et des Pays de l’Adour, E2S UPPA, CNRS, Institute of Analytical and Physical Chemistry for the Envi-ronment and Materials (IPREM), Pau, France
Corresponding author
*E-mail: Phone: +33 540175037
ABSTRACT: A method for the detection and quantification of nanoplastics (NPTs) at environmentally relevant concentrations was developed. It is based on conjugating nanoplastics with functionalized metal (Au)-containing nanoparticles (NPs), thus making them detectable by highly sensitive inductively coupled plasma mass spectrometry (ICP-MS) operated in single particle (SP) mode. The selectivity of the method was achieved by the coupling of negatively charged carboxylate groups present at the surface of na-noplastics with a positively charged gelatin attached to the custom-synthesized AuNPs. The adsorbed Au produced a SP-ICP-MS signal allowing the counting of individual nanoplastic particles, and hence their accurate quantification (< 5% error). Polystyrene (PS) particle models with controlled surface functionalization mimicking the nanoplastics formed during natural degradation of plastic debris were used for the method development. The nanoplastic number concentration quantification limit was calculated at 8.4 x 10⁵ NPTs L-1 and the calibration graph was linear up to 3.5 x 10⁸ NPTs L-1. The method was applied to the analysis of nano-plastics of up to 1 µm in drinking, tap and river water. The minimum detectable and quantifiable size depended on the degree of functionalization and the surface available for labeling. For a fully functionalized nanoplastic, the lower size detectable by this strategy is reported as 135 nm. In this study, authors use the recommendation for the definition of nanoplastics as plastic particles
with sizes ranging between 1 nm and 1 µm, although it has not been accepted by a dedicated organization.
INTRODUCTION
The increasing amount of plastic waste in the marine envi-ronment has become a major cause of concern among scien-tists’ community, policy-makers and public opinion1
. Indeed, millions of tons of plastics end up in the oceans where they undergo fragmentation, mostly due to solar radiation, mechan-ical forces and biologmechan-ical action leading to smaller debris2–4. Microplastics (plastic particles below 5µm) have been studied in marine and freshwater systems for a number of years.5 Recently, there has been a surge of interest in the presence and fate of even smaller, sub-µm plastic particles. Such particles have been termed “nanoplastics”,6,7
referring to plastic parti-cles having colloidal behavior and ranging between 1 nm and 1 µm.8 It has to be said, however, that this trend in terminolo-gy is raising controversy, mainly because of the lack of coher-ence with the ISO definition of the term “nano” which requires that at least one dimension of a particle be 100 nm.
Although it has been suggested that nanoplastics are potential-ly more hazardous than microplastics9,10, very little is known about the presence of these emerging contaminants. Besides the fact that nanoplastics can potentially enter higher organ-isms, their presence in the water column may affect planktonic species, and disrupt the energy flow in marine ecosystems11. In addition, due to their high surface area to volume ratio, nano-plastics are expected to be able to adsorb, concentrate and act
as vector of toxic pollutants. Information on the presence of plastic particles in the nanometer size range in the environ-ment is very scarce. Such particles have been detected in the north Atlantic gyre only recently.12
The European Commission has recognized the lack of quanti-tative analytical methods in order to obtain realistic risk as-sessment studies of nanoplastics13. Because of their small size and consisting mainly of carbon, they elude most of the in-strumental techniques available. Therefore, new analytical techniques have to be developed to provide information about the abundance, size distribution and/or chemical composition of nanoplastics at low concentrations and particle size detec-tion limits14,15.
Some techniques usually dedicated to nanomaterials character-ization have been employed for the investigation of nanoplas-tics. They include optical methods such as, e.g., nanoparticle tracking analysis (NTA)16,17, scanning electron microscopy (SEM)18,19, transmission electron microscopy (TEM)20, SEM coupled with energy dispersive X-ray spectroscopy (SEM-EDX),21 and fluorescence microscopy22,23. On the other hand, some authors recently proposed asymmetrical flow field flow fractionation (AF4) coupled to multi-angle light scattering (MALS) in order to detect and characterize nanoplastics in a polydisperse nanoplastic sample24, in a food matrix25, and in spiked eggfishs26. However, these techniques have important drawbacks: they might under- or overestimate abundance, be
tedious and time consuming, and can perturb the physiochem-ical state of the sample27. AF4-MALS may be a powerful tool to obtain particle size distribution, but its sensitivity is too low to match environmentally relevant concentrations of nanoplas-tics. Besides, the above mentioned techniques require an addi-tional sample preparation step, due to the necessity of sample preconcentration.
Mass spectrometry based techniques have also been proposed for the analysis of nanoplastics15. For instance, the use of pyrolysis coupled to gas chromatography-mass spectrometry (Py-GC-MS) was reported for the detection and identification of nanoplastics in aqueous media12,28. The use of a pre-concentration step allowed an improvement of the limit of detection of the technique (20 µg L-1). Py-GC-MS was shown to be a good alternative to Fourier transform infrared (FTIR) or Raman spectroscopy, which are commonly used to provide the chemical identity of particles28. The mass quantification of nanoplastics by Py-GC-MS was investigated upon pre-concentration by cloud-point extraction combined with ther-mal degradation29. Nevertheless, Py-GC-MS still needs to be investigated for quantitative purposes due to the lack of repro-ducibility30. On the other hand, novel approaches based on thermal fragmentation and matrix-assisted laser desorp-tion/ionization time-of-flight mass spectrometry (MALDI-TOF MS)31, and liquid chromatography coupled to high reso-lution mass spectrometry (LC-HRMS) with an atmospheric pressure photoionization source (APPI)32 were recently pro-posed for the mass quantification of nanoplastics and small microplastics. None of these techniques, however, is suitable for the quantification of nanoplastics (number concentration) at environmentally relevant concentrations.
On the other hand, polystyrene (PS), reported in literature33,34 as a major plastic debris occurring in the environment, was chosen as a model for the method development. As commer-cially available polystyrene latex (PSLs) particles contain additives, they were considered not to be representative mod-els because of the scarcity of knowledge of their chemical composition and surface functionalisation.35 Therefore, soap and metal-free model PS nanoplastics with controlled func-tionality and purity were chosen for the analytical develop-ments. More specifically, PS particles functionalized with carboxyl groups at the surface were synthesized, mimicking aged nanoplastics. It has been shown that the surface of poly-mer nanoparticles in the environment present carbonyl groups35, because of oxidation processes. As result, environ-mental nanoplastics presenting oxidized surfaces may act as carriers of other pollutants, such as, e.g., heavy metals. The objective of this work was to develop a novel analytical strategy based on the conjugation of the carboxylate groups present at the surface of nanoplastics with metal-containing functionalized probes in order to make them detectable and quantifiable in aqueous media by single particle inductively coupled plasma mass spectrometry (SP-ICP-MS). This tech-nique, working on a particle-by-particle basis, is able to detect metal-containing nanoparticles with the highest sensitivity, achieving limits of detection down to attograms36. In order to make nanoplastics detectable, the surface carboxylate groups formed during plastics oxidation leading to the formation of nanoplastics were conjugated with custom-designed gold-labelled amine functionalized nanoparticles, so that the conju-gates could be detected and counted as 197Au by ICP-MS with very high sensitivity.
EXPERIMENTAL SECTION
Reagents and chemicals. Gold (III) chloride hydrate (HAuCl4), trisodium citrate dihydrate (Na3-citrate) and gelatin Type A 300 bloom, isoelectric point IEP 8) from porcine skin were purchased from Sigma-Aldrich (Saint Quentin Fallavier, France). Commercial gold nanoparticle suspensions (AuNPs) with nominal sizes of 50 ± 3 and 80 ± 4 nm were obtained from BBI solutions (Crumlin, UK). A standard solu-tion of 1000 mg L-1 gold was purchased from Plasma CAL standards (Teddington, UK). Commercial carboxylated poly-styrene particle suspensions (PSL) with nominal diameters of 759 ± 23, 990 ± 20 and 3030 ± 121 nm were purchased from Polysciences (Warrington, PA). All of them present zeta po-tential values between -47 and -50 mV at pH 7.
Synthesis of gold nanoparticles. Gelatin coated AuNPs (AuNPs@gel) with a median size of 17 ± 3 nm were synthe-sized as follows: monodisperse AuNPs were first elaborated by rapidly injecting Na3-citrate (11.4 g L
-1
, 0.3 mL) into a boiling aqueous solution of HAuCl4 (0.1 g L
-1
, 20 mL) under stirring. Then, a gelatin coating on AuNPs was achieved by injecting drop by drop the previous solution at 40°C into 3 mL of gelatin solution (0.3 g L-1). The size distribution is shown in the supporting information (Figure S-1).
Synthesis of polystyrene (PS) nanoplastic models. PS nano-plastics were synthesized avoiding any additives, especially surfactants, bactericide species and trace metals potentially present in commercial standards. The synthesis and character-istics of soap-free polystyrene models were detailed else-where37. A suspension of spherical particles (PS22) with sur-face functionalized by carboxylic groups was used throughout this study. It presents a number average diameter of 420 ± 20 nm (determined by scanning electron microscopy), a low polydispersity (polydispersity index (PDI) of 0.009), zeta potential of -46 mV at pH 7, particle surface functionality of 45 COOH groups per nm2.
Instrumentation
Single Particle ICP-MS. An Agilent 7900 ICP-MS (Agilent, Tokyo, Japan) equipped with Single Nanoparticle Application Module was used for the detection and quantification of nano-plastics by monitoring the Au signal. The default instrumental and acquisition parameters are listed in Table 1.
The calculation of transport efficiency affects critically the accuracy of in SP-ICP-MS results. The two methods mostly used in literature to calculate transport efficiency are the parti-cle frequency method and partiparti-cle size method38. Transport efficiency was calculated according to both methods using a 50-nm AuNPs suspension as calibration material. The transport efficiency calculated by the particle frequency meth-od was used to determine the nanoplastic number concentra-tion, whereas the transport efficiency calculated by the particle size method was used to determine the mass of Au per nano-plastic particle. The sample flow rate was calculated daily by measuring the mass of water taken up by the peristaltic pump during 2 min. This operation was repeated twice and the aver-age values were used for calculations. After each sample anal-ysis, the software automatically processed the raw data and generated the particle concentration and the signal frequency histogram. The latter was converted into mass distribution through equation 1 that relates signal and mass:
where mp is the mass of Au per nanoplastic, Ip the Au signal in
counts, td the dwell time, q the sample uptake flow, 𝜂n the
transport efficiency and K the response of the instrument per ppb of Au. Time scans and mass distributions were prepared in Origin 8.5 software (Northampton, MA).
Scanning electron microscopy (SEM). Images were obtained using a JEOL JAMP-9500F Field Emission Auger Microprobe operated at 30 kV and 5 nA. The powders were deposited on an aluminum foil and placed in an oven at 120 °C for 5 min before being mounted on the sample microscope holder. Procedure. The analytical strategy developed in this work is based on the conjugation of carboxylated PS nanoplastics with gelatin coated AuNPs. To prepare the suspension of conjugat-ed (PS22 or PSL) nanoplastics, an aliquot of 20 L of AuNPs@gel suspension was mixed with 20 L of a suspen-sion of nanoplastics at a ratio of approx. 500:1 in terms of number of particles. The resulting mixture was diluted accord-ingly with water in order to have a nanoplastic number con-centration of around 1 x 10⁸ L-1 or lower prior to SP-ICP-MS analysis.
Table 1. Default instrumental and data acquisition param-eters for SP-ICP-MS
Instrumental parameters
RF power 1550 W
Argon gas flow rate
Plasma 15 L min-1
Auxiliary 0.9 L min-1
Nebulizer 1.10 L min-1
Sample uptake rate 0.300 mL min-1
Data acquisition parameters
Dwell time 100 µs
Readings per replicate 600 000 Total acquisition time 60 s
Isotope monitored 197Au
Water samples. Drinking water of high hardness (72 mg Ca L-1, 19 mg Mg L-1) was purchased from a local market. Tap water was collected from the municipal water system of Pau, France. River water was collected from Besòs River in Cata-lonia, Spain, in polypropylene conical bottom tubes of 250 ml capacity, previously washed with nitric acid (2 %), rinsed thoroughly with water, and kept at 2~4 ºC until the moment of their analysis. River sample was filtered through 5.0 µm sy-ringe filter before analysis.
RESULTS AND DISCUSSION
In a first approach, the labelling through interactions between COO- groups and positive metal ions was attempted. However, the total amount of metal adsorbed on each nanoplastic parti-cle turned out to be insufficient for the correct quantification. Consequently, an alternative approach was proposed using positively-charged gelatin-coated gold nanoparticles (AuNPs@gel) as adsorbed tags of nanoplastic particles to make them detectable by ICP-MS. Type A gelatin is a protein composed of a set of amino acids, containing NH2 and COOH groups. Due to the protonation state of acid (carboxylates) and
basic (amines) functions, gelatin provides a net global positive charge (isoelectric point 8) at the working pH (6-8)39. There-fore, the labelling is achieved through electrostatic interactions between the global negative charge bearing by the deprotonat-ed carboxylate groups from the surface of nanoplastics, and the positive charge of gelatin-coated gold nanoparticles at neutral pH. In this way, an increase in the total mass of metal adsorbed per nanoplastic particle was achieved in comparison with the use of the ionic metal form.
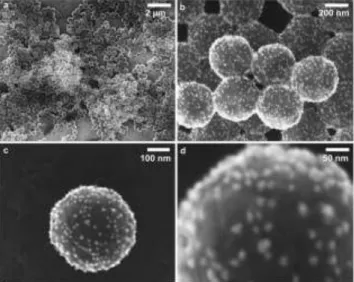
Detection of AuNPs-labelled nanoplastics. A suspension of carboxylated model nanoplastics, PS22, was mixed with a suspension of AuNPs@gel and the resulting suspension of conjugate nanoplastic-AuNPs@gel was analyzed, without further dilution, by SEM. Images in Figure 1 confirmed the successful labelling of nanoplastics by a significant number of AuNPs@gel (white dots) covering the surface of PS22 nano-plastics. Low magnification images (figures 1a and 1b) show several nanoplastics with a good homogeneous gold coverage. In addition, high magnification pictures in figures 1c and 1d display clearly gold nanoparticles adsorbed on a representative single polymer particle. The gold nanoparticles size was esti-mated on the basis of such images around 15 ± 5 nm which is in good agreement with the size distribution obtained by SP-ICP-MS in Figure S-1.
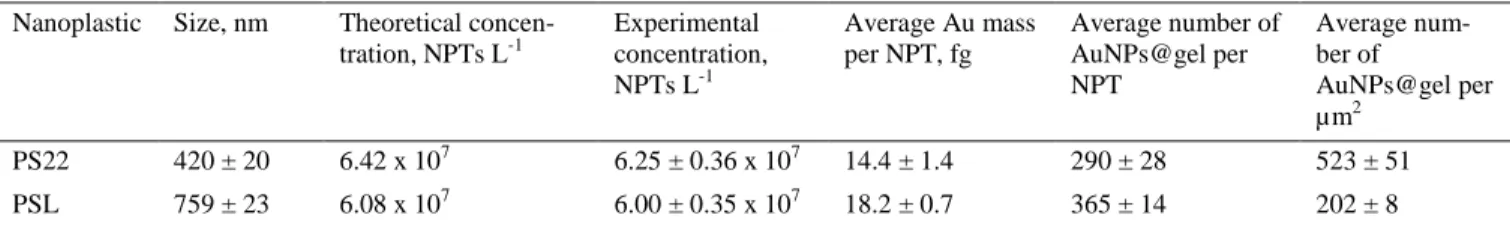
The same suspension was diluted and analyzed by means of SP-ICP-MS. The time scan obtained by monitoring the 197Au signal showed a significant number of pulses above the back-ground (Figure 2a), produced by the ions coming from all the AuNPs@gel attached to a single nanoplastic. In addition, a background signal produced by AuNPs@gel that are not linked to any nanoplastic carriers and hence remain ‘free’ in the suspension is also observed. Since the concentration of ‘free’ AuNPs@gel is relatively high, each droplet introduce into the plasma will contain more than one nanoparticle, re-sulting in a steady background signal instead of individual peaks. The size of AuNPs@gel is also a critical parameter to be taken into account. The use of bigger AuNPs@gel will result in a higher Au mass per nanoparticle but also in a higher background due to nanoparticles not conjugated with nano-plastics that will produce a higher background that may hinder the detection of signals produced by conjugated nanoplastics. On the other hand, the use of smaller AuNPs@gel will pro-duce a lower background, but also a lower signal of conjugat-ed nanoplastics due to the presence of lower Au mass at the surface. The choice of AuNPs@gel of around 17 nm resulted in a good compromise between both factors. The removal of ‘free’ AuNPs@gel may sound attractive. It would lead to a time scan where signals observed are due to conjugates nano-plastics-AuNPs@gel only and hence to avoid a risk of false positives. In the developed methodology, the use of 17 nm AuNPs@gel allowed to obtain well-separated signals, without a previous separation step, making the occurrence of false positives negligible and thus allowing the quantification of nanoplastics.
Figure 1. SEM images of several (a and b) and single (c and d) PS22 nanoplastics labelled with AuNPs@gel
The difference between the signals produced by not linked AuNPs@gel and by conjugated nanoplastics is perfectly re-flected when zooming into the time scan obtained (Figure 2b). In order to confirm this difference, a method blank, consisting of a suspension of AuNPs@gel at the same nanoparticle con-centration as in the previous mixture (~ 3 x 10¹⁰ L-1) but with-out the addition of nanoplastics, was analyzed by SP-ICP-MS. A zoom into the time scan showed the presence of a back-ground signal coming from the AuNPs@gel (Figure 2c), whereas no peaks above the baseline were registered. This confirmed that the peaks observed in Figure 1a corresponded exclusively to nanoplastics conjugated with AuNPs@gel and not to an artefact. In this context, the possible occurrence of big aggregates of AuNPs@gel was investigated. These aggre-gates could produce signals leading to false positives. Figure 2c shows that in the time scan obtained for a suspension of AuNPs@gel, no signals due to agglomerates were observed. In addition, the UV-Vis spectrum of the AuNPs@gel suspen-sion (Fig S-1 b) shows only one single maximum (near 500 nm) corresponding to the typical plasmon resonance wave-length value of near 20-nm gold nanoparticles. Such spectrum is characteristic for well dispersed gold nanoparticles without aggregates.40 It is also important to highlight that the back-ground signal obtained for the sample of conjugated nanoplas-tics is 3 times lower than that obtained for the blank of AuNPs@gel even though the nanoparticle concentration is the same for both suspensions. This can be explained by the fact than in the sample containing conjugated model nanoplastics a significant number of AuNPs@gel is attached to the polymer nanoparticles, and hence the concentration of free AuNPs@gel is lower than in the blank sample.
Finally, the possibility of destabilization of the conjugate nanoplastic-AuNPs@gel by depletion forces due to the high size relation between both particles must be discussed. The aggregation of conjugates would lead to a scenario where some nanoplastics will eventually settle down at the bottom of the suspension and other aggregates will be counted by SP-ICP-MS as single nanoplastics, resulting hence in an underes-timation of the nanoplastic number concentration. In the pro-posed approach, the probability of this scenario is negligible due to the preparation of very dilute suspensions, which limits
the physical contact between conjugates, and the analysis carried out immediately upon mixing. No agglomerates were observed in the next hour following the preparation of the conjugates.
Figure 2. Time scan obtained by SP-ICP-MS for: a) a suspension of functionalized PS22 model nanoplastics conjugated with AuNPs@gel, with a zoom on b); and c) a suspensions of AuNPs@gel at the same concentration
Determination of transport efficiency. Two different meth-ods used to calculate the transport efficiency were compared by analyzing two commercial AuNPs suspensions of different size, 50 and 80 nm.
Transports efficiencies values obtained for both suspensions were in good agreement for each method (3.8 and 3.7 % for particle frequency method and 6.9 and 7.1 % for particle size method) but a significant difference between the methods was
0 1 2 3 4 5 0 500 1000 1500 2000 2500 3000 3500 197 A u si g n al in ten si ty, co u n ts
a)
0 500 1000 1500 2000 2500 3000 3500 197 A u si g n al in ten si ty, co u n ts 0 0.1 0.2 0.3 0.4 0.5b)
0 500 1000 1500 2000 2500 3000 3500 197 A u si g n al in ten si ty, co u n ts 0 0.1 0.2 0.3 0.4 0.5 Time, sc)
0.5 sobtained (Table 2). This difference raised the question of which value should be used for the rest of the study. In order to answer this question, the following experiment was per-formed: one of the AuNPs suspension was used as reference material to calculate the transport efficiency by both methods, while the other AuNPs suspension was used as an ‘unknown sample’ and vice versa. The experimental values of nanoparti-cle number concentration and median diameter for the ‘un-known sample’ were calculated and compared with the theo-retical ones. Results are shown in Table 2.
According to the results obtained, an accurate quantification of nanoparticle number concentration was obtained for both AuNPs suspensions when using the transport efficiency calcu-lated by the particle frequency method, while the particle size method provided errors higher than 40 %. However, the medi-an diameters calculated using the trmedi-ansport efficiency obtained by the particle frequency method were far from the nominal ones, while the particle size method reported accurate diame-ters. Similar results have been previously reported by other authors41. Liu et al investigated both transport efficiency cali-bration methods by using a NIST reference material (RM 8013), coming to the conclusion that the particle size method is more robust and yields accurate results42. However, the transport efficiency value calculated by the particle frequency in this study (3.7-3.8%) is in very good agreement with the values (between 3.5 and 4%) calculated by using the same NIST reference material in previous studies with the same ICP-MS instrument and sample introduction system43,44. Con-sequently, throughout the whole study, the transport efficiency calculated by the particle frequency was used in order to de-termine the nanoplastic number concentration. On the other hand, since according to the SP-ICP-MS theory size and mass are directly related36, the transport efficiency calculated by the particle size method was used to calculate the mass of Au per nanoparticle. Images and size distribution obtained by SEM for the 50-nm AuNPs suspension are shown in Supporting Information (Fig S-2).
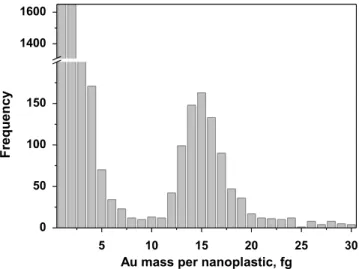
Mass distribution and nanoplastic quantification. Once the transport efficiency determined, the time scans obtained for a suspension of nanoplastics conjugated with AuNPs@gel can be converted into signal frequency histogram and this into mass frequency histogram according to equation 1. As ex-pected, the mass frequency histogram obtained for the suspen-sion of conjugated PS22 model nanoplastics showed two dis-tributions, the first one due to the AuNPs@gel that have not interacted with nanoplastics and the second one due to the AuNPs@gel linked to the surface of the nanoplastics (Figure 3), reflecting the two different types of signals recorded in a time scan (Figure 2b). Note that the Au mass distribution shown in Figure 3 was obtained without taking into account the threshold applied for the quantification of nanoplastics discussed below.
Figure 3. Au mass distributions obtained for a carboxylate PS22 model nanoplastic suspension, after the conjugation with AuNPs@gel and analysis by SP-ICP-MS.
With the analytical strategy presented in this work, the number of peaks above the baseline registered in a time scan is propor-tional to the nanoplastic number concentration. In this context, in order to get an accurate quantification in a nanoplastic sus-pension it is necessary to discriminate between both signals, and hence both distributions must be well resolved. In SP-ICP-MS, the discrimination between the baseline signal and the analyte signal is done by the calculation of a threshold or critical value (YC) through the following equation:
𝑌𝐵= 𝑌𝐶+ 𝑘𝜎𝐵 (2) Where YB is the mean baseline signal and σB the standard deviation of the baseline signal of the sample. A 5σB criterion was used to minimize the occurrence of false positives as proposed by Laborda et al45. In this work, all signals above this critical value were attributed to a conjugate nanoplastics-AuNPs@gel.
Two well-resolved distributions were observed when the strat-egy was applied for the quantification of PS22 model nano-plastics, where a good agreement between theoretical and experimental values was obtained (Table 3). The counting of the number of peaks due to a conjugated nanoplastic was performed through an iterative algorithm previously report-ed46. In addition, by knowing the median mass of Au per na-noplastic and the size of the AuNPs@gel used in this study, an average number of gold nanoparticles attached to the surface of each nanoplastic can be determined, which gives an idea about the yield of the labelling process. For PS22 model nano-plastics, an average of 290 AuNPs@gel per nanoplastic was
obtained (Table 3).
Table 2. Comparison of median sizes and nanoparticle number concentration values obtained by particle frequency and particle size methods for 50 and 80 nm AuNPs suspensions (mean ± standard deviation; n = 3)
Calibration Material AuNPs 50 nm AuNPs 80 nm
Method Particle frequency Particle size Particle frequency Particle size
Transport efficiency, % 3.8 6.9 3.7 7.1
Sample AuNPs 80 nm; 8.69 x 10⁷ NPs L-1 AuNPs 50 nm; 9.32 x 10⁷ NPs L-1
Nanoparticle concentration, NPs L-1 8.46 ± 0.04 x 10⁷ 4.66 ± 0.02 x 10⁷ 1.00 ± 0.02 x 10⁸ 5.23 ± 0.11 x 10⁷ 5 10 15 20 25 30 0 50 100 150 1400 1600 F re q u en cy
Median diameter, nm 63 ± 1 77 ± 1 40 ± 1 50 ± 1
pH plays a key role in the stability of the conjugate nanoplas-tics-AuNPs@gel. In order to investigate the pH working range, different suspensions of conjugated PS22 model nano-plastics were prepared at different pH and analyzed by SP-ICP-MS. No differences were found from pH 5.0 to pH 8.6, showing that the conjugate was stable in that pH range, whereas a loss on the number of AuNPs@gel at the nanoplas-tics surface was observed at pH > 8.6.
Nanoplastic number concentration: linearity, limit of quantification and precision. Linearity was studied by pre-paring a series of suspensions of PS22 model nanoplastics conjugated with AuNPs@gel at different nanoplastic number concentrations and counting the number of peaks produced by SP-ICP-MS. The number of peaks detected was plotted against the nanoplastic number concentration (Figure 4). The calibration curve showed a good linear relationship from con-centrations of 3.6 x 10⁷ NPTs L-1 up to 3.3 x 10⁸ NPTs L-1 with a slope of 1.19 ± 0.02 x 10⁻⁵ NPTs L-1.
The nanoplastic number concentration limit of quantification (LOQNPT) can be related with the capability of counting 10 peaks generated by nanoplastics conjugated with AuNPs@gel in a situation of two well resolved populations. Under these conditions and by taking into account the slope of the calibra-tion curve obtained in Figure 4, a nanoplastic number concen-tration quantification limit of 8.4 x 10⁵ NPTs L-1 was obtained. On the other hand, the linearity of the calibration is lost for nanoplastic concentration above 3.5-4 x 10⁸ NPTs L-1, as it can be seen in Figure S-3. This is explained by an underestimation on the number of peaks detected due to the counting of peaks generated by two nanoplastic as if they were individual nano-plastics.
The intra-assay precision of the nanoplastic number concentra-tion determinaconcentra-tion was studied by analyzing each point of the calibration curve by triplicate. Relative standard deviations of 1-1.5 % were obtained for those nanoplastic concentrations implying the counting of 1000 or more peaks, whereas a value of 7% was obtained for the lowest concentration, which im-plied counting 400 peaks.
Lower and upper size limits of detection. In order to study the size limits of detections (upper and lower) of the strategy presented in this work, three commercial carboxylated poly-styrene latex particle suspensions (PSL) with different nomi-nal diameters (759, 990 and 3030 nm) were conjugated with AuNPs@gel and analyzed by SP-ICP-MS.
Figure 4. Linear relationship between nanoplastic number concen-tration and number of peaks counted by SP-ICP-MS. Errors bars in red (n = 3).
For the three standards tested, time scans with a significant number of peaks above the background baseline were obtained (Figure S-4). As it was explained before, in order to have an accurate quantification, the signals distribution generated by conjugated nanoplastic must be well resolved from the signal distribution generated by the background.
Well resolved distributions were obtained for the PSL particle suspensions of 759 and 990 nm. As it can be seen in Figure S-4, the intensity of the peaks is increasing when increasing the size of the polymer particles. This is explained by the fact that the bigger the nanoplastic particle, the higher surface area is available for the conjugation with AuNPs@gel, which results in a higher mass of Au per nanoplastic. Under these condi-tions, accurate quantification in terms of the nanoplastic num-ber concentration was obtained for both PSL particle sions (Table 3). The errors were of 1 and 5% for the suspen-sions of 759 and 990 nm, respectively.
However, the number concentration obtained for the PSL particle suspension of 3030 nm was 10 times lower than ex-pected despite the fact that the signal distribution due to con-jugated nanoplastics was well resolved from the distribution due to the background (Table 3). This fact may be explained by an insufficient vaporization and ionization of the nanoplas-tics in the plasma due to their size, resulting in a loss during the SP-ICP-MS analyses.
Table 3. Nanoplastic number concentration, Au mass per nanoplastic and number of AuNPs@gel per nanoplastic obtained by SP-ICP-MS for different carboxylated PS nanoplastics (mean ± standard deviation; n = 3)
Nanoplastic Size, nm Theoretical concen-tration, NPTs L-1 Experimental concentration, NPTs L-1 Average Au mass per NPT, fg Average number of AuNPs@gel per NPT Average num-ber of AuNPs@gel per µm2 PS22 420 ± 20 6.42 x 10⁷ 6.25 ± 0.36 x 10⁷ 14.4 ± 1.4 290 ± 28 523 ± 51 PSL 759 ± 23 6.08 x 10⁷ 6.00 ± 0.35 x 10⁷ 18.2 ± 0.7 365 ± 14 202 ± 8 0 1x10⁸ 2x10⁸ 3x10⁸ 4x10⁸ 0 500 1000 1500 2000 2500 3000 3500 4000 Nu mb e r of p e a k s
PSL 990 ± 20 5.20 x 10⁷ 4.89 ± 0.39 x 10⁷ 23.9 ± 5.1 480 ± 102 156 ± 33
PSL 3030 ± 121 5.18 x 10⁸ 2.81 ± 0.92 x 10⁷ 50.2 ± 4.0 1008 ± 80 35 ± 3
On the other hand, the smallest nanoplastic particle that can be detected and quantified by this strategy will be determined by the surface available for labelling and hence by its diameter and also by its degree of surface functionalization. By assum-ing a fully functionalized nanoplastic, the theoretical limit of detection of the proposed strategy is calculated as 135 nm. This diameter corresponds to a nanoplastic containing the minimum available surface for labeling a number of AuNPs@gel able to produce a signal detectable from the background signal according to equation 2. In any case, these results demonstrated the capability of the labelling strategy to detect and quantify plastics particles up to a size of 1000 nm, covering then the upper size limit for the definition of a nano-plastic proposed by Gigault et al8.
Detection and quantification of nanoplastics in water sam-ples. The feasibility of the proposed strategy was in three different matrices: tap water, river water and a drinking water. For that, a suspension of model PS22 nanoplastics of around 1 x 10 12 NPTs L-1 was prepared in the three matrices listed above, a suspension of AuNPs@gel was spiked and the result-ing mixture of conjugate PS22 nanoplastics- AuNPs@gel diluted and analyzed by SP-ICP-MS.
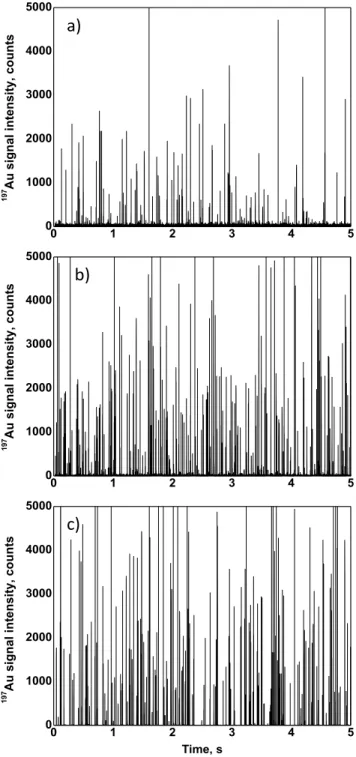
As it is shown in Figure 5, nanoplastics were well detected regardless of the matrix studied. Moreover, the signal due to conjugated nanoplastics could be well discriminated from the background, which lead to accurate quantifications (Table 4), showing that the proposed strategy can be successfully applied in drinking water, tap water and even in river water, where the presence of organic matter and other colloids could modify the behavior and physicochemical properties of nanoplastics, as it was pointed out elsewhere47.
On the other hand, no significant differences were observed on the Au mass per nanoplastics particle obtained when the ex-periments were conducted in tap water and river water (Table 4). In addition, these values were close to those obtained working in ultrapure water (Table 3). However, the Au mass per nanoplastic obtained in drinking water is significant lower (7.4 fg vs 13.1 and 13.2 fg). This may be explained by differ-ences in the quality parameters of the three matrices. For this purpose, pH, conductivity and carbonate content were deter-mined (Table S-1). In comparison with tap water and river water (which was collected from a pristine point), drinking water presented higher carbonate content and conductivity. The latter may have an influence on the labelling strategy by reducing the electrostatic interaction between the negative charge at the surface of nanoplastics, and the positive charge of AuNPs@gel. In any case, the determination of the nano-plastic number concentration was not hampered by a labelling with a lower number of AuNPs@gel.
Table 4. Nanoplastic number concentration obtained by SP-ICP-MS for a model PS nanoplastic suspension in dif-ferent matrices
Water sample Theoretical concentration, NPTs L-1 Experimental concentration, NPTs L-1 Average Au mass per NPT, fg Drinking water 5.46 x 10⁷ 5.74 ± 0.19 x 10⁷ 7.4 ± 0.1 Tap water 2.23 x 10⁸ 2.00 ± 0.07 x 10⁸ 13.1 ± 0.4 River water 2.15 x 10⁸ 2.12 ± 0.07 x 10⁸ 13.2 ± 0.2
However, the developed approach may not be directly applied in more complex matrices presenting negatively charged spe-cies like organic dissolved matter and/or other particles which may compete for the positively charged groups at the surface of the AuNP@gel. In this case, dedicated sample preparations steps, including matrix degradation and nanoplastics isolation must be developed.
Figure 5. Time scans obtained by SP-ICP-MS for a suspension of PS22 model nanoplastics conjugated with AuNPs@gel in differ-ent matrices: a) drinking water, b) tap water, and c) river water.
0 1 2 3 4 5 0 1000 2000 3000 4000 5000 197 A u si g n al in ten si ty, co u n ts
a)
0 1 2 3 4 5 0 1000 2000 3000 4000 5000 197 A u si g n al in ten si ty, co u n tsb)
0 1 2 3 4 5 0 1000 2000 3000 4000 5000 197 A u si g n al in ten si ty, co u n ts Time, sc)
CONCLUSIONS
A novel analytical method for the detection and quantification of nanoplastics in aqueous media was developed. The strategy took advantage of the oxidation signature of ageing plastic debris, mimicked by carboxyl groups present at the surface of nanoplastic particles for their conjugation with functionalized positively charged AuNPs. These results showed that the Au signal generated by the conjugated nanoplastics allowed their counting in a particle-by-particle basis. This work demonstrat-ed the suitability of SP-ICP-MS analysis after metal labelling to detect and determine nanoplastic number concentration of nanoplastics with sizes up to 1 µm in different water samples. While the development of the analytical strategy was based on model studies and applications were demonstrated on synthet-ic samples, the proposed concept has a signifsynthet-icant potential to become the basis of analysis of environmental (e.g., seawater, river water, waste water) samples containing nanoplastics with carbonyl groups due to oxidation processes. However, the study of more complex matrices and real environmental sam-ples should imply additional nanoplastic isolation and/or pre-concentration steps and hence further analytical development. Finally, by assuming a constant density of AuNPs@gel la-belled per nanoplastic, this approach can eventually be applied to measure the surface available area and hence the size of isotropic nanoplastics. For anisotropic nanoplastics, closer to what is expected in real samples, information about available surface could be obtained.
Supporting Information
The Supporting Information is available free of charge on the ACS Publications website.
Supporting Table S1: Quality parameters of the three aqueous matrices studied. Supporting Figures S1-S4, showing the follow-ing: Size distribution obtained by SP-ICP-MS, of the AuNPs@gel used for nanoplastic labelling and UV-Vis spectra of AuNPs@gel suspension; SEM image and size distribution obtained for the 50-nm AuNPs suspension; Loss of linear relationship between nano-plastic number concentration and number of peaks counted by SP-ICP-MS at number concentrations above 3.5 x 10⁸ NPTs L-1; Time scans obtained by SP-ICP-MS after applying the labelling strategy to commercial PSL nanoplastic standards with nominal diameters of: a) 759 nm, b) 990 nm, and c) 3030 nm.
AUTHOR INFORMATION Corresponding Author
* Phone: +33540175037. E-mail: j.jimenez-lamana@univ-pau.fr Author Contributions
The manuscript was written through contributions of all authors. / All authors have given approval to the final version of the manu-script.
ACKNOWLEDGMENTS
Authors thank Josep Sanchís from the Catalan Institute for Water Research (ICRA) in Girona, Catalonia, Spain for collecting the river sample. This research was carried under the framework of E2S UPPA supported by the "Investissements d'Avenir" French programme managed by ANR (ANR-16-IDEX-0002). This re-search was funded by the Aquitaine Region through the project AQUITRACES (n°20131206001-1301097)
REFERENCES
(1) Triebskorn, R.; Braunbeck, T.; Grummt, T.; Hanslik, L.; Huppertsberg, S.; Jekel, M.; Knepper, T. P.; Krais, S.; Müller, Y. K.; Pittroff, M.; Ruhl, A. S.; Schmieg, H.; Schür, C.; Strobel, C.; Wagner, M.; Zumbülte, N.; Köhler, H. R. Relevance of Nano- and Microplastics for Freshwater Ecosystems: A Critical Review. TrAC - Trends Anal. Chem. 2019, 110, 375–392. https://doi.org/10.1016/j.trac.2018.11.023.
(2) Andrady, A. L. Microplastics in the Marine Environment. Mar.
Pollut. Bull. 2011, 62 (8), 1596–1605. https://doi.org/10.1016/j.marpolbul.2011.05.030.
(3) Gigault, J.; Pedrono, B.; Maxit, B.; Ter Halle, A. Marine Plastic Litter: The Unanalyzed Nano-Fraction. Environ. Sci. Nano 2016, 3 (2), 346–350. https://doi.org/10.1039/c6en00008h. (4) Jahnke, A.; Arp, H. P. H.; Escher, B. I.; Gewert, B.; Gorokhova,
E.; Kühnel, D.; Ogonowski, M.; Potthoff, A.; Rummel, C.; Schmitt-Jansen, M.; Toorman, E.; MacLeod, M. Reducing Uncertainty and Confronting Ignorance about the Possible Impacts of Weathering Plastic in the Marine Environment.
Environ. Sci. Technol. Lett. 2017, 4 (3), 85–90. https://doi.org/10.1021/acs.estlett.7b00008.
(5) Silva, A. B.; Bastos, A. S.; Justino, C. I. L.; da Costa, J. P.; Duarte, A. C.; Rocha-Santos, T. A. P. Microplastics in the Environment: Challenges in Analytical Chemistry - A Review.
Anal. Chim. Acta 2018, 1017, 1–19. https://doi.org/10.1016/j.aca.2018.02.043.
(6) Koelmans, A. A. Proxies for Nanoplastic. Nat. Nanotechnol. 2019, 14 (April), 307–308.
(7) Editorial. Nanoplastic Should Be Better Understood. Nat.
Nanotechnol. 2019, 14 (April), 299. https://doi.org/10.1038/s41565-019-0437-7.
(8) Gigault, J.; Halle, A. ter; Baudrimont, M.; Pascal, P. Y.; Gauffre, F.; Phi, T. L.; El Hadri, H.; Grassl, B.; Reynaud, S. Current Opinion: What Is a Nanoplastic? Environ. Pollut. 2018,
235, 1030–1034. https://doi.org/10.1016/j.envpol.2018.01.024.
(9) Besseling, E.; Redondo-Hasselerharm, P.; Foekema, E. M.; Koelmans, A. A. Quantifying Ecological Risks of Aquatic Micro- and Nanoplastic. Crit. Rev. Environ. Sci. Technol. 2019,
49 (1), 32–80. https://doi.org/10.1080/10643389.2018.1531688.
(10) Science Advice for Policy by European Academies (SAPEA). A
Scientific Perspective on Microplastics in Nature and Society | SAPEA; 2019. https://doi.org/10.26356/microplastics.
(11) Peng, L.; Fu, D.; Qi, H.; Lan, C. Q.; Yu, H.; Ge, C. Micro- and Nano-Plastics in Marine Environment: Source, Distribution and Threats — A Review. Sci. Total Environ. 2020, 698, 134254. https://doi.org/10.1016/j.scitotenv.2019.134254.
(12) Ter Halle, A.; Jeanneau, L.; Martignac, M.; Jardé, E.; Pedrono, B.; Brach, L.; Gigault, J. Nanoplastic in the North Atlantic Subtropical Gyre. Environ. Sci. Technol. 2017, 51 (23), 13689– 13697. https://doi.org/10.1021/acs.est.7b03667.
(13) Alexy, P.; Anklam, E.; Emans, T.; Furfari, A.; Galgani, F.; Hanke, G.; Koelmans, A.; Pant, R.; Saveyn, H.; Sokull Kluettgen, B. Managing the Analytical Challenges Related to Micro- and Nanoplastics in the Environment and Food: Filling the Knowledge Gaps. Food Addit. Contam. - Part A Chem.
Anal. Control. Expo. Risk Assess. 2020, 37 (1), 1–10.
https://doi.org/10.1080/19440049.2019.1673905.
(14) Oliveira, M.; Almeida, M. The Why and How of Micro(Nano)Plastic Research. TrAC - Trends Anal. Chem. 2019,
114, 196–201. https://doi.org/10.1016/j.trac.2019.02.023.
(15) Schwaferts, C.; Niessner, R.; Elsner, M.; Ivleva, N. P. Methods for the Analysis of Submicrometer- and Nanoplastic Particles in the Environment. TrAC - Trends Anal. Chem. 2019, 112, 52–65. https://doi.org/10.1016/j.trac.2018.12.014.
(16) Ekvall, M. T.; Lundqvist, M.; Kelpsiene, E.; Šileikis, E.; Gunnarsson, S. B.; Cedervall, T. Nanoplastics Formed during the Mechanical Breakdown of Daily-Use Polystyrene Products.
Nanoscale Adv. 2019, 1 (3), 1055–1061. https://doi.org/10.1039/c8na00210j.
(17) Lambert, S.; Wagner, M. Characterisation of Nanoplastics during the Degradation of Polystyrene. Chemosphere 2016, 145, 265–268. https://doi.org/10.1016/j.chemosphere.2015.11.078. (18) Hernandez, L. M.; Xu, E. G.; Larsson, H. C. E.; Tahara, R.;
Maisuria, V. B.; Tufenkji, N. Plastic Teabags Release Billions of Microparticles and Nanoparticles into Tea. Environ. Sci.
Technol. 2019, 53 (21), 12300–12310. https://doi.org/10.1021/acs.est.9b02540.
(19) Hernandez, L. M.; Yousefi, N.; Tufenkji, N. Are There Nanoplastics in Your Personal Care Products? Environ. Sci.
Technol. Lett. 2017, 4 (7), 280–285. https://doi.org/10.1021/acs.estlett.7b00187.
(20) Chen, Q.; Gundlach, M.; Yang, S.; Jiang, J.; Velki, M.; Yin, D.; Hollert, H. Quantitative Investigation of the Mechanisms of Microplastics and Nanoplastics toward Zebrafish Larvae Locomotor Activity. Sci. Total Environ. 2017, 584–585, 1022– 1031. https://doi.org/10.1016/j.scitotenv.2017.01.156.
(21) Gniadek, M.; Dąbrowska, A. The Marine Nano- and Microplastics Characterisation by SEM-EDX: The Potential of the Method in Comparison with Various Physical and Chemical Approaches. Marine Pollution Bulletin. 2019, pp 210–216. https://doi.org/10.1016/j.marpolbul.2019.07.067.
(22) Brun, N. R.; Beenakker, M. M. T.; Hunting, E. R.; Ebert, D.; Vijver, M. G. Brood Pouch-Mediated Polystyrene Nanoparticle Uptake during Daphnia Magna Embryogenesis. Nanotoxicology 2017, 11 (8), 1059–1069. https://doi.org/10.1080/17435390.2017.1391344.
(23) Rist, S.; Baun, A.; Hartmann, N. B. Ingestion of Micro- and Nanoplastics in Daphnia Magna – Quantification of Body Burdens and Assessment of Feeding Rates and Reproduction.
Environ. Pollut. 2017, 228, 398–407. https://doi.org/10.1016/j.envpol.2017.05.048.
(24) Gigault, J.; El Hadri, H.; Reynaud, S.; Deniau, E.; Grassl, B. Asymmetrical Flow Field Flow Fractionation Methods to Characterize Submicron Particles: Application to Carbon-Based Aggregates and Nanoplastics. Anal. Bioanal. Chem. 2017, 409 (29), 6761–6769. https://doi.org/10.1007/s00216-017-0629-7. (25) Correia, M.; Loeschner, K. Detection of Nanoplastics in Food
by Asymmetric Flow Field-Flow Fractionation Coupled to Multi-Angle Light Scattering: Possibilities, Challenges and Analytical Limitations. Analytical and Bioanalytical Chemistry. 2018, pp 5603–5615. https://doi.org/10.1007/s00216-018-0919-8.
(26) Abdolahpur Monikh, F.; Grundschober, N.; Romeijn, S.; Arenas-Lago, D.; Vijver, M. G.; Jiskoot, W.; Peijnenburg, W. J. G. M. Development of Methods for Extraction and Analytical Characterization of Carbon-Based Nanomaterials (Nanoplastics and Carbon Nanotubes) in Biological and Environmental Matrices by Asymmetrical Flow Field-Flow Fractionation.
Environ. Pollut. 2019, 255, 113304. https://doi.org/10.1016/j.envpol.2019.113304.
(27) da Costa, J. P.; Santos, P. S. M.; Duarte, A. C.; Rocha-Santos, T. (Nano)Plastics in the Environment - Sources, Fates and Effects.
Sci. Total Environ. 2016, 566–567, 15–26. https://doi.org/10.1016/j.scitotenv.2016.05.041.
(28) Mintenig, S. M.; Bäuerlein, P. S.; Koelmans, A. A.; Dekker, S. C.; Van Wezel, A. P. Closing the Gap between Small and Smaller: Towards a Framework to Analyse Nano- and Microplastics in Aqueous Environmental Samples. Environ. Sci.
Nano 2018, 5 (7), 1640–1649. https://doi.org/10.1039/c8en00186c.
(29) Zhou, X. X.; Hao, L. T.; Wang, H. Y. Z.; Li, Y. J.; Liu, J. F. Cloud-Point Extraction Combined with Thermal Degradation for Nanoplastic Analysis Using Pyrolysis Gas Chromatography-Mass Spectrometry. Anal. Chem. 2019, 91 (3), 1785–1790. https://doi.org/10.1021/acs.analchem.8b04729.
(30) Nguyen, B.; Claveau-Mallet, D.; Hernandez, L. M.; Xu, E. G.; Farner, J. M.; Tufenkji, N. Separation and Analysis of Microplastics and Nanoplastics in Complex Environmental Samples. Acc. Chem. Res. 2019, 52 (4), 858–866. https://doi.org/10.1021/acs.accounts.8b00602.
(31) Lin, Y.; Huang, X.; Liu, Q.; Lin, Z.; Jiang, G. Thermal Fragmentation Enhanced Identification and Quantification of Polystyrene Micro/Nanoplastics in Complex Media. Talanta 2020, 208 (October 2019), 120478. https://doi.org/10.1016/j.talanta.2019.120478.
(32) Schirinzi, G. F.; Llorca, M.; Seró, R.; Moyano, E.; Barceló, D.; Abad, E.; Farré, M. Trace Analysis of Polystyrene Microplastics in Natural Waters. Chemosphere 2019, 236.
https://doi.org/10.1016/j.chemosphere.2019.07.052.
(33) Engler, R. E. The Complex Interaction between Marine Debris and Toxic Chemicals in the Ocean. Environ. Sci. Technol. 2012,
46 (22), 12302–12315. https://doi.org/10.1021/es3027105.
(34) Strungaru, S. A.; Jijie, R.; Nicoara, M.; Plavan, G.; Faggio, C. Micro- (Nano) Plastics in Freshwater Ecosystems: Abundance, Toxicological Impact and Quantification Methodology. TrAC -
Trends Anal. Chem. 2019, 110, 116–128. https://doi.org/10.1016/j.trac.2018.10.025.
(35) El Hadri, H.; Gigault, J.; Maxit, B.; Grassl, B.; Reynaud, S. Nanoplastic from Mechanically Degraded Primary and Secondary Microplastics for Environmental Assessments.
NanoImpact 2020, 17, 100206. https://doi.org/10.1016/j.impact.2019.100206.
(36) Laborda, F.; Bolea, E.; Jiménez-Lamana, J. Single Particle Inductively Coupled Plasma Mass Spectrometry: A Powerful Tool for Nanoanalysis. Anal. Chem. 2014, 86 (5), 2270–2278. https://doi.org/10.1021/ac402980q.
(37) Pessoni, L.; Veclin, C.; El Hadri, H.; Cugnet, C.; Davranche, M.; Pierson-Wickmann, A. C.; Gigault, J.; Grassl, B.; Reynaud, S. Soap- and Metal-Free Polystyrene Latex Particles as a Nanoplastic Model. Environ. Sci. Nano 2019, 6 (7), 2253–2258. https://doi.org/10.1039/c9en00384c.
(38) Pace, H. E.; Rogers, N. J.; Jarolimek, C.; Coleman, V. A.; Higgins, C. P.; Ranville, J. F. Determining Transport Efficiency for the Purpose of Counting and Sizing Nanoparticles via Single Particle Inductively Coupled Plasma Mass Spectrometry (Vol 83, Pg 9361, 2011). Anal. Chem. 2011, 83 (10), 9361–9369. https://doi.org/10.1021/ac300942m.
(39) Soulé, S.; Bulteau, A. L.; Faucher, S.; Haye, B.; Aimé, C.; Allouche, J.; Dupin, J. C.; Lespes, G.; Coradin, T.; Martinez, H. Design and Cellular Fate of Bioinspired Au-Ag Nanoshells@Hybrid Silica Nanoparticles. Langmuir 2016, 32
(39), 10073–10082.
https://doi.org/10.1021/acs.langmuir.6b02810.
(40) Amendola, V.; Pilot, R.; Frasconi, M. Surface Plasmon Resonance in Gold Nanoparticles : A Review. J. Phys. Condens.
Matter 2017, 29, 203002.
(41) Torrent, L.; Laborda, F.; Marguí, E.; Hidalgo, M.; Iglesias, M. Combination of Cloud Point Extraction with Single Particle Inductively Coupled Plasma Mass Spectrometry to Characterize Silver Nanoparticles in Soil Leachates. Anal. Bioanal. Chem. 2019, 411 (20), 5317–5329. https://doi.org/10.1007/s00216-019-01914-y.
(42) Liu, J.; Murphy, K. E.; Winchester, M. R.; Hackley, V. A. Overcoming Challenges in Single Particle Inductively Coupled Plasma Mass Spectrometry Measurement of Silver Nanoparticles. Anal. Bioanal. Chem. 2017, 409, 6027–6039. https://doi.org/10.1007/s00216-017-0530-4.
(43) Jiménez-Lamana, J.; Abad-Álvaro, I.; Katarzyna, B.; Laborda, F.; Szpunar, J.; Lobinski, R. Detection and Characterization of Biogenic Selenium Nanoparticles in Selenium-Rich Yeast by Single Particle ICPMS. J. Anal. At. Spectrom. 2018, 33, 452– 460. https://doi.org/10.1039/C7JA00378A.
(44) Kińska, K.; Jiménez-Lamana, J.; Kowalska, J.; Krasnodębska-Ostręga, B.; Szpunar, J. Study of the Uptake and Bioaccumulation of Palladium Nanoparticles by Sinapis Alba Using Single Particle ICP-MS. Sci. Total Environ. 2018, 615, 1078–1085. https://doi.org/10.1016/j.scitotenv.2017.09.203. (45) Laborda, F.; Gimenez-Ingalaturre, A. C.; Bolea, E.; Castillo, J.
R. Single Particle Inductively Coupled Plasma Mass Spectrometry as Screening Tool for Detection of Particles.
Spectrochim. Acta - Part B At. Spectrosc. 2019, 159 (January),
105654. https://doi.org/10.1016/j.sab.2019.105654.
(46) Wojcieszek, J.; Jimenez-Lamana, J.; Bierla, K.; Asztemborska, M.; Ruzik, L.; Jarosz, M.; Szpunar, J. Elucidation of the Fate of Zinc in Model Plants Using Single Particle ICP-MS and ESI Tandem MS. J. Anal. At. Spectrom. 2019, 34, 683–693. https://doi.org/10.1039/C8JA00390D.
(47) Oriekhova, O.; Stoll, S. Heteroaggregation of Nanoplastic Particles in the Presence of Inorganic Colloids and Natural Organic Matter. Environ. Sci. Nano 2018, 5 (3), 792–799. https://doi.org/10.1039/c7en01119a.
10
“For Table of Contents Only”+
Positively charged AuNPs Carboxilated nanoplastics Conjugated AuNPs-NPTs Single Particle ICP-MS 0 1000 2000 3000 4000 5000 6000 0 10 20 30 40 50 60 140 Ce s igna l / cps Time / sec A u S ig nalDetection and accurate quantification
5 10 15 20 25 30 0 50 100 150 1400 1600 F re q u e n c y