HAL Id: hal-00461615
https://hal.archives-ouvertes.fr/hal-00461615
Submitted on 5 Mar 2010
HAL is a multi-disciplinary open access
archive for the deposit and dissemination of
sci-entific research documents, whether they are
pub-lished or not. The documents may come from
teaching and research institutions in France or
abroad, or from public or private research centers.
L’archive ouverte pluridisciplinaire HAL, est
destinée au dépôt et à la diffusion de documents
scientifiques de niveau recherche, publiés ou non,
émanant des établissements d’enseignement et de
recherche français ou étrangers, des laboratoires
publics ou privés.
Estimation of latency on production grid over several
weeks
Diane Lingrand, Johan Montagnat, Tristan Glatard
To cite this version:
Diane Lingrand, Johan Montagnat, Tristan Glatard. Estimation of latency on production grid over
several weeks. ICT4Health, Feb 2008, Manila, Philippines. pp.4. �hal-00461615�
Estimation of latency on production grid over several
weeks
Diane Lingrand
1, Johan Montagnat
1and Tristan Glatard
1,2 1RAINBOW team - I3S UMR 6070 - Univ. Nice - Sophia Antipolis / CNRS B.P. 145 - F 06903 Sophia Antipolis Cedex - France
2
University of Amsterdam - Institute of Informatics/Academic Medical Center
[email protected]
ABSTRACT
Previous works have presented a probabilistic model of the latency of the grid depending on parameters characterizing the workload. In this paper, we study both the validity of parameters along several weeks and the influence of the day of the week. We show that performance can be improved by the actualization of model parameters.
Keywords
grid computing, model, context
1.
INTRODUCTION
Grids are powerful tools for large scale studies on medical data and specifically on medical images. However, the be-havior of grids is highly variable and they are subject to faults. We thus need to model the grid in order to improve job submissions and estimation of performance.
Our approach consists in probabilistic modeling using ex-ecution context parameters. Preliminary works [2, 7] have shown the validity of the model. However these studies have been made on a very short period of time thus hiding the temporal variability of workload conditions. In this paper, we enlarge our study along several weeks in order to study the model temporal validity.
2.
RELATED WORKS
Several initiatives aim at modeling grid infrastructure Work-load Management Systems (WMS). In [5], correlations be-tween job execution properties (job size or number of proces-sors requested, job run time and memory used) are studied on a multi-cluster supercomputer in order to build models of workloads, enabling comparative study on system design and scheduling strategies. In [9], authors make predictions of batch queue waiting time which improves the total exe-cution time.
Taking into account contextual information has been
re-ported to help in estimating single jobs and workflows exe-cution time by rescheduling. Feitelson [1] has observed cor-relations between run time and job size, number of cluster and time of the day. In [8], the influence of changes in trans-mission speed, in both executable code and data size, and in failure likelihood are analysed for a better estimation of end time of sub-workflows. This is used for re-scheduling jobs after fault or overrun.
Authors of [10] analyze job inter-arrival times, waiting times at the queues, execution times and data exchange sizes. They conducted experiments on the EGEE grid on several VOs (Virtual Organizations) and studied the influence of the day of the week and the time of the day. Their conclusion on these influences is that there is an increase of the load at the end of the day but that it is difficult to extract a precise model of the behavior with respect of the day or the time. To refine grid monitoring, [11] presents a model of the influ-ence between the grid components and their execution con-text (system and network levels), experimented on Grid’5000. In previous work, we have shown that some of the param-eters of the execution context have an influence on the ex-pectation of job execution time [2, 7]. In this work, we focus on the validity of our parameters along several weeks and we refine the study on the day of the week.
3.
EXPERIMENTAL PLATFORM
Our experiments are based on biomed VO of the EGEE pro-duction grid infrastructure. With 40000 CPUs dispatched world-wide in more than 240 computing centers, EGEE rep-resents an interesting case study as it exhibits highly variable and quickly evolving load patterns that depend on the con-current activity of thousands of potential users. Even if the infrastructure is relatively homogeneous from the OS point of view (Scientific Linux), important architecture and per-formance variations are expected among the worker nodes (64/32 bit machines, multi/single processor).
For the following discussion, the main components of the batch-oriented EGEE grid infrastructure are introduced. When a user wants to submit a job from her workstation, she con-nects to an EGEE client known as a User Interface. A Re-source Broker (RB) queues the user requests and dispatches them to the different computing centers available. The gate-way to each computing center is one or more Computing Element (CE). A CE hosts a batch manager that will
dis-tribute the workload over the center Worker Nodes, using different batch queues. Different queues handle jobs with different wall clock times. However the policies for deciding of the number of queues and the maximal time assigned to each of them are site-specific.
During its life-cycle, a job is characterized by its evolving status. If everything happened as expected, the job is then completed. Otherwise, it is aborted, timed-out or in an error status depending on the type of failure.
4.
MODEL OF THE LATENCY
Models of the grid latency enable the optimization of job submission parameters such as jobs granularity or the time-out value needed to make the WMS robust against system faults and outliers. Properly modeling a large scale infras-tructure is a challenging problem given its heterogeneity and its dynamic behavior. In a previous work, we adopted a probabilistic approach [3] which proved to improve applica-tion performances while decreasing the load applied on the grid middleware by optimizing jobs granularities. Similar probabilistic models have been proposed to estimate time-outs in other complex systems [12, 6].
In [4], we have shown how the distribution of the grid la-tency impacts the choice of a timeout value for the jobs. We model the grid latency as a random variable R with probability density function (pdf) fR and cumulative
den-sity function (cdf) FR. The optimal timeout value can be
obtained by minimizing the expectation of the job execu-tion time J which can be expressed as a funcexecu-tion of R, the timeout t∞and the proportion of outliers ρ:
EJ(t∞) = 1 FR(t∞) Z t∞ 0 ufR(u)du + t∞ (1 − ρ)FR(t∞) − t∞ (1) Experimental measures show high variability in the latency. In this paper, we present two different studies aiming at re-ducing this variability and improving job execution on pro-duction grids. First, we study the evolution of the optimal timeout and the expectation of the job execution time over several weeks. Second, we focus on a particular parameter of the execution context, the day of the week, and discuss its relevance regarding different weeks.
5.
EXPERIMENTAL DATA
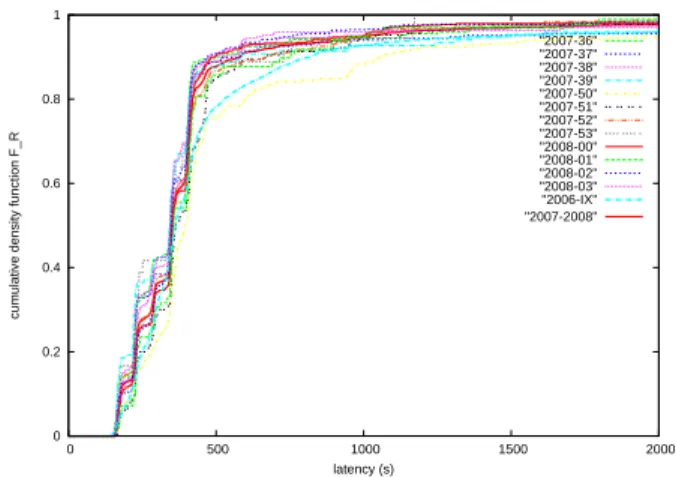
To study grid latency, measures were collected by submitting a very large number of probe jobs. These jobs, consisting in the execution of an almost null duration /bin/hostname command, are only impacted by the grid latency. In the remainder we make the hypothesis that the users job execu-tion time is known and that therefore only the grid latency varies significantly between different runs of the same com-putation task. To avoid variations of the system load, a constant number of probes was executing inside the system at any time of the data collection: a new probe was submit-ted each time another one complesubmit-ted. For each probe job, we logged the job submission date, the job status and the total duration. The probe jobs were assigned a fixed 10000 seconds timeout beyond which they were considered as out-liers and canceled. This value is far greater than the average latency observed. 0 0.2 0.4 0.6 0.8 1 0 500 1000 1500 2000
cumulative density function F_R
latency (s) "2007-2008" "2007-36" "2007-37" "2007-38" "2007-39" "2007-50" "2007-51" "2007-52" "2007-53" "2008-00" "2008-01" "2008-02" "2008-03" "2006-IX"
Figure 1: Cumulative density function of the latency for each week, computed on completed jobs.
For the previous work [2], we collected a log gathering 5800 job traces in September 2006 (denoted further as 2006-IX). In this paper, we added 5093 job traces acquired from week 36 to week 39 of 2007 and week 50 of 2007 to week 03 of 2008. The discontinuity of the periods in the new data set is due to our local network failures and does not have any relations with authors choices.
6.
ALONG THE WEEKS
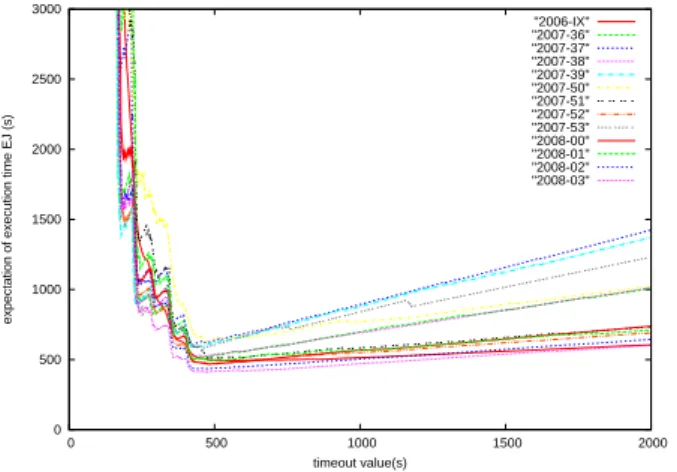
Figure 1 presents the cumulative density function of the la-tency for the different weeks and for the whole period of 2007-2008. The curves concerning the period 2007-2008 presents a similar profile with steps coming from he waiting time of the jobs in the resource brokers (RB). One of the hy-pothesis is that they could be due to the internal scheduling algorithm of resource broker. Another possible cause might be implementation flaws in the RB code. Those steps have also been observed in the vlemed VO of the EGEE grid. However, an interesting way to compare those curves is to consider the differences between the optimal timeout val-ues that they lead to (computed using equation 1). Figure 2 shows the expectation of execution time for the different weeks. Despite the fact that the different curves present dif-ferent profiles, the optimal timeout values are visually in the same interval around 400s. These values are more precisely detailed in table 1: the optimal value for 2006 is 528s while values for 2007-2008 are between 422s and 491s. The table presents also, for each period of time, the mean value and the standard deviation of the latency R. In most cases, the reduction of time conducts to a reduction of the standard deviation. Finally the optimal expected execution time is shown. Assuming that the optimal timeout value has been computed in September 2006 (528s), we compute, in table 2, the resulting expectation of execution time and the relative difference with the optimal value computed week by week in order to measure the impact of parameters chosen earlier instead of the optimal one. The relative differences are up to 8%. It happens that this timeout value is greater than all optimal values for the period 2007-2008. The highest dif-ferences are obtained when the ascending slope of figure 2 are the highest, which is directly related to the fraction of outliers.
0 500 1000 1500 2000 2500 3000 0 500 1000 1500 2000
expectation of execution time EJ (s)
timeout value(s) "2006-IX" "2007-36" "2007-37" "2007-38" "2007-39" "2007-50" "2007-51" "2007-52" "2007-53" "2008-00" "2008-01" "2008-02" "2008-03"
Figure 2: Expectation of job execution time with respect to the timeout value (t∞). The minimum of
each curve gives the best timeout value.
date R¯ σ(R) outliers best t∞ EJ(t∞)
2006-IX 570s 886s 5% 528s 494s 2007/08 469s 723s 17% 474s 500s 2007-36 446s 748s 24% 423s 502s 2007-37 506s 848s 33% 422s 606s 2007-38 447s 682s 24% 428s 522s 2007-39 489s 741s 32% 436s 585s 2007-50 660s 1046s 18% 467s 628s 2007-51 478s 510s 13% 491s 510s 2007-52 443s 582s 13% 482s 469s 2007-53 375s 238s 31% 432s 581s 2008-00 454s 699s 14% 484s 468s 2008-01 434s 317s 13% 485s 491s 2008-02 418s 547s 12% 433s 435s 2008-03 538s 1196s 10% 474s 413s
Table 1: Mean and standard variation of the latency, fraction of outliers, best timeout value and minimal expectation of execution time. These quantities are computed for the 2006 period, for the 2007-2008 pe-riod and for all weeks int the 2007-2008 pepe-riod.
date EJ(528s) ∆EJ date EJ(528s) ∆EJ
2007-36 528s 5.2 % 2007-52 477s 1.7 % 2007-37 648s 7.0 % 2007-53 623s 7.1 % 2007-38 544s 4.2 % 2008-00 475s 1.5 % 2007-39 631s 7.9 % 2008-01 493s 0.4 % 2007-50 652s 3.9 % 2008-02 441s 1.4 % 2007-51 514s 0.9 % 2008-03 418s 1.2 %
Table 2: In this experiment, the timeout value from the period of September 2006 has been used (528s). For each week of the 2007-2008 period, we present the expectation of execution time and the relative difference with the optimal one.
date EJ(422s) ∆EJ% EJ(491s) ∆EJ%
2007-36 505.5 0.7% 527.1 5.0% 2007-37 605.9 0% 632.2 4.3% 2007-38 524.8 0.5% 530.5 1.6% 2007-39 602.9 3.1% 616.8 5.5% 2007-50 718.7 14.5% 642.3 2.3% 2007-51 594.9 16.7% 509.6 0% 2007-52 491.2 4.8% 470.9 0.4% 2007-53 593.7 2.1% 600.0 3.2% 2008-00 501.9 7.2% 470.0 0.4% 2008-01 516.7 5.2% 493.1 0.4% 2008-02 437.0 0.6% 437.2 0.6% 2008-03 419.1 1.5% 414.8 0.5%
Table 3: In this experiment, we focus on data from the period 2007-2008. As determined in table 1, the minimum timeout value is 422s and the maximum is 491s. For these extreme values, the new expectation of execution time and the relative difference with the optimal value are presented.
Figure 3: For each day of the week and for each week, the best timeout value is computed. We have plotted boxes for each day of the week. According to ANOVA, there is no significant difference between the days of the week.
Furthermore, we took the minimal and the maximal of time-out values among the different weeks : 422s and 491s. We present the expected execution time for each of these values and the relative differences in table 3. In the case of the maximal timeout value, relative errors are below 6% while in the case of the minimal timeout value, relative errors are up to 17%. This is clearly explained by the shape of the curves on figure 2: the slope of the decreasing part is higher than the slope of the increasing part of each curve. Thus, an overestimation of the timeout value is better than an un-derestimation, if this overestimation is not too high, which must be quantified. As a conclusion of this part of the study, actualization of the timeout value may improve the total ex-ecution time, up to 17%.
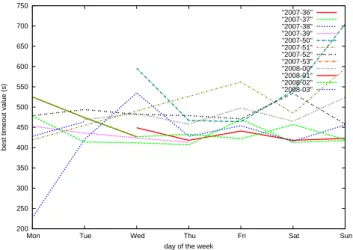
200 250 300 350 400 450 500 550 600 650 700 750
Mon Tue Wed Thu Fri Sat Sun
best timeout value (s)
day of the week
"2007-36" "2007-37" "2007-38" "2007-39" "2007-50" "2007-51" "2007-52" "2007-53" "2008-00" "2008-01" "2008-02" "2008-03"
Figure 4: Each curve corresponds to a week of the experiment. The optimal timeout value is plotted with respect to the day of the week.
In this second experiment, we study the influence of the day of the week on the best timeout value: for each week and each day of the week, we compute the best timeout value. These values are plotted on figure 3 with respect to the day of the week. As confirmed by ANOVA analysis, there is no significant difference between the days of the week. However, in figure 4, we observe that, in most weeks, there is a decrease of best timeout value between Tuesday or Wednes-day and ThursWednes-day followed by an increase until FriWednes-day or Saturday. This profile information thus needs further inves-tigation to be exploited.
8.
CONCLUSION
The experiment on the influence of the day of the week shows that it has a hardly relevant impact. The hour of the day could be considered alternatively.
This study shows that variations of the load conditions over long periods of time make it necessarily to update the model parameters along time.
Future work will focus on strategies to perform this update. Moreover, other parameters of the execution context such as the grid resources need to be studied over long period of time.
9.
ACKNOWLEDGMENTS
This work is partially funded by the French national research agency (ANR), NeuroLog project1
under contract number ANR-06-TLOG-024. This project is in the scope of scien-tific topics of the STIC-ASIA OnCoMedia project2
. We are grateful to the EGEE European project for providing the grid infrastructure and user assistance.
10.
REFERENCES
1
Neurolog: http://neurolog.polytech.unice.fr
2
OnCoMedia: http://www.onco-media.com
[1] D. Feitelson. Workload modeling for performance evaluation, pages 114–141. Springer-Verlag - LNCS vol 2459, Sept. 2002.
[2] T. Glatard, D. Lingrand, J. Montagnat, and M. Riveill. Impact of the execution context on Grid job performances. In International Workshop on Context-Awareness and Mobility in Grid Computing (WCAMG’07), pages 713–718, Rio de Janeiro, May 2007. IEEE.
[3] T. Glatard, J. Montagnat, and X. Pennec. Probabilistic and dynamic optimization of job partitioning on a grid infrastructure. In 14th euromicro conference on Parallel, Distributed and network-based Processing (PDP06), pages 231–238, Montb´eliard-Sochaux, France, Feb. 2006.
[4] T. Glatard, J. Montagnat, and X. Pennec. Optimizing jobs timeouts on clusters and production grids. In International Symposium on Cluster Computing and the Grid (CCGrid’07), pages 100–107, Rio de Janeiro, May 2007. IEEE.
[5] H. Li, D. Groep, and L. Walters. Workload
Characteristics of a Multi-cluster Supercomputer. In Job Scheduling Strategies for Parallel Processing, pages 176–193. Springer Verlag, 2004.
[6] L. Libman and A. Orda. Optimal Retrial and Timeout Strategies for Accessing Network Resources.
IEEE/ACM Transactions on Networking (TN), 10(4):551–564, Aug. 2002.
[7] D. Lingrand, J. Montagnat, and T. Glatard. Estimating the execution context for refining submission strategies on production grids. In Assessing Models of Networks and Distributed Computing Platforms (ASSESS) (CCgrid’08), Lyon, May 2008. IEEE.
[8] J. Nichols, H. Demirkan, and M. Goul. Autonomic Workflow Execution in the Grid. IEEE Transactions on Systems, Man, and Cybernetics, 36(3), May 2006. [9] D. Nurmi, A. Mandal, J. Brevik, C. Koelbel,
R. Wolski, and K. Kennedy. Evaluation of a Workflow Scheduler Using Integrated Performance Modelling and Batch Queue Wait Time Prediction. In Conference on High Performance Networking and Computing, Tampa, Florida, Nov. 2006. ACM Press. [10] M. Oikonomakos, K. Christodoulopoulos, and
E. Varvarigos. Profiling Computation Jobs in Grid Systems. In IEEE International Symposium on Cluster Computing and the Grid (CCGrid07), pages 197–204, Rio de Janeiro, Brasil, May 2007.
[11] S. Ravelomanana, S. C. S. Bianchi, C. Joumaa, and M. Sibilla. A Contextual GRID Monitoring by a Model Driven Approach. In Proceedings of the Advanced International Conference on Telecommuni cations and International Conference on Internet and Web Applications and Servic (AICT/ICIW), pages 37–43, Gosier, Guadeloupe, Feb. 2006. IEEE. [12] A. van Moorsel and K. Wolter. Analysis of Restart
Mechanisms in Software Systems. IEEE Transactions on Software Engineering (TSE), 32(8):547–558, Aug. 2006.