HAL Id: hal-01111629
https://hal.archives-ouvertes.fr/hal-01111629
Submitted on 11 Dec 2020
HAL is a multi-disciplinary open access
archive for the deposit and dissemination of
sci-entific research documents, whether they are
pub-lished or not. The documents may come from
teaching and research institutions in France or
abroad, or from public or private research centers.
L’archive ouverte pluridisciplinaire HAL, est
destinée au dépôt et à la diffusion de documents
scientifiques de niveau recherche, publiés ou non,
émanant des établissements d’enseignement et de
recherche français ou étrangers, des laboratoires
publics ou privés.
Observation of highly disparate K-shell x-ray spectra
produced by charge exchange with bare mid-Z ions
Gabriele L. Betancourt-Martinez, Peter Beiersdorfer, Gregory V. Brown,
Richard L. Kelley, Caroline A. Kilbourne, Dimitra Koutroumpa, Maurice A.
Leutenegger, F. Scott Porter
To cite this version:
Gabriele L. Betancourt-Martinez, Peter Beiersdorfer, Gregory V. Brown, Richard L. Kelley, Caroline
A. Kilbourne, et al.. Observation of highly disparate K-shell x-ray spectra produced by charge
ex-change with bare mid-Z ions. Physical Review A, American Physical Society, 2014, 90 (5), pp.052723.
�10.1103/PhysRevA.90.052723�. �hal-01111629�
with bare mid-Z ions
Gabriele L. Betancourt-Martinez,1, 2 Peter Beiersdorfer,3Gregory V. Brown,3 Richard L. Kelley,2
Caroline A. Kilbourne,2 Dimitra Koutroumpa,4 Maurice A. Leutenegger,2, 5 and F. Scott Porter2
1CRESST and University of Maryland, College Park, MD 2NASA Goddard Space Flight Center, Greenbelt, MD 3Lawrence Livermore National Laboratory, Livermore, CA
4LATMOS-IPSL/CNRS, Guyancourt, France 5CRESST and University of Maryland Baltimore County
We performed charge exchange experiments with the electron beam ion trap at the Lawrence Livermore National Laboratory and an x-ray calorimeter spectrometer. We compare the relative strength of the high-n Lyman series emission for different combinations of ions and neutral gases. Theoretical predictions show good agreement with experimental data on relative capture cross sec-tion as a funcsec-tion of principle quantum number n; however, the few published predicsec-tions of the distribution of captures as a function of orbital angular momentum l do not agree with experiments. Our experimental results show that the relative strength of high-n Lyman series emission varies more widely than previous experiments have found and models predict. We find that hardness ratios from charge exchange with helium and molecular hydrogen are more disparate than charge exchange with many-electron neutral species, which is likely due to differences in the relative im-portance of multi-electron capture. We also find that there is no clear scaling of the hardness ratio with ionization potential of the neutral species, the number of valence electrons in the neutral, or the atomic number of the ion.
PACS numbers: 34.70.+e, 32.30.Rj, 95.30.Ky, 52.72.+v
I. INTRODUCTION
Charge exchange (CX), or charge transfer, is a semi-resonant process in which a highly charged ion captures one or more electrons from a neutral atom or molecule during a close interaction. Charge exchange is impor-tant in setting the ionization balance in laboratory and astrophysical plasmas, as a spectral diagnostic for fusion plasmas, in determining the storage time in ion traps and storage rings, and in antihydrogen production [1–15]. Astrophysically, charge exchange occurs in planetary at-mospheres and the comae of comets interacting with the solar wind, and has been hypothesized to occur at the rim of supernova remnants [16, 17]. Charge exchange also occurs between solar wind ions and neutrals in the exosphere and in the heliosphere, which adds variable foreground emission for every astrophysical observation from our solar system [18–26]. Astro-H, a JAXA satel-lite observatory scheduled for launch in 2015, features an x-ray calorimeter imaging spectrometer that will mea-sure the first high-resolution x-ray spectra of extended objects. Correct interpretation of these observations will require accurate modeling of foreground CX.
In order to model CX spectra, we must know the n- and l-selective electron capture cross section. Classical treat-ment predicts a sharp peak in the n capture distribution at nc∼q3/4
q
IH
In, where IH and Inare the ionization
po-tentials of hydrogen and the neutral target, respectively, and q is the ion charge [27]. The n-distribution is gener-ally well-understood, and many papers show good agree-ment between theory and experiagree-ment for n-selective
cap-ture cross sections, as in Mawhorter et al. [10], Otranto and Olson [28], Igenbergs et al. [29] and Wu et al. [30].
The l distribution, which is dependent on collision en-ergy, is more challenging to model correctly. One can use classical considerations to determine the electron capture state: in high-energy collisions, in the limit of strong Stark mixing, l states are assumed to be populated sta-tistically, and high l states dominate [27]. In low-energy collisions, the electron does not have enough angular mo-mentum to populate the higher l states, and statistical assumptions do not apply. This was verified in, for ex-ample, Beiersdorfer et al. [31].
The Lyman series x-ray emission is a powerful diagnos-tic for determining the state-selective capture cross sec-tion, σnl, in bare ions undergoing charge exchange with
a neutral gas. Electron capture into an l = 1 state is dominated by direct decay from nc, l = 1 to the ground
state [32], emitting a ncp →1s Ly series photon. If the
electron is captured into a high angular momentum state, it will decay along the Yrast chain in steps of ∆n = −1 and ∆l = −1, finally yielding a 2p → 1s Ly-α photon. Therefore, if the electrons are captured following a statis-tical cross section, the strongest line in the spectrum will be Ly-α; if the electron capture cross section is largest for an np state, the ncp →1s Ly lines will dominate.
The hardness ratio, H, is the ratio of the ncp →1s to
2p → 1s emission, where n is greater than two, i.e.,
H= P∞
n=3Fn→1
F2→1
(1) where F represents the flux in the denoted transition lines. The hardness ratio is expected to decrease with
2 increasing collision energy, since as collision energy
in-creases, so does the cross section for capture into higher angular momentum states, producing more Ly-α pho-tons. The hardness ratio can therefore be used as a probe of the collision velocity, allowing us to measure, for ex-ample, the velocity of the solar wind. An added benefit of the hardness ratio is that, in principle, it can be deter-mined even with medium-resolution detectors that may not be able to resolve individual high-n Lyman lines, such as CCDs or high purity germanium solid state detectors that typically have resolutions on the order of ∼100 eV at 1.5 keV.
Besides the classical over-the-barrier (COB) method [33, 34], several other more complex charge exchange models exist which can be used to estimate total or state-selective cross sections. These include the Landau-Zener (LZ) method [35], the multichannel Landau-Landau-Zener (MCLZ) approximation [36], the atomic-orbital close-coupling (AOCC) method, and the molecular-orbital close-coupling (MOCC) method [37, 38]. The classical trajectory Monte Carlo (CTMC) method [39, 40] is the most widely used approximation, due to its simplicity and its accuracy, compared to other models, in predicting experimentally-measured n-state selective cross sections. COB and CTMC models agree qualitatively with ex-periments that show a decrease in hardness ratios with increasing collision velocity [41]. Both models also agree qualitatively with experiments that show an increase in capture cross section with increasing ion charge, but have systematic uncertainties of ∼ 25 − 50% when predicting absolute cross sections [9, 10, 42]. CTMC shows bet-ter agreement with experiments at high collision energies (above ∼1 keV amu−1), as demonstrated in comparison
with experimental results from fusion plasmas excited with a very energetic hydrogen or deuterium beam [14]. However, discrepancies between models and experiments arise at the edge of tokamaks, where cold ions interact with molecular gas, in electron beam ion traps (EBITs), where the collision velocity is ∼10 eV amu−1, and also
in space, where cometary, exospheric, and heliospheric neutrals interact with low energy solar wind ions.
The COB and LZ methods do not make predictions for l-selective capture cross section, and to the extent that there are measurements of l-selective capture cross section at low collision energies, especially over a range of conditions and interacting species other than atomic hydrogen, theoretical calculations that can incorporate l, such as CTMC and AOCC/MOCC, show poor agree-ment with experiagree-ments [30, 31, 43–45]. Furthermore, the commonly used CTMC method cannot incorporate multi-electron capture (MEC), which becomes important in the low-energy regime [41, 46].
Several comparisons between theory and experiment have been made, with varying results. Otranto et al. [41] demonstrated that while CTMC calculations qual-itatively agree with EBIT experiments where nc
de-creases for increasing ionization potential, their CTMC model overestimates the flux in high-n Rydberg
transi-tions following CX onto O8+. Beiersdorfer et al. [31]
per-formed experiments with EBIT-I showing that, contrary to CTMC calculations, the hardness ratio following CX with bare Ne, Ar, Kr and Xe was always nearly unity. Further, the disagreement between calculated and mea-sured hardness ratios worsened at higher atomic num-bers. Otranto et al. [47] presented EBIT results involv-ing O8+ demonstrating that the hardness ratio can vary
within nearly a factor of two by varying the neutral gas. Leutenegger et al. [43] presented EBIT spectra of bare Ar and P that concurrently underwent CX with the same neutral gas, and contrary to the trend established in [31] and also to previous CTMC calculations, the hardness ratios measured for Ar and P differed by a factor of two. In this paper, we present experiments that investigate the dependence of CX line emission on the ionization po-tential of the neutral gas, the number of valence electrons in the neutral gas, and the atomic number of the ion. We probe whether any of these characteristics are predictive of CX spectral features, and provide empirical data to-wards more comprehensive and quantitatively accurate models.
II. EXPERIMENTAL METHOD
The measurements presented here were performed with the EBIT-I electron beam ion trap at the Lawrence Livermore National Laboratory [48, 49]. The spectra were measured using the EBIT calorimeter spectrometer (ECS) [50, 51]. The ECS is a non-dispersive spectrom-eter developed at NASA/Goddard Space Flight Center with quantum efficiency of nearly unity over a large band-width. The 30-pixel array of silicon-doped thermistors is divided into a mid- and a high-energy array of 16 and 14 pixels, respectively, which together have a dynamic range of 0.05–100 keV. The experiments discussed here made use of the mid-band array, which has an energy resolution of ∼4.5 eV at 6 keV.
The ECS has four internal aluminized polyimide filters used to block optical and thermal radiation at tempera-ture stages of 77 K, 4 K, 300 mK, 50 mK, with a total aluminum thickness of 1460 ˚A and total polyimide thick-ness of 2380 ˚A. In addition, we used a 500 ˚A polyimide window outside the ECS dewar to isolate the ECS vac-uum from the EBIT vacvac-uum. These thicknesses have been experimentally verified to an accuracy of ∼10%.
Fundamentally, the EBIT operates in one of two modes: electron trapping mode and magnetic trapping mode. In electron trapping mode, after neutral species are injected into the ion trap, they are collisionally ion-ized by the electron beam, then confined in the trap. The ions are radially confined due to the electrostatic at-traction of the electron beam, and axially confined by a voltage potential applied across three copper drift tubes. Typical thermal energies of trapped ions are ∼10 eV amu−1 at typical beam currents of ≥ 130 mA and trap
the trap are ∼ 3 × 109cm−3.
For a charge exchange experiment in the EBIT-I, first, ions are created during electron trapping mode, with the electron beam turned on for typically about 0.5 seconds to generate a sufficient number of bare ions of mid-Z elements. Next, in magnetic trapping mode [53], the electron beam is turned off and the ions are radially trapped by the 3 T magnetic field of the superconducting Helmholtz coils and the electric field of the drift tubes, so that the EBIT is effectively a Penning trap. The ions gain electrons and emit X-rays through CX with the neu-tral species introduced into the trap. Since the beam is off, no excitations due to electron impact occur. Filling the K shell of most of the trapped bare ions takes about 0.5 seconds. After this occurs, the trap is dumped and the cycle is repeated. It typically requires several hours to accumulate sufficient statistics for each experiment.
We performed charge exchange experiments for the fol-lowing ions and neutral gases: Mg12++CO
2, Mg12++H2,
Mg12++He, Mg12++Ne, Cl17++C
2H4Cl2, Cl17++He,
Ar18++Ar, S16++He, and S16++SF
6. In the Mg
ex-periments, there were contaminant ions present in the trap, including P, S, Si and Ar, which entered from a port on EBIT that was open in order to perform crys-tal spectrometer measurements. We did not observe any significant effect from these contaminants in the spectra, other than the presence of their K shell emission lines. The charge exchange cross section for ion-ion interac-tions is negligible. We verified that the x-rays recorded were nearly all from interactions of trapped ions with the chosen neutral gas, and not with background gases in the trap, by reducing the neutral CX partner gas injec-tion pressure to zero while holding all other experimental parameters constant. From contemporaneous measure-ments, we estimate that the background CX rate for the Mg experiments was about 10% of the experimental CX rate; for all other experiments the background rate is on the order of 1%.
III. ANALYSIS AND SPECTRA
We fit Lyman series lines from H-like ions, assuming a Gaussian instrumental function [54]. We used reference energies calculated with the Flexible Atomic Code (FAC) [55]. We accounted for partial line blending where two transitions from different ions could be disentangled due to differing energy centroids. In a few cases, however, ion line flux could not be separated from other lines due to contaminants with transitions that overlapped with the lines of interest: for example, Mg11+ Ly-γ is nearly
coincident with the strong Si12+ 1s2s 3S
1 → 1s2 1S0
transition. In order to account for this in our hardness ratios, we determined a lower limit assuming zero flux in Ly-γ, which appears in the text of table I and figures 4 and 5, and an upper limit by including the entire blended line, mentioned in the caption of table I. In the absence of independent measurements of the Si lines, we assert that
the lower limit is the more realistic one; the Si forbidden line in CX is more likely to be stronger than the Mg11+
Ly-γ line.
We corrected the observed flux for attenuation from the optical and thermal blocking filters as well as frozen contaminants on the filters, which we believe is either or both of water ice or nitrogen gas frozen on the 77 K fil-ter, or nitrogen gas frozen on the 4 K filter. Since the photoelectric absorption cross section scales very nearly as E−3, either substance would produce the same
trans-mission curve at energies above the oxygen K threshold, assuming a given optical depth at a given energy. There-fore, we make a fiducial assumption that the contaminant is water ice. We determine the thickness of water ice us-ing the decrement in the ratio of the O Ly-α to Ly-β line strengths in electron impact excitation experiments com-pared to the measured ratio of 6.25 in the limit of high incident electron beam energy [56]. The oxygen measure-ments were taken regularly during the experimeasure-ments. The inferred fiducial ice layer thickness was typically ∼1 µm, which corresponds to a line flux correction of ∼10–20% in the Mg Ly band from 1300–1900 eV, and ∼1% for the S, Cl, and Ar experiments with line energies above ∼2400 eV. This corresponds to a maximum effect on the ratio of Ly-n:Ly-α of ∼10% for the Mg experiments and ∼1% for the S, Cl, and Ar experiments.
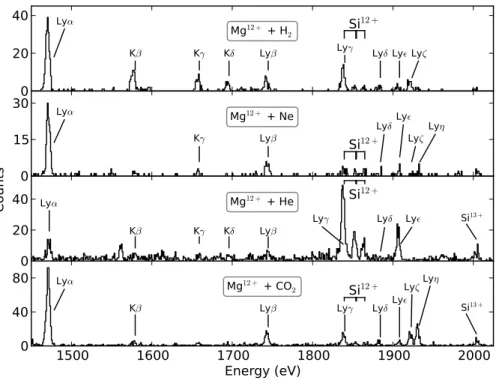
Selected spectra are presented in figures 1–3. Lyman lines refer to the hydrogen-like ion emission; “K” lines refer to He-like ion emission. K lines can be used for various diagnostics, but in this paper we focus on the Lyman emission. Hardness ratios and other diagnostic ratios for all experiments are summarized in table I and II in the appendix. Individual line fluxes are also presented in the appendix.
IV. DISCUSSION
The hardness ratios determined for the experiments presented here span a larger range than previous experi-ments have shown, and can deviate widely from CTMC calculations, as can be seen in figure 4. In earlier CX experiments using trapped ions, the hardness ratio mea-sured at low collision velocity was often ∼1 [31, 41, 57– 60]. All experiments in this work were performed at sim-ilar collision energies of <∼ 25 eV amu−1 [56], but the
hardness ratios vary between ∼0.5 to ∼2.6. This demon-strates that the contribution from the np capture cross section, as normalized to the total capture cross section, occupies a broader range than previously supposed; the initially surprising variation in H between bare Ar and P as shown in [43] seems to be less of an anomaly than formerly thought.
One might expect to see H scale with the atomic num-ber of the ion (as CTMC calculations in [31, 32] show), the number of valence electrons in the neutral, or the ionization potential of the neutral. For example, Ali et al. [61] notes that SEC (single electron capture) from
4 3400 3600 3800 4000 4200 4400 Energy (eV) 0 25 50 75 C ou nt s Lyα Kβ Kγ LyβKδKǫKζKη Kθ Kι Lyγ Lyδ Lyǫ Lyζ Lyη Lyθ Lyι
FIG. 1: Spectrum of bare argon undergoing CX with neutral argon.
1500 1600 1700 1800 1900 2000 Energy (eV) 0 40 80 Mg12 + + CO 2 Si12 + Lyα
Kβ Lyβ Lyγ LyδLyǫ
LyζLyη Si13 + 0
20
40 Lyα Mg12 + + He Si12 +
Kβ Kγ Kδ Lyβ Lyγ Lyδ Lyǫ Si
13 + 0 15 30 Mg12 + + Ne Si12 + Lyα Kγ Lyβ Lyδ Lyǫ Lyζ Lyη 0 20 40 Mg12 + + H 2 Si 12 + Lyα
Kβ Kγ Kδ Lyβ Lyγ Lyδ Lyǫ Lyζ
C
ou
nt
s
FIG. 2: Spectra from bare Mg undergoing CX with four different neutral gases. Relevant transitions, along with background ions, are labeled.
2600 2700 2800 2900 3000 3100 3200 3300 3400 3500 Energy (eV) 0 75 150 C ou nt s Lyα Kβ Kγ Lyβ Kδ Kǫ Kζ Lyγ LyδLyǫ Lyζ Lyη
FIG. 3: (Color online) S16+ and He charge exchange. Note the extremely strong 8 → 1 transition (Ly-η), identified in red.
a neutral with a large ionization potential would require a smaller impact parameter, leading to a low l state of the captured electron. However, our results also show that there is no clear scaling between the l distribution of captures and any of the aforementioned parameters,
as can be seen in figures 4 and 5.
The fact that we do not see a scaling of H with the ion-ization potential in particular may stem from the relative dominance of SEC versus MEC. As pointed out by Ali et al. [61], MEC produces multiply charged ions that au-toionize until reaching a lower n, l state that radiatively
0 10 20 30 40 50 60
Atomic Number
0.0 0.5 1.0 1.5 2.0 2.5 3.0Ha
rdn
ess
Ra
tio
CTMC calc., Wargelin et al. [57] This work Beiersdorfer et al. [31] Allen et al. [59] Otranto et al. [41] Wargelin et al. [57] Beiersdorfer et al. [60] Leutenegger et al. [43]
FIG. 4: (Color online) Hardness ratio as a function of the atomic number of the ion. All experiments were performed at less than ∼25 eV amu−1.
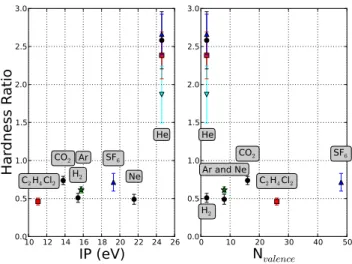
10 12 14 16 18 20 22 24 26 IP (eV) 0.0 0.5 1.0 1.5 2.0 2.5 3.0 H ar dn ess R at io C2H4Cl2 CO2 H2 Ar Ne He SF6 0 10 20 30 40 50 Nvalence 0.0 0.5 1.0 1.5 2.0 2.5 3.0 He H2 Ar and Ne CO2 C2H4Cl2 SF6
FIG. 5: (Color online) Hardness ratio as a function of the ionization potential (left) and the number of valence electrons (right) of the neutral gas. Colors and symbols represent dif-ferent bare ions: Mg in black circles, Cl in red squares, Ar in green stars, S in blue upward-pointing triangles, and P in cyan downward-pointing triangles. The neutral species is indicated on the plot.
decays. This leads to fewer high-n Lyman lines and thus a smaller H. In our experiments, we find that charge exchange with helium as the neutral partner shows an especially high H. This is likely due to a high percentage of single electron capture, as Ali et al. [61] demonstrated, in addition to the high ionization potential of He. How-ever, we measure a low H (∼0.5) for experiments with molecular H, even though one would expect SEC to be dominant for H2.
We suggest that in the case of SEC, the differences we measure in hardness ratio from CX with otherwise similar neutrals stem from inherent differences in the np cross section of those species. These differences can likely only be understood in the context of a rigorous quantum mechanical treatment of the interaction, which must be guided by further experimental benchmarks.
The large variation in hardness ratio we have shown from charge exchange experiments performed at low col-lision energies, in comparison with both previous work in the literature and theoretical calculations using models such as CTMC, demonstrates that open questions still exist in determining the l-selective CX capture cross sec-tion distribusec-tion, and therefore the resulting x-ray spec-trum and its accompanying diagnostics. This is an is-sue that is imperative to address now, so as to properly interpret the high-resolution spectra from the Astro-H x-ray satellite observatory and high-resolution x-ray mi-crocalorimeters to be implemented on future space mis-sions.
Acknowledgments
The authors would like to thank Ed Magee and David Layne at LLNL for their technical support. We also thank the anonymous referees for their helpful comments. Work at the Lawrence Livermore National Laboratory was performed under the auspices of the U.S. Depart-ment of Energy under Contract DE-AC52-07NA27344 and supported by NASA APRA grants to LLNL and NASA/GSFC.
Appendix A: Ratios and Individual Line Strengths
[1] R. C. Isler, Phys. Rev. Lett. 38, 1359 (1977).
[2] R. J. Fonck, M. Finkenthal, R. J. Goldston, D. L. Hern-don, R. A. Hulse, R. Kaita, and D. D. Meyerhofer, Phys. Rev. Lett. 49, 737 (1982).
[3] R. J. Fonck and R. A. Hulse, Phys. Rev. Lett. 52, 530 (1984).
[4] E. K¨allne, J. K¨allne, A. Dalgarno, E. S. Marmar, J. E. Rice, and A. K. Pradhan, Phys. Rev. Lett. 52, 2245 (1984).
[5] J. E. Rice, E. S. Marmar, J. L. Terry, E. Kallne, and J. Kallne, Phys. Rev. Lett. 56, 50 (1986).
[6] T. St¨ohlker, T. Ludziejewski, H. Reich, F. Bosch, R. W. Dunford, J. Eichler, B. Franzke, C. Kozhuharov, G. Men-zel, P. H. Mokler, et al., Phys. Rev. A 58, 2043 (1998). [7] G. Gabrielse, P. Larochelle, D. Le Sage, B. Levitt, W. S.
Kolthammer, I. Kuljanishvili, R. McConnell, J. Wrubel, F. M. Esser, H. Gl¨uckler, et al. (ATRAP Collaboration), Phys. Rev. Lett. 98, 113002 (2007).
6 TABLE I: This table summarizes the normalized H-like series line strengths and hardness ratios for the experiments presented in the text. Filter transmission-and ice-corrected line strengths are normalized to the sum of Ly-α 1 transmission-and 2. Uncertainties are one-sigma statistical errors. The flux ratio for Ly-α 1:2 was set to two in the model fits for the Mg experiments, but for the other experiments this ratio was allowed to vary and is presented in the table. The line strengths listed for the Mg12+
Ly-γ lines are upper limits, including both the flux in the Mg Ly-γ line as well as the Si12+
1s2s 3
S1 → 1s2 1S0 overlapping transition.
The hardness ratios listed for the Mg12+
experiments are calculated assuming the lower limit, i.e. zero flux in this blended Mg Ly-γ line. The upper limits on H, which use the upper limit flux in Ly-γ, are the following: Mg12+
+ CO2: 0.905±0.063, Mg 12+ + He: 6.446±0.832, Mg12+ + H2: 0.846±0.087, Mg 12+ + Ne: 0.623±0.076. Transition Mg12+ + CO2 Mg12++ He Mg12++ H2 Mg12++ Ne P15++ He S16++ He S16++ SF6 Cl17++ He Cl17++ C2H4Cl2 Ar18++ Ar 1s − 3p 0.211 ± 0.022 0.610 ± 0.099 0.184 ± 0.033 0.227 ± 0.040 0.281 ± 0.075 0.32 ± 0.12 0.203 ± 0.070 0.239 ± 0.050 0.227 ± 0.030 0.204 ± 0.020 1s − 4p 0.167 ± 0.020 3.86 ± 0.28 0.337 ± 0.044 0.133 ± 0.022 0.285 ± 0.076 0.155 ± 0.022 0.082 ± 0.016 0.253 ± 0.051 0.066 ± 0.014 0.084 ± 0.012 1s − 5p 0.058 ± 0.011 0.319 ± 0.073 0.063 ± 0.011 0.044 ± 0.015 0.210 ± 0.057 0.114 ± 0.019 0.053 ± 0.011 0.150 ± 0.034 0.0399 ± 0.0052 0.0528 ± 0.0091 1s − 6p 0.064 ± 0.012 1.41 ± 0.16 0.063 ± 0.012 0.095 ± 0.015 0.120 ± 0.032 0.069 ± 0.013 0.0527 ± 0.0082 0.078 ± 0.015 0.0449 ± 0.0059 0.0466 ± 0.0087 1s − 7p 0.169 ± 0.020 0.053 ± 0.043 0.146 ± 0.026 0.030 ± 0.018 0.82 ± 0.18 0.213 ± 0.028 0.0162 ± 0.0050 0.037 ± 0.017 0.0249 ± 0.0056 0.0272 ± 0.0042 1s − 8p 0.229 ± 0.024 0.072 ± 0.039 0.036 ± 0.014 0.080 ± 0.014 0.092 ± 0.036 1.74 ± 0.14 0.0291 ± 0.0078 1.60 ± 0.22 0.0262 ± 0.0064 0.0169 ± 0.0040 1s − 9p 0.0054 ± 0.0078 0.074 ± 0.052 0.0133 ± 0.0050 0.0084 ± 0.0041 0.059 ± 0.029 0.0125 ± 0.0089 0.111 ± 0.019 0.026 ± 0.026 0.0184 ± 0.0072 0.0016 ± 0.0039 1s − 10p 0.0028 ± 0.0054 0.048 ± 0.052 0.0031 ± 0.0063 0.0059 ± 0.0090 0.003 ± 0.013 0.0330 ± 0.0062 0.165 ± 0.024 0.0001 ± 0.0097 0.0130 ± 0.0099 0.181 ± 0.019 Ly-α 1:2 2.19 ± 0.36 2.22 ± 0.45 1.16 ± 0.27 1.26 ± 0.19 1.41 ± 0.19 H 0.738 ± 0.054 2.581 ± 0.376 0.509 ± 0.059 0.490 ± 0.065 1.868 ± 0.374 2.660 ± 0.265 0.714 ± 0.116 2.383 ± 0.307 0.460 ± 0.047 0.614 ± 0.041
TABLE II: This table presents the normalized He-like series line strengths for the experiments presented in the text except for Mg11+
+ Ne, which had significant line blending in the Mg forbidden (z), intercombination (y and x), and resonance (w) lines with Ne9+. Filter transmission- and ice-corrected line strengths are
normalized to w. Uncertainties are one-sigma statistical errors. Also presented are the He-like line ratios defined in [62]: R = Fz/(Fx+ Fy), G = Fx+ Fy+ Fz/Fw,
an alternate quantity giving the triplet-to-singlet capture ratio, G′= (F
x+ Fy+ Fz)/(Fw+ F3+), the He-like hardness ratio H = F3+/(F2), and a ratio introduced in
[43], H′= F
3+/Fw. F represents the flux in the denoted transition lines.
Transition Mg11+ + CO2 Mg 11+ + He Mg11+ + H2 S 15+ + He S15+ + SF6 Cl 16+ + He Cl16+ + C2H4Cl2 Ar 17+ + Ar z 1.53 ± 0.16 3.71 ± 0.59 2.90 ± 0.24 5.12 ± 0.25 1.60 ± 0.12 5.82 ± 0.38 1.520 ± 0.096 1.889 ± 0.084 x/y 1.23 ± 0.14 1.28 ± 0.24 0.861 ± 0.092 1.777 ± 0.098 1.61 ± 0.12 2.23 ± 0.21 1.65 ± 0.14 1.39 ± 0.18 1s − 3p 0.219 ± 0.043 0.71 ± 0.16 0.347 ± 0.051 0.349 ± 0.030 0.231 ± 0.031 0.450 ± 0.051 0.185 ± 0.024 0.296 ± 0.022 1s − 4p 0.184 ± 0.040 0.56 ± 0.14 0.209 ± 0.036 0.216 ± 0.023 0.117 ± 0.021 0.307 ± 0.038 0.107 ± 0.018 0.135 ± 0.014 1s − 5p 0.108 ± 0.024 0.47 ± 0.11 0.125 ± 0.026 0.176 ± 0.026 0.065 ± 0.023 0.141 ± 0.023 0.062 ± 0.013 0.076 ± 0.010 1s − 6p 0.090 ± 0.024 0.145 ± 0.086 0.030 ± 0.011 0.141 ± 0.018 0.0411 ± 0.0059 0.112 ± 0.022 0.0440 ± 0.0089 0.0616 ± 0.0092 1s − 7p 0.114 ± 0.029 0.42 ± 0.12 0.029 ± 0.012 0.160 ± 0.019 0.0152 ± 0.0061 0.220 ± 0.033 0.0212 ± 0.0047 0.0290 ± 0.0057 1s − 8p 0.315 ± 0.098 0.018 ± 0.018 0.0050 ± 0.0053 0.0244 ± 0.0078 0.0669 ± 0.0095 0.0137 ± 0.0047 0.0287 ± 0.0060 1s − 9p 0.0055 ± 0.0042 0.0293 ± 0.0077 0.0002 ± 0.0033 0.0029 ± 0.0037 0.0195 ± 0.0049 1s − 10p 0.0026 ± 0.0015 0.0012 ± 0.0041 0.0097 ± 0.0028 0.0140 ± 0.0046 0.0327 ± 0.0061 R 1.248 ± 0.126 2.904 ± 0.420 3.365 ± 0.302 2.879 ± 0.110 0.994 ± 0.064 2.604 ± 0.200 0.922 ± 0.075 1.362 ± 0.179 G 2.755 ± 0.269 4.991 ± 0.777 3.758 ± 0.306 6.893 ± 0.325 3.214 ± 0.215 8.053 ± 0.532 3.169 ± 0.204 3.276 ± 0.218 G′ 1.606 ± 0.129 1.378 ± 0.139 2.137 ± 0.143 3.354 ± 0.121 2.108 ± 0.122 3.491 ± 0.168 2.187 ± 0.127 1.857 ± 0.082 H 0.191 ± 0.020 0.438 ± 0.048 0.159 ± 0.015 0.134 ± 0.010 0.124 ± 0.017 0.144 ± 0.008 0.108 ± 0.009 0.159 ± 0.013 H′ 0.715 ± 0.091 2.622 ± 0.448 0.759 ± 0.085 1.055 ± 0.090 0.525 ± 0.078 1.307 ± 0.105 0.449 ± 0.040 0.678 ± 0.053
[8] J. B. Greenwood, I. D. Williams, S. J. Smith, and A. Chutjian, Phys. Rev. A 63, 062707 (2001).
[9] I. Cadez, J. B. Greenwood, J. Lozano, R. J. Mawhorter, M. Niimura, S. J. Smith, and A. Chutjian, Journal of Physics B: Atomic, Molecular and Optical Physics 36, 3303 (2003).
[10] R. J. Mawhorter, A. Chutjian, T. E. Cravens, N. Djuri´c, S. Hossain, C. M. Lisse, J. A. MacAskill, S. J. Smith, J. Simcic, and I. D. Williams, Phys. Rev. A 75, 032704 (2007).
[11] J. B. Greenwood, R. J. Mawhorter, I. Cadez, J. Lozano, S. J. Smith, and A. Chutjian, Physica Scripta Volume T 110, 358 (2004).
[12] J. Simcic, D. R. Schultz, R. J. Mawhorter, I. ˇCadeˇz, J. B. Greenwood, A. Chutjian, C. M. Lisse, and S. J. Smith, Phys. Rev. A 81, 062715 (2010).
[13] P. G. Carolan, B. P. Duval, A. R. Field, S. J. Fielding, N. C. Hawkes, N. J. Peacock, G. Fussmann, G. Janes-chitz, J. Hofmann, K. H. Behringer, et al., Phys. Rev. A 35, 3454 (1987).
[14] P. Beiersdorfer, M. Bitter, M. Marion, and R. E. Olson, Phys. Rev. A 72, 032725 (2005).
[15] R. C. Isler, Plasma Physics and Controlled Fusion 36, 171 (1994).
[16] S. Katsuda, H. Tsunemi, K. Mori, H. Uchida, H. Kosugi, M. Kimura, H. Nakajima, S. Takakura, R. Petre, J. W. Hewitt, et al., Astrophys. J. 730, 24 (2011), 1103.1669. [17] R. S. Cumbee, D. B. Henley, P. C. Stancil, R. L. Shelton, J. L. Nolte, Y. Wu, and D. R. Schultz, Astrophys. J. Lett. 787, L31 (2014), 1405.0939.
[18] C. M. Lisse, K. Dennerl, J. Englhauser, M. Harden, F. E. Marshall, M. J. Mumma, R. Petre, J. P. Pye, M. J. Rick-etts, J. Schmitt, et al., Science 274, 205 (1996).
[19] T. E. Cravens, Geophys. Res. Lett. 24, 105 (1997). [20] G. R. Gladstone, J. H. Waite, D. Grodent, W. S. Lewis,
F. J. Crary, R. F. Elsner, M. C. Weisskopf, T. Majeed, J.-M. Jahn, A. Bhardwaj, et al., Nature (London) 415, 1000 (2002).
[21] K. Dennerl, C. M. Lisse, A. Bhardwaj, V. Burwitz, J. Englhauser, H. Gunell, M. Holmstr¨om, F. Jansen, V. Kharchenko, and P. M. Rodr´ıguez-Pascual, Astron. Astrophys. 451, 709 (2006).
[22] D. Koutroumpa, R. Lallement, V. Kharchenko, and A. Dalgarno, Space Sci. Rev. 143, 217 (2009), 0805.3212. [23] K. Dennerl, C. M. Lisse, A. Bhardwaj, D. J. Christian, S. J. Wolk, D. Bodewits, T. H. Zurbuchen, M. Combi, and S. Lepri, Astronomische Nachrichten 333, 324 (2012).
[24] A. Bhardwaj, R. F. Elsner, G. Randall Gladstone, T. E. Cravens, C. M. Lisse, K. Dennerl, G. Branduardi-Raymont, B. J. Wargelin, J. Hunter Waite, I. Robertson, et al., Planet. Space Sci. 55, 1135 (2007), 1012.1088. [25] T. G. Slanger, T. E. Cravens, J. Crovisier, S. Miller, and
D. F. Strobel, Space Sci. Rev. 139, 267 (2008).
[26] D. Bodewits, Ph.D. thesis, University of Groningen, P.O. Box 72, 9700 AB Groningen, The Netherlands (2007).
[27] R. K. Janev and H. Winter, Phys. Rep. 117, 265 (1985). [28] S. Otranto and R. E. Olson, Journal of Physics B Atomic
Molecular Physics 43, 144004 (2010).
[29] K. Igenbergs, J. Schweinzer, A. Veiter, L. Perneczky, E. Fr¨uhwirth, M. Wallerberger, R. E. Olson, and F. Au-mayr, Journal of Physics B Atomic Molecular Physics 45, 065203 (2012), 1112.3513.
[30] Y. Wu, P. C. Stancil, D. R. Schultz, Y. Hui, H. P. Lieber-mann, and R. J. Buenker, Journal of Physics B Atomic Molecular Physics 45, 235201 (2012).
[31] P. Beiersdorfer, R. E. Olson, G. V. Brown, H. Chen, C. L. Harris, P. A. Neill, L. Schweikhard, S. B. Utter, and K. Widmann, Physical Review Letters 85, 5090 (2000). [32] B. J. Wargelin, P. Beiersdorfer, and G. V. Brown,
Cana-dian Journal of Physics 86, 151 (2008), 0708.0233. [33] H. Ryufuku, K. Sasaki, and T. Watanabe, Phys. Rev. A
21, 745 (1980).
[34] A. Niehaus, Journal of Physics B: Atomic and Molecular Physics 19, 2925 (1986).
[35] A. Salop and R. E. Olson, Phys. Rev. A 13, 1312 (1976). [36] R. K. Janev, D. S. Beli´c, and B. H. Bransden, Phys. Rev.
A 28, 1293 (1983).
[37] W. Fritsch and C. D. Lin, Phys. Rep. 202, 1 (1991). [38] N. Shimakura, S. Suzuki, and M. Kimura, Phys. Rev. A
48, 3652 (1993).
[39] R. Abrines and I. C. Percival, Proceedings of the Physical Society 88, 861 (1966).
[40] R. E. Olson and A. Salop, Phys. Rev. A 16, 531 (1977). [41] S. Otranto, R. E. Olson, and P. Beiersdorfer, Phys. Rev.
A 73, 022723 (2006).
[42] N. Djuri´c, S. J. Smith, J. Simcic, and A. Chutjian, As-trophys. J. 679, 1661 (2008).
[43] M. A. Leutenegger, P. Beiersdorfer, G. V. Brown, R. L. Kelley, C. A. Kilbourne, and F. S. Porter, Physical Re-view Letters 105, 063201 (2010), 1008.2478.
[44] P. C. Stancil, J. G. Wang, M. J. Rakovic, D. R. Schultz, and R. Ali, in Atomic and Molecular Data and Their Applications, edited by D. R. Schultz, P. S. Krstic, and F. Ownby (2002), vol. 636 of American Institute of Physics Conference Series, pp. 144–153.
[45] I. Manˇcev, N. Milojevi´c, and D. Belki´c, Phys. Rev. A 88, 052706 (2013).
[46] R. Ali, C. L. Cocke, M. L. A. Raphaelian, and M. Stockli, Phys. Rev. A 49, 3586 (1994).
[47] S. Otranto, R. E. Olson, and P. Beiersdorfer, Journal of Physics: Conference Series 58, 165 (2007).
[48] P. Beiersdorfer, E. Behar, K. R. Boyce, G. V. Brown, H. Chen, K. C. Gendreau, A. Graf, M.-F. Gu, C. L. Har-ris, S. M. Kahn, et al., Nuclear Instruments and Methods in Physics Research B 205, 173 (2003).
[49] P. Beiersdorfer, Canadian Journal of Physics 86, 1 (2008).
[50] F. S. Porter, G. V. Brown, K. R. Boyce, R. L. Kelley, C. A. Kilbourne, P. Beiersdorfer, H. Chen, S. Terracol, S. M. Kahn, and A. E. Szymkowiak, Review of Scientific Instruments 75, 3772 (2004).
[51] F. S. Porter, B. R. Beck, P. Beiersdorfer, K. R. Boyce, G. V. Brown, H. Chen, J. Gygax, S. M. Kahn, R. L. Kel-ley, C. A. Kilbourne, et al., Canadian Journal of Physics 86, 231 (2008).
[52] P. Beiersdorfer, A. L. Osterheld, V. Decaux, and K. Wid-mann, Physical Review Letters 77, 5353 (1996). [53] P. Beiersdorfer, L. Schweikhard, J. Crespo L´
opez-Urrutia, and K. Widmann, Review of Scientific Instru-ments 67, 3818 (1996).
[54] R. L. Kelley, K. Mitsuda, C. A. Allen, P. Arsenovic, M. D. Audley, T. G. Bialas, K. R. Boyce, R. F. Boyle, S. R. Breon, G. V. Brown, et al., Publ. Astron. Soc. Japan 59, 77 (2007).
[55] M. F. Gu, Canadian Journal of Physics 86, 675 (2008). [56] P. Beiersdorfer, Ann. Rev. Astron. Astrophys. 41, 343
8
(2003).
[57] B. J. Wargelin, P. Beiersdorfer, P. A. Neill, R. E. Olson, and J. H. Scofield, Astrophys. J. 634, 687 (2005), astro-ph/0508078.
[58] M. A. Leutenegger, G. L. Betancourt-Martinez, P. Beiersdorfer, G. V. Brown, R. L. Kelley, C. A. Kil-bourne, and F. S. Porter, Physica Scripta Volume T 156, 014006 (2013).
[59] F. I. Allen, C. Biedermann, R. Radtke, G. Fussmann,
and S. Fritzsche, Phys. Rev. A 78, 032705 (2008). [60] P. Beiersdorfer, C. M. Lisse, R. E. Olson, G. V. Brown,
and H. Chen, Astrophys. J. Lett. 549, L147 (2001). [61] R. Ali, P. A. Neill, P. Beiersdorfer, C. L. Harris, M. J.
Rakovi´c, J. G. Wang, D. R. Schultz, and P. C. Stancil, Astrophys. J. Lett. 629, L125 (2005).