OATAO is an open access repository that collects the work of Toulouse
researchers and makes it freely available over the web where possible
Any correspondence concerning this service should be sent
to the repository administrator:
[email protected]
This is an author’s version published in: http://oatao.univ-toulouse.fr/21877
To cite this version:
Delahaye, Anthony and Youssef, Ziad and Hoang, Minh and Oignet, Jérémy and Fournaison,
Laurence and Torré, Jean-Philippe
and Diaz, Joseph and Dicharry,
Christophe Improvement of CO2 hydrate formation and flow using chemical additives in a
slurry loop and a stirred reactor: applications to refrigeration and CO2 capture. (2014) In: 8th
International Conference on Gas Hydrates (ICGH8), 28 July 2014 - 1 August 2014 (Beijing,
China).
IMPROVEMENT OF CO
2HYDRATE FORMATION AND FLOW USING
CHEMICAL ADDITIVES IN A SLURRY LOOP AND A STIRRED
REACTOR: APPLICATIONS TO REFRIGERATION AND CO
2CAPTURE
Anthony Delahaye∗∗∗∗, Ziad Youssef, Minh Hoang, Jérémy Oignet, Laurence Fournaison, Irstea GPAN, Génie des Procédés Frigorifiques, 1 rue Pierre-Gilles de Gennes,
CS 10030 – 92761 Antony cedex, France
Jean-Philippe Torré, Joseph Diaz, Christophe Dicharry
Univ. Pau & Pays Adour, CNRS, TOTAL – UMR 5150 – LFC-R – Laboratoire des Fluides Complexes et leurs Réservoirs, Avenue de l'Université, BP 1155 – 64013 Pau, France
ABSTRACT
Secondary refrigeration and thermal energy storage techniques could be interesting solutions to improve refrigerating system performances and to reduce power consumption and propagation of refrigerants in the atmosphere. In order to combine a more efficient secondary loop and fluids with higher energy storage capacity, a phase change material (PCM) slurry, also called phase change slurry (PCS), could be used as secondary refrigerant. In addition, hydrate-based processes could be an interesting option to separate the CO2 from various gas mixtures. In these two
applications, the flow properties of the CO2 hydrate slurry are of paramount importance. In the
present study, small amounts of Sodium Dodecyl Sulfate (SDS) were added to the aqueous phase, and this system was tested under CO2 pressure both in a dynamic flow loop and in a stirred
reactor. The results obtained with the flow loop demonstrate that SDS has anti-agglomerant properties for the CO2 hydrate: SDS significantly decreases agglomeration and thus improves
flowing capacities of the slurry. The results obtained in the reactor shows that the presence of SDS increases the kinetics of the hydrate growth rate both in agitated and in quiescent hydrate forming conditions. Consequently, the addition of SDS could be very promising in industrial applications, such as secondary refrigeration or gas separation, where hydrate slurries must be easily handled and where the hydrate formation rate is of great importance.
Keywords: SDS, CO2, rheology, kinetics, flow-loop, anti-agglomerant, gas separation, slurry
∗ Corresponding author: Phone: +33 (0)1 40 96 60 21 Fax +33 (0)1 40 96 60 75 E-mail: [email protected]
1. INTRODUCTION
Over this past decade, gas hydrates have received significant attention for developing some emerging practical applications in various domains, such as refrigeration, gas transportation, water treatment and gas separation.
Currently, the refrigeration industry accounts for 8% of the greenhouse gases (GHG) emissions,
including the impact of the classical refrigerant fluids used for cold production such as HCFC (Hydrochlorofluorocarbones), HFC (Hydrofluo-rocarbones) and CFC (Chlorofluo(Hydrofluo-rocarbones) refrigerants. 80 % of the pollution caused by cold production is due to the energy consumption of the installations and 20 % are caused by the leakage of the refrigerant gas. That’s why it becomes really important to find a solution to reduce their quantities. One of the solutions could be the use of
Proceedings of the 8th International Conference on Gas Hydrates (ICGH8-2014), Beijing, China, 28 July - 1 August, 2014
secondary refrigeration. In such a system two loops are used. The first one has reduced dimensions and is used for cold energy production whereas the second one is used for cold storage and transport. The main interest of this system is to reduce the quantities of primary refrigerant fluids by using secondary refrigerant fluids with high dissociation enthalpy such as CO2 hydrate
slurries [1]. Previous studies have shown that CO2
hydrate have a strong dissociation enthalpy around 500 kJ.kg-1water [2] which is higher than that of ice
(333 kJ.kg-1).
The development of more efficient and economically competitive processes for CO2
separation could also participate to the global effort made to reduce the emissions of CO2 in the
atmosphere. For this application, the use of hydrate-based technologies could be an interesting option [3] as the hydrate formation can be, in certain conditions, selective to one of the gases contained in the initial gas mixture. In this respect, hydrate-based solutions appear as a promising option for CO2 capture.
In these two applications (i.e., refrigeration and CO2 separation processes), the flow properties of
the CO2 hydrate slurry are of paramount
importance.
Previous studies of the authors from IRSTEA have showed that CO2 hydrate slurries in aqueous phase
can agglomerate when hydrate mass fraction is above 5 % and plug the flow loop [4]. Thus, to be good secondary refrigerant fluids, hydrate slurries need to have good flowing properties. In addition, the authors from the LFC-R have shown that the presence of certain additives, particularly the Sodium Dodecyl Sulfate significantly enhances the hydrate formation kinetics and the amount of hydrate formed, with pure gas or gas mixtures [5], in bulk or in porous media [6], and even at very low dosage such as hundreds of ppm [7]. However, the action mechanism of this surfactant needs to be confirmed and is hardly debated in literature for more than 10 years.
Among the various action mechanism of SDS on CO2 hydrates, it has been proposed that SDS may
have anti-agglomerant properties [8,9]. However, no direct evidence of this “anti-agglomerant properties of the SDS” has been provided to date in literature for the CO2 hydrate.
The aim of this paper is thus to present:
(i) a rheological study of CO2 hydrate slurries in
presence of SDS carried out in a dynamic flow loop, in order to observe the influence of SDS on the slurry viscosity. The rheological behavior of the fluids will be determined in a dynamic loop with a differential pressure gauge and a flowmeter by applying the capillary viscosimeter method, and the Herschel-Bulkley model will be used to represent the apparent viscosities data of the slurries.
(ii) a kinetic study of the same system (water/CO2/SDS) performed in a agitated
high-pressure reactor at the same SDS concentration to the one used for flow experiments. In these experiments, the effect of the SDS concentration and the agitation rotation speed are studied regarding the instantaneous/average hydrate growth rate, apparent rate constant, and water to hydrate conversion.
2. MATERIALS, APPARATUSES AND
METHODS 2.1. Materials
Various products and chemicals have been used for the experiments presented in the following. Information on materials used is provided in Table 1.
Material Symbol Supplier and purity sodium dodecyl sulfate SDS Sigma-Aldrich ≥ 99.0 % 1 Chem-Lab > 98 % 2 carbon dioxide CO2 Linde Gas 99.995 % 1, 2 tetrahydrofuran THF Chem-Lab > 99.9 % 2
Table 1. Information concerning the materials used in this work. The superscripts 1 and 2 are for flow
loop and kinetics experiments, respectively. The main additive used in this work in the Sodium Dodecyl Sulphate. This is an anionic surfactant widely used in the formulation of various cleaning and hygiene products. SDS has the formula
CH3(CH2)11OSO3Na, its molar mass is 288.4
g.mol-1 and has a density of 1.01 g.cm-³. Water-SDS aqueous solutions were prepared at 293.2 K. The concentration (expressed in ppm by weight in the following) of SDS solutions was quasi identical for the experiments carried out with the flow loop (1750 ± 25 ppm), and for the experiments carried out with the stirred reactor (1700 ± 15 ppm). This concentration has been chosen on the basis of previous kinetics experiments where it was found – both for pure CO2 and for CO2-CH4 gas mixture – that the
suitable SDS concentration for enhancing the hydrate growth rate is located betwwen 1500 and 3000 ppm [5,10].
2.1. Experiments with the flow loop
The experimental data (phase change temperatures and pressures, pressure drop and volume flow) were determined by using a dynamic loop that is placed in a PID-temperature-controlled cold room (6 m3). The loop is used for the production of slurries as well for the determination of thermodynamic and rheological characteristics of slurries.
The dynamic loop
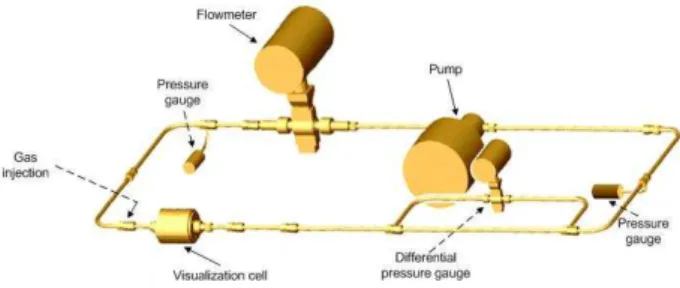
The loop is mainly composed of stainless steel pipes with an internal diameter of 8 mm (external diameter of 10 mm). A scheme of the apparatus is shown in Figure 1. The total volume of the loop is 265 cm3. Temperatures and pressures are well controlled respectively in the range of 268 – 293 K and up to 3.5 MPa. The dynamic loop is mainly composed of a visualization cell with a volume of around 30 cm3, a differential pressure gauge (ABB 265 DS, up to 0.02 MPa, ±0.04 %), a pump (220-type, Maximum flow rate = 0.17 m3.h-1) and electromagnetic flowmeter (IFM6080K-type Variflux, ± 0.5 %). The loop is located inside a cooling chamber, allowing a good control of the temperature. The visualization cell allows the observation of phase changes. The differential pressure gauge measures the pressure drops caused by the fluid. The flow is controlled by the pump and is measured by the flowmeter. The device is equipped with 6 T-type thermocouples and 2 pressure gauges (range: 0-5.0 MPa, precision 0.05 %). The liquid injection is performed by imposing the vacuum in the loop.
Figure 1 : Representation of the dynamic loop
Gas injection
A syringe pump (1000D ISCO) is used for controlled CO2 injection into the dynamic loop.
Initially, gas is directly injected into the syringe pump which consists of a cylinder with a total volume of around 1000 cm3. There, the volume, temperature and pressure can be controlled which allows the determination of the initial amount of gas,
n
gaspump,i , by using the reel gas equation. Afterwards, when gas is injected into the dynamic loop, the pressure in the syringe pump is decreased (the volume is constant) and the remaining amount of gas in the syringe pumpn
gaspump f,
can also be determined. The amount of injected gas into the loop,
n
igas, is the difference between the initialamount and the final amount of gas in the syringe pump. f pump gas i pump gas i gas
n
n
n
=
−
(1)Basis of the rheological study
Fluid dynamic behaviour of liquid is generally classified into Newtonian fluids and non-Newtonian fluids. For non-Newtonian fluids such as water, the viscosity is constant and independent of the shear rate
γ
. That's not the case of non-Newtonian fluids, in which the viscosity changes with the shear rate and the behaviour of such fluid can be described by using the Ostwald equation:. . n
k
γ
τ
= (2)τ
is shear stress (Pa),.
γ
is the shear rate (s-1), k and n are coefficients. k is the fluid consistency coefficient (Pa.sn) and n is dimensionless flow behaviour index. It represents the degree that the fluid deviates from the Newtonian fluid. The more n differs from 1, the more the fluid is non Newtonian. If n = 1, then the fluid behaves as a Newtonian fluid, n < 1 for pseudo-plastics fluidsand n > 1 for dilatants fluids. In our work, fluid rheology is determined by using an empirical model [11,12]. It is based on the method of the capillary viscometer method (Ostwald viscometer). In a first approach, the slurry is supposed to be flowing in laminar regime without wall slip and is considered to be pseudo-homogenous. Shear stress and shear rate can be thus represented by their values at the wall, w, by using Rabinowitsch and Mooney’s general equation [13].
τ
γ
τ
τ
π
τd
R
Q
w w . 0 2 3 31
∫
=
(3)where Q is the volume flow, R the pipe radius and
.
γ
the shear rate at the wall.τ
w represents the shear stress at the wall. It is calculated as function of the experimental data: Pressure drop ∆P, pipe length L and diameter D. The shear rate at the wall is calculated as function of the flow behaviour index, pipe diameter and fluid velocity.L P D w 4 .∆ =
τ
(4) + = n n D u w 4 1 3 8 .γ
(5) D u d L P D d n 8 ln 4 ln ∆ = (6)where u represents the fluid velocity. As a summary, experimental data (pressure drop and volume flow) were used to determine the fluid behaviour of the fluid according to the general Herschel-Bulkley (HB) model as described below.
. 0 . n w w
τ
kγ
τ
= + (7)Where
τ
0 represents the yield stress. The apparent viscosity,µ
, was thus deduced by to simply dividing the shear stress at the wall by the shear at the wall. . w wγ
τ
µ
= (8)Hydrate slurries must be considered as pseudo-homogeneous fluids, circulating in a laminar regime in cylindrical pipe without wall slip.
Experimental protocol
Between 200 and 250 g. of water-SDS aqueous solution was injected into the experimental device. Carbon dioxide was injected at 283.2 K, and once the maximum amount of CO2 solubility was
reached, the temperature was then decrease to 274-275 K allowing CO2 hydrate formation with high
pressures between 1.5 and 2.5 MPa. In general, it was found that the presence of SDS doesn't impact CO2 equilibrium conditions formations, in
agreement with results found in literature for the CO2+SDS system [9] .
2.2. Experiments on hydrate formation kinetics
Experimental apparatus
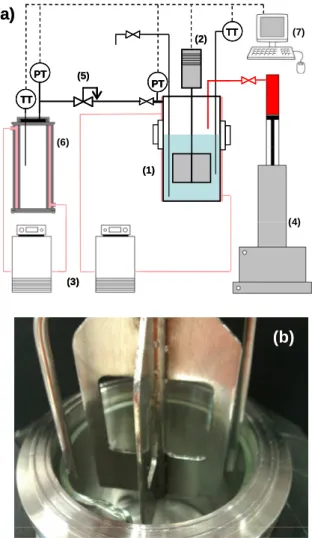
The experimental setup used is schematized in Figure 2(a).
The reactor is a stainless steel high-pressure cell able to run experiments up to pressures of 20 MPa. This reactor is equipped with a mechanical stirring system able to provide a sufficient torque necessary for maintaining a constant agitation rotation speed inside the reactor during hydrate crystallization. The cell volume, including all dead volumes (i.e., connections with lines, fittings, pressure gauges and pressure sensors), is equal to
VR = 370.1 ± 0.2 cm3. The reactor is jacketed, and
its temperature is regulated by circulation of a propylene glycol solution inside the jacket. The cell has two see-through sapphire windows of 10 mm diameter to be able to visualize the aspect of the hydrates during the experiment, a PT100 probe located inside the reactor to measure the liquid temperatures with an accuracy of ± 0.2 K, and a plunging pipe to take samples from the bulk. The reactor pressure is measured with a 0-10 MPa pressure transducer (PA33X from KELLER) with an accuracy of ± 0.02 MPa. The mechanical agitation is insured by a home-made impeller, specially designed for slurry mixing. As shown in Figure 2(b), a glass cylindrical vessel is placed inside the reactor. The inner surface of this glass vessel has been chemically treated by using 1H,1H,2H,2H-perfluorodecyltrichlorosilane in order to render its surface hydrophobic to water. These kind of fluorinated silanes have proved to perform very well to obtain hydrate-phobic surfaces [14]. As the growing of hydrates on reactor walls has been observed in our previous experiments carried out with other apparatuses
[7,9], it is necessary for this work to minimize the adhesion of hydrates on reactor walls to study the true effects of the agitation conditions on the hydrate crystallization (i.e. and not having a part of the crystals formed immobilized on the reactor shell and thus not directly impacted by the agitation conditions). (1) (3) TT PT PT TT (4) (6) (5) (2) (7) (a) (b) (1) (3) TT TT PT PT PT PT TT TT (4) (6) (5) (2) (7) (a) (b)
Figure 2. Experimental rig used for hydrate formation kinetics studies. (a) Schematic view of
the apparatus: (1) agitated reactor, (2) agitation motor, (3) cryo-thermostatic baths, (4) syringe ISCO pump, (5) pressure reducing valve, (6) gas
storage tank, (7) computer and data acquisition system ; (b) picture of the reactor inside. The reactor can be operated either in “batch mode”, or in “semi-continuous” - also called “semi-batch mode” (these two reactor configurations are used in this study). In the batch mode, the reactor is isolated from the gas storage vessel by closing the feed gas valve (isochoric conditions). In the semi-batch mode, the feed
valve is kept open allowing fresh gas to be delivered to the reactor (isobaric conditions). The whole system is monitored via a computer and the acquisition frequency for data acquisition is set to 0.2 Hz for all experiments.
Basis of hydrate formation kinetics
Many subjects concerning the kinetics of hydrate formation have been already discussed in literature, both on experimental and modelling. The reader interested to obtain valuable information on this wide subject is invited to consult the review of Ribeiro and Lage (2008) [15]. A part of the experimental results obtained in this work have been analysed on the basis of the kinetic model proposed by Englezos and co-workers [16]. This model is one of the most complete kinetic model available in literature [15]. In short, on the basis of this model, hydrate formation can be decomposed in three steps: (i) the diffusion of the guest molecule from the gas liquid interface to the liquid bulk ;
(ii) the diffusion of the guest molecule from the liquid bulk to the hydrate-solution interface; (iii) the reaction between water and the guest molecule at the hydrate-solution interface.
The growth rate for a hydrate particle with an interfacial area Ap can be expressed as:
) (f feq p KA p dt dn = − (9)
f the fugacity of the dissolved gas, feq the three
phase equilibrium fugacity at the operating temperature, and K the overall mass transfer coefficient (which includes the different mass transfer resistances linked to the hydrate formation mechanism described above).
Considering all the hydrate particles, Eq. (9) can be rewritten as:
(
f feq)
K dt g dn dt h dn − = − = 4π µ2 (15)where nh is the mole number of CO2 enclathrated
in the hydrates, ng the mole number of CO2 in the
gas phase, and µ2 the second moment of the
The two-film theory is used to represent the step of diffusion of the guest molecule from the gas liquid interface to the bulk, assuming quasi-steady state. In a slice of thickness dy, (y being the normal surface coordinate), it comes:
(
f feq)
K dy C d D =4 2 − ² ² µ π (16)where D is the diffusion coefficient of CO2 in the
solution and C the CO2 concentration.
Henry’s law is used to correlate the fugacity to the gas concentration, and the set of equations set can be solved considering the following boundary conditions at y = 0 and y = ξ (ξ being the thickness of the boundary layer):
eq C y C =0 = ; C y=ξ =Cb (17)
where Cb is the concentration of the dissolved gas
in the liquid bulk.
We have chosen to analyse the results of this work by using the formulation of Englezos’s model proposed by Zhang et al. (2007) [8].
Finally, the hydrate growth rate is given by :
(
f feq)
t app K dt g dn r=− = () − (18)where the apparent rate constant Kapp is :
= w DC H K H w C DK gl A t app K () πµ2 coth ξ πµ2 (19)
in which Agl is the gas-liquid interfacial area, H the
Henry’s constant and K the overall mass transfer coefficient expressed as : d k r k K 1 1 1 = + (20)
with kr the intrinsic growth rate constant for the
hydrate particle growth reaction, and kd the mass
transfer coefficient around the hydrate particle.
Experimental protocol
The protocol is composed by four following consecutive steps: (i) reactor loading with the aqueous solution and with CO2; (ii) solubilization
of CO2 in the aqueous solution in semi-batch; (iii)
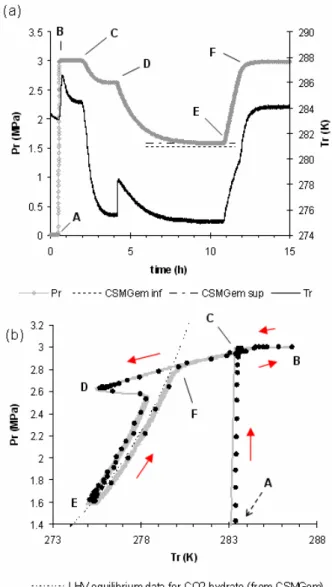
hydrate formation in batch configuration; (iv) hydrates dissociation. Details are given below and the different steps are explained in Figure 3(a) on a typical experiment (no SDS in the water for the case presented).
A mass of 155.0 ± 0.1 g of solution is charged into the reactor. Then, the reactor is closed and regulated to the temperature of 284 ± 1 K under agitation (point A in Figure 3). The reactor is put under vacuum to remove any trace of air (point A in Figure 3). When temperature is stabilized, the agitation is stopped and CO2 is loaded in the
reactor up to the pressure of 3.0 ± 0.01 MPa. The agitation is then started at 275 rpm to solubilize the CO2 into the solution at constant pressure
(semi batch mode) during at least one hour. At the beginning of the solubilization process, a temperature increase of the solution was always noted due to CO2 solubilization. The end of the
solubilization process is repaired when the pressure in the gas reservoir reach a constant value (it take about 0.5 hour to reach the solubility equilibrium). Then, the reactor is isolated form the gas reservoir (point C on Figure 3(a))) and cooled to the desired temperature for hydrate formation. The target temperature was the same for all experiments carried out and equals 274.8 ± 0.3 K. At this moment, the system was in the CO2
hydrate stability zone. To drastically reduce the induction time, a small volume of THF (equal to 1.2 ± 0.1 cm3) is injected in-situ and under pressure into the solution by using a syringe pump (point D in Figure 3). This technique has proved to be very efficient and allows forming quasi instantaneously into the bulk a first hydrate which then triggers the formation of the CO2 hydrate.
Details of this procedure have been recently published elsewhere [17].
Then, the reactor pressure decrease until the HLV equilibrium was reached at the target temperature of the experiment (point E in Figure 3), as shown in Figure 3(a) by the perfect match between equilibrium pressure conditions (calculated from CSMGem [18] taking in account the precision of
the target temperature). When the pressure is stable, the temperature is risen back to the initial point to dissociate all the hydrates formed.
Figure 3. Typical experiment (N = 275 rpm, no SDS, initial pressure = 3.0 MPa. (a) evolution of
the reactor pressure (Pr) and the reactor temperature (Tr) versus time. The dashed lines
represent the theoretical equilibrium pressure calculated with CSMGem in respect of the target
temperature precision; (b) hysteresis diagram representing the same experiment in a P-T space.
The CO2 HLV equilibrium was calculated using
CSMGem.
To check reproducibility, the results obtained for
the two experiments carried at these conditions (i.e. N = 275 rpm and no SDS) have been plotted
together on the P-T diagram in Figure 3(b). A very good agreement is shown between these two plots, demonstrating the good reproducibility of the results obtained with this method.
For all the calculations relative to kinetic studies, the number of mole of gas present in the reactor has been calculated by using the Peng-Robinson Equation of State (PR-EoS) [19].
3. RESULTS AND DISCUSSION 3.1. Rheological studies
In our experiments, hydrate volume fractions were between 0 and 15.5 %. The behaviour index for each solid fraction was determined by using the experimental data as described earlier. The evolution of the behaviour index as function of the solid fraction is represented in Figure 4.
Figure 4: Variation of the behaviour index as function of CO2 hydrate volume fraction in the
presence of SDS
As shown in Figure 4, the behaviour index can be represented as function of the solid fraction.
9314
.
0
0108
.
0
+
−
=
sn
φ
(21) wτ
is represented as function ofγ
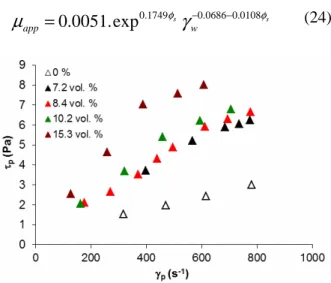
wn in Figure 5 for hydrate fractions between 0-15.5 vol. %. For each solid fraction, the slope of each linear curve represents the consistency index. According to Herschel-Bulkley's model, the yield stress matches the ordinate at the origin.Figure 5:
τ
w as function ofγ
wn for hydrate fractions between 0-15.3 vol. %In Figure 5, the linear curves pass through the origin. Hence the yield stress for CO2 hydrate
slurries in the presence of SDS can be neglected. The consistency index was determined as function of the volume fraction as represented in Figure 6.
Figure 6: Variation of the consistency index as function of CO2 hydrate volume fraction in the
presence of SDS
( s)
k
=
0
.
0051
.
exp
0.1749φ (22)where k is expressed in mPa.sn.
As shown in Figure 4 and Figure 6, the behaviour index decreases with the solid fraction in contrary to the consistency index.
The rheogram for the five different solid volume fractions is represented in Figure 7.
At this stage, the rheological model can be represented by using the Ostwald-de Waele's model between 0-15.5 vol. %.
9314 . 0 0108 . 0 1749 . 0 exp . 0051 . 0 . = − + = s s w n w w k φ φ
γ
γ
τ
(23)The apparent viscosity is expressed as follows in Eq. (24), based on Eq. (23) and Eq. (8).
s s w app φ φ
γ
µ
0.1749 0.06860.0108 exp . 0051 . 0 − − = (24)Figure 7: Rheogram of CO2 hydrate slurries for
hydrate fractions between 0-15.5 vol. % in the presence of SDS
Once again, the viscosity increases with CO2
hydrate fraction. It was 4.2 mPa.s before the formation of CO2 hydrate and varied between
8.7 mPa.s for 7.2 vol. % and 16.8 mPa.s for 15.5 vol. %. The viscosity is low and is totally suitable for cold production and refrigeration applications. The evolution of the apparent viscosity as function of the solid volume fraction is represented in Figure 8.
Figure 8: Evolution of the viscosity of CO2
hydrate slurries as function of the solid fraction in the presence of SDS
The apparent viscosity can thus be expressed as function of CO2 hydrate volume fraction as
described in Eq. (25). 6582 . 3 8035 . 0 + = s app
φ
µ
(25)Afterwards, the experimental values of viscosities were compared to those of the model given in Eq. (23). The results are shown in Figure 9.
Figure 9: Comparison between experimental and model values of viscosity for CO2 hydrate fraction between 0 and 15.5 vol. % in the presence of SDS. As seen in Figure 9, the model represents well the viscosities. It is obvious that the slurry shows a pseudo-plastic behaviour. Furthermore, it is very interesting to compare those data with viscosities coming from literature [20], as seen in Figure 10. The following figure proposes comparisons between various viscosities obtained for CO2
hydrate slurries with and without surfactant [4, 11-13,20]] and for CH4 hydrate slurries calculated
from a Bingham model [21].
Figure 10: Comparison between hydrate viscosities and data coming from literature As shown in Figure 10, for low solid fractions before 10 vol. %, viscosity of CO2-SDS hydrate
slurry is slightly more important than others slurries. We have 4.2 mPa.s before the formation of CO2 hydrate versus 2 mPa.s for other slurries.
Nevertheless, above 10 vol. % viscosity of hydrate slurry with SDS becomes lower than the one of CO2 hydrate slurry without tank. It can be
explained by the anti-agglomerant properties of SDS. It means that SDS avoids formation of hydrate barrier or crust and facilitates the flow. It is also important to note that we have much lower viscosities for slurries with tank. This result can be explained by the pseudo-plastic properties of the hydrate slurries. Indeed, agitation due to the tank increases the shear rate of the flow and according to the pseudo-plastic properties of the hydrate slurries, when the shear rate increases, the viscosity decreases. To conclude, SDS facilitates the slurry flow for high solid fractions.
3.2. Kinetics studies
The effect of SDS on the CO2 hydrate formation
kinetics has been studied through experiments performed with the apparatus described previously in section 2.2, focussing only on the hydrate growth.
As a first attempt to study both the effects of the presence of SDS and the influence of agitation, the set of experiments have been built by combining a high and a low level of each studied variable (i.e. agitation speed N, and the SDS concentration denoted [SDS]): (i) N = 0 and [SDS] = 0 ; (ii) N = 0 and [SDS] = 1700 ppm ; N = 275 RPM and [SDS] = 0, and (iv) N = 275 RPM and [SDS] = 1700 ppm. Note that each experiment presented has been duplicated. However, only one curve per experimental condition was plotted in the following figures for clarity.
For all experiments carried out, the in-situ injection of THF into the bulk allowed forming a first hydrate very easily after the injection. The time to form this first hydrate was always inferior to 1 minute after the THF injection. THF is a well known hydrate promoter: it allows forming hydrates in much less severe conditions than with the gas former itseft (i.e. CO2 here), by shifting the
hydrate equilibrium curve toward lower pressure or higher temperature, and that even with a low THF concentration in water [22]. When the small amount of THF is introduced into the solution (corresponding to a THF bulk concentration of
0.68 wt%), it is very likely that the local THF supersaturation created close to the pure THF liquid jet which penetrates into the bulk is sufficient to trigger the formation of THF-rich hydrates (the formed hydrate quantity is proportional to the volume of THF injected). As CO2 is already present in the bulk, it is logical that
the hydrate formed first was a mixed CO2+THF
hydrate of structure sII [23], where it is assumed here that all the larges cages of (sII) are occupied by THF and a part of the small cages are occupied by CO2.From our observations through the reactor
windows, the THF-rich hydrate is present into the whole bulk, even when there is no mechanical agitation. However, the precise characterisation of this THF-rich hydrate would need further investigations, such as XRD and/or Raman spectroscopy measurements, which are out of the scope of this work.
For the analysis of the results obtained, four additional variables were defined: (i) the total quantity of CO2 enclathrated at the end of the
experiment nCO2fencl ; (ii) the t20 and t90 which
corresponds to the times, from the THF injection (t = 0 in the following figures), when 20% and 90 % of nCO2fencl are enclathrated in hydrates, respectively ; (iii) the ravg being the mean hydrate growth rate, calculated as the ratio between the molar quantity of CO2 enclathrated between t20 and t90 and the duration (t90 - t20) ; and (vi) the water to
hydrates conversion (denoted X) and calculated assuming the CO2 hydrate formula CO2-7.3H2O
[24] and the mixed hydrate THF+CO2 formula
1.3CO2-THF-17H20 [9]. The values obtained for
theses variables are presented in Table 2. [SDS] / ppm N /rpm nCO2 f enc / mol t90 / h ravg /mol.h-1 X / % 1700 275 0.150 2.17 5.15×10⁻² 14.0 0 275 0.145 2.50 4.39×10⁻² 13.6 1700 0 0.155 9.50 2.90×10⁻² 14.4 0 0 0.031 11.67 0.24×10⁻² 3.9
Table 2. Values of the total quantity of CO2
enclathrated at the end of the experiment, the mean hydrate growth rate, the t90, and the water to
hydrate conversion for the experiments carried out.
It is worth noting that for all experiment, the quantity of mixed THF-CO2 hydrate formed
corresponds to a conversion of water to hydrates less than 3 %.
The quantity of CO2 enclathrated in hydrates
versus time, the instantaneous growth rate (dn/dt) versus time, and the values of the apparent rate constant Kapp function of the quantity of CO2
enclathrated are presented in Figure 11, 12 and 13, respectively. The following discussion concerns the results plotted these figures, the results reported in Table 2, and the basis of the kinetics model presented in section 2.2.
0 0.02 0.04 0.06 0.08 0.1 0.12 0.14 0.16 0.18 0 5 10 15 20 time (h) n C O 2 e n c la th ra te d ( m o l) [SDS] = 1700 ppm ; N = 275 rpm [SDS] = 0 ; N = 275 rpm [SDS] = 1700 ppm ; N = 0 [SDS] = 0 ; N = 0
Figure 11. Quantity of CO2 enclathrated in
hydrates versus time.
Following the assumptions of Zhang et al. (2007) [8], from equations (18) and (19), the diffusion coefficient of CO2 in water is less affected by the
presence of SDS [25], and surfactants have little effect on the interfacial mass transfer [26]. As the presence of SDS does not affect the solubility equilibrium [27] of CO2 in water, the Henry
constant is supposed independent of SDS concentration. Therefore, for the same hydrodynamic conditions (e.g. same rotation speed), the thickness of the boundary layer ξ can be assumed to be independent of the SDS concentration. It is worth noting here an important assumption of Englezos’s kinetic model: the fugacity difference and the intrinsic hydrate growth rate are independent of the particle size. First of all, it is obvious that the case where with no agitation and no SDS is the worse situation in terms of efficiency and kinetics, as the quantity of CO2 enclathrated, the water to hydrate conversion
and the mean hydrate growth rate are very low compared to the three other cases. For example, the mean hydrate growth rate ravg is about 20 times lower than the case where only SDS is present, and the conversion X reaches barely 4 % instead of ~ 14 %). 0 0.05 0.1 0.15 0.2 0.25 0 5 10 15 20 time (h) r (m o l/ h ) [SDS] = 1700 ppm ; N = 0 [SDS] = 0 ; N = 275 rpm [SDS] = 1700 ppm ; N = 275 rpm [SDS] = 0 ; N = 0
Figure 12. Instantaneous growth rate versus time.
0 0.02 0.04 0.06 0.08 0.1 0.12 0.14 0.16 0.18 0.2 0 0.05 0.1 0.15 0.2
nCO2 enclathrated (mol)
K a p p ( m o l/ h r. M p a ) [SDS] = 1700 ; N = 275 rpm [SDS] = 0 ; N = 275 rpm [SDS] = 1700 ; N = 0 [SDS] = 0 ; N = 0
Figure 13. Apparent rate constant Kapp versus the
molar quantity of CO2 enclathrated in hydrates
Regarding the two experiments performed under agitation, the presence of SDS has a moderate influence on kinetics: the average growth rate is higher of about 17 % for the case where SDS is present, and it can be noticed that the initial growth rate is slightly superior. The evolution of
Kapp vs. nCO2 shows relative high values just after
the THF injection, and a diminution at the end of the experiment is clearly noticed due principally to the reduction of the driving force as the reactor
pressure tends to reach the hydrate equilibrium pressure. In this case of same hydrodynamics conditions, the increase of Kapp in presence of SDS
can be attributed to both an increase of the interfacial gas-liquid surface as the SDS reduce the CO2-water interfacial tension, and also of the
increase of µ2 (i.e., an increase of the surface area of the hydrate particles). However, the effects of the increase of the gas-liquid interfacial area and of the hydrate surface are confounded in this case and need further complementary experiments to be isolated.
If we compare now, the two experiments with the same SDS concentration (N = 0, and N = 275 rpm, 1700 ppm of SDS), it is obvious that, in spite of a similar water to hydrate conversion, the CO2 is
enclathrated more rapidly (~ 2 times more) in presence of agitation. Both the instantaneous and the mean growth rates are largely superior to the case without agitation. The stirring conditions reduce the thickness of the stagnant film, the diffusional resistance is also reduced, and interfacial mass transfer is enhanced by agitation. In addition, a vigorous agitation induces more hydrate particles in the crystallisation zone leading to an increase of µ2. However, we believe, the major influence on the enhancement of the growth rate in this case is explained by the creation (with the agitation) of a much more interfacial gas-liquid area (compared to quiescent conditions).
The most interesting case is to compare the experiments carried out without agitation and made with a different concentration of SDS. This is obvious that the presence of SDS is very favourable to enhance the crystallisation growth rate, even in quiescent condition. This observation has already been reported in other studies [5, 28, 29]. In these quiescent conditions, we assume that the variables controlling the CO2 diffusion and the
gas-liquid surface area are near identical. If we also assume that the phenomenon of hydrate growth on reactor walls (called “capillary driven mechanism”) can be limited in this case due to the presence of the hydrate-phobic vessel placed inside the reactor, the measured increase of growth rate in presence of SDS could be directly correlated to the increase of µ2. It is worth
reminding that, as µ2 is directly related to the surface area of the hydrate particles. In presence of SDS, the increase of this parameter can be linked
principally to (i) a smaller diameter of the formed hydrate particles resulting to an increase the hydrate surface, and (ii) of the creation of new hydrate particles by nucleation. Although further experiments are needed to separate these two effects, the point (i) is directly related to a possible anti-agglomerant effect of SDS toward CO2
hydrate particles, and this “anti-agglomerant” property was been demonstrated unambiguously by the flow loop experiments presented in the upper section 3.1.
CONCLUSION
It is the first time that the influence of the SDS on CO2 hydrate rheology was studied in a flow loop.
The results obtained have shown that hydrate slurries with SDS have a pseudoplastic behavior for slurries with solid fractions between 0 and 15.5 vol.%. It has been shown that the presence of SDS facilitates the slurry flow for high solid fractions above 10 vol.% with a very slight increase of the viscosity, contrary to others slurries without SDS. Even if, at low solid fractions, viscosity is a bit more important. One important point is that this study brought clear evidences that SDS has an anti-agglomerant effect for the CO2
hydrates.
Concerning the kinetics experiments, the results shows that, at the same SDS concentration used in the flow loop experiments, the presence of SDS improves the hydrate growth rate both in agitated and in quiescent hydrate forming conditions. Interestingly, when the reaction is performed in quiescent conditions, the use of SDS allows converting about the same amount of water into hydrate than in agitated conditions, with a reasonable growth rate but inferior to agitated conditions. The idea of a multiphasic hydrate formation contactor without mechanical agitation could be real advantageous for both reducing operating expenses and improve safety. Finally, the results obtained for hydrate formation kinetics are in agreement with a possible anti- agglomerant effect of SDS for the CO2 hydrate.
Therefore, both the rheological and kinetics results tend to confirm the anti-agglomerant effect of SDS for the CO2 hydrate, and may explain a part of the
action mechanism of this surfactant on hydrates.
To go further, it would be interesting to form CO2
-SDS hydrate slurries with higher solid fractions above 15 vol.% in different systems, with and without tank and to compare the viscosity obtained with others types of hydrate slurries. If the targeted applications also requires forming hydrates at low pressure and/or with short induction times, it could then be possible to combine the SDS to relatively high concentrations of thermodynamic additives such as organic compounds (e.g THF, cyclopentane) and quaternary ammonium or phosphonium salts (e.g. TBAB, TBPB).
ACKNOWLEDGEMENTS
The staff of the « Atelier de Physique » of the University of Pau; V. Cabrol (LGC, Toulouse), S. Labat (IPREM, Pau) and F. Guerton (LFCR, Pau) are thanked for their valuable work and help on the rig. Carnot Institute (ISIFoR) and CG64 (Conseil Général des Pyrénées Atlantiques) are also gratefully acknowledged for partial financial support of this work. ANR is also acknowledged for financial support in the framework of Carnot-Fraunhofer PICF TES-PCS project.
REFERENCES
[1] Fournaison L, Delahaye A, Chatti I, Petitet JP.
CO2 hydrates in refrigeration processes. Ind. Eng.
Chem. Res. 2004;43: 6521-6526.
[2] Marinhas S, Delahaye A, Fournaison L, Dalmazzone D, Furst W, Petitet JP. Modelling of
the available latent heat of a CO2 hydrate slurry in an experimental loop applied to secondary refrigeration. Chem. Eng. and Processing 2006;45:184-192.
[3] Eslamimanesh A, Mohammadi AH, Richon D, Naidoo P, Ramjugernath D. Application of gas
hydrate formation in separation processes: A review of experimental studies. J. Chem.
Thermodyn 2012;46:62-71.
[4] Delahaye A, Fournaison L, Jerbi S, Mayoufi N.
Rheological Properties of CO2 Hydrate Slurry Flow in the Presence of Additives. Ind. Eng.
[5] Ricaurte M, Dicharry C, Renaud X, Torré JP.
Combination of surfactants and organic compounds for boosting CO2 separation from natural gas by clathrate hydrate formation. Fuel
2014;122(15):206-217.
[6] Dicharry C, Duchateau C, Asbaï H, Broseta, D., Torré, JP. Carbon dioxide gas hydrate
crystallization in porous silica gel particles partially saturated with a surfactant solution.
Chem. Eng. Sci. 2013; 98(19): 88-97.
[7] Gayet P, Dicharry C, Marion G, Graciaa A, Lachaise J, Nesterov A. Experimental determination of methane hydrate dissociation curve up to 55 MPa by using a small amount of surfactant as hydrate promoter. Chem. Eng. Sci.
2005;60:5751-5758.
[8] Zhang JS, Lee S, Lee JW. Kinetics of Methane
Hydrate Formation from SDS Solution. Ind. Eng.
Chem. Res. 2007;46 (19):6353–6359.
[9] Torré JP, Ricaurte M, Dicharry C, Broseta D
CO2 Enclathration in the Presence of Water-soluble Hydrate Promoters: Hydrate Phase Equilibria and Kinetic Studies in Quiescent Conditions. Chem. Eng. Sci. 2012;82:1-13.
[10] Torré JP, Dicharry C, Ricaurte M, Daniel-David D, Broseta D. CO2 capture by hydrate formation in quiescent conditions: in search of efficient kinetic additives. Energy Procedia Journal
2011;4:621-628.
[11] Delahaye A, Fournaison L, Marinhas S, Martinez MC. Rheological study of CO2 hydrate
slurry in a dynamic loop applied to secondary refrigeration. Chem. Eng. Sci.
2008;63:3551-3559.
[12] Jerbi S, Delahaye A, Oignet J, Fournaison L, Haberschill P. Rheological properties of CO2 hydrate slurry produced in a stirred tank reactor and a secondary refrigeration loop. International
Journal of Refrigeration 2013;36:1294–1301. [13] Metzner AB, Reed JC. Flow of
non-newtonian fluids—correlation of the laminar, transition, and turbulent-flow regions. AIChE Journal 1955;1:434-440.
Torré JP, Ricaurte M, Dicharry C, Broseta D. CO2 enclathration in the presence of water-soluble hydrate promoters: hydrate phase equilibria and kinetic studies in quiescent conditions. Chem. Eng.
Sci. 2012;82:1-13.
[14] Smith JD, Meuler A; Bralower HL, Venkatesan R, Subramanian S, Cohen RE et al.
Hydrate-phobic surfaces: fundamental studies in clathrate hydrate adhesion reduction. Phys. Chem.
Chem. Phys. 2012;14:6013-6020.
[15] Ribeiro CP, Lage PLC. Modelling of hydrate
formation kinetics: state of the art and future directions. Chem. Eng. Sci. 2008;63:2007-2034.
[16] Englezos P, Dholabhai P, Kapgeralos N, Bishnoi PR. Kinetics of formation of methane and
ethane gas hydrates. Chem. Eng. Sci. 1987;42:
2647-2658.
[17] Ricaurte M, Torré JP, Diaz J, Dicharry C. In-situ injection of THF to trigger gas hydrate crystallization: application to the evaluation of a kinetic hydrate promoter. Chem. Eng. Res. Des.
2014 In press. http://dx.doi.org/10.1016/j.cherd.2013.12.007.
[18] Sloan ED, Koh CA. Clathrate hydrates of
natural gases. 3rd edition. CRC Press, New York, 2008.
[19] Peng DY, Robinson DB. A New
Two-Constant Equation of State. Ind. Eng. Chem.
Fundam 1976;15 (1):59−64.
[20] Thomas DG. Transport characteristics of
suspension: VIII. A note on the viscosity of Newtonian suspensions of uniform spherical particles. Journal of Colloid Science
1965;20:267-277.
[21] Andersson V, Gudmundsson JS. Flow
properties of hydrate-in-water slurries. Annals of
the New York Academy of Sciences 2000;912: 322-329.
[22] Delahaye A, Fournaison L, Marinhas S, Chatti I, Petitet JP, Dalmazzone D, Fürst W. Effect of THF on Equilibrium Pressure and Dissociation Enthalpy of CO2 Hydrates Applied to Secondary Refrigeration. Ind. Eng. Chem. Res. 2006;45:
[23] Shin HJ, Lee YJ, Im YH, Han KW, Lee JW, Lee YJ et al. Thermodynamic stability, spectroscopic identification and cage occupation of binary CO2 clathrate hydrates. Chem. Eng.
Sci. 2009;64:5125-5130.
[24] Uchida T, Hondoh T, Mae S, Kawabata J.
Physical data of CO2 hydrate. Direct Ocean Disposal of Carbon Dioxide. Terra Scientific
Publishing Company, 45-61, 1995.
[25] Caskey JA, Barlage WB. A study of the effects
of soluble surfactants on gas absorption using liquid laminar jets. J. Colloid Interface Sci. 1972;
41:52-62.
[26] Hanwright J, Zhou J, Evans GM, Galvin KP.
Influence of surfactant on gas bubble stability.
Langmuir 2005;21:4912-4920.
[27] Ricaurte M, Torré, JP, Asbai A, Broseta D, , Dicharry C. Experimental Data, Modeling and
Correlation of Carbon Dioxide Solubility in Aqueous Solutions Containing Low Concentrations of Clathrate Hydrate Promoters: Application to CO2-CH4 Gas Mixtures. Ind. Eng.
Chem. Res. 2012;51:3157− 3169.
[28] Zhang J., Lee JW. Enhanced Kinetics of CO2 Hydrate Formation under Static Conditions. Ind.
Eng. Chem. Res. 2009;48(13):5934–5942.
[29] ZareNezhad B, Montazeri V. Development of a high efficient gas to hydrate (GTH) conversion process using SDS kinetic promoter for maximizing the CO2 recovery with minimum
energy consumption. Energy Conversion and Management 2014;79:289-293.