HAL Id: cea-01377054
https://hal-cea.archives-ouvertes.fr/cea-01377054
Submitted on 6 Oct 2016HAL is a multi-disciplinary open access archive for the deposit and dissemination of sci-entific research documents, whether they are pub-lished or not. The documents may come from teaching and research institutions in France or abroad, or from public or private research centers.
L’archive ouverte pluridisciplinaire HAL, est destinée au dépôt et à la diffusion de documents scientifiques de niveau recherche, publiés ou non, émanant des établissements d’enseignement et de recherche français ou étrangers, des laboratoires publics ou privés.
EuNiGe 3 , an anisotropic antiferromagnet
A Maurya, Pierre Bonville, A Thamizhavel, S K Dhar
To cite this version:
A Maurya, Pierre Bonville, A Thamizhavel, S K Dhar. EuNiGe 3 , an anisotropic antiferromagnet. Journal of Physics: Condensed Matter, IOP Publishing, 2014, 26 (21), pp.216001. �10.1088/0953-8984/26/21/216001�. �cea-01377054�
arXiv:1402.0094v1 [cond-mat.str-el] 1 Feb 2014
EuNiGe
3, an anisotropic antiferromagnet
Arvind Maurya,1 P. Bonville,2 A. Thamizhavel,1 and S. K. Dhar1,∗ 1
Department of Condensed Matter Physics and Materials Science, Tata Institute of Fundamental Research,
Homi Bhabha Road, Colaba, Mumbai 400 005, India
2
CEA, Centre d’Etudes de Saclay, DSM/IRAMIS/Service de Physique de I’Etat Condens´e, 91191 Gif-sur-Yvette, France
(Dated: February 4, 2014)
Abstract
Single crystals of EuNiGe3crystallizing in the non-centrosymmetric BaNiSn3-type structure have
been grown using In flux, enabling us to explore the anisotropic magnetic properties which was not
possible with previously reported polycrystalline samples. The EuNiGe3 single crystalline sample
is found to order antiferromagnetically at 13.2 K as revealed from the magnetic susceptibility, heat capacity and electrical resistivity data. The low temperature magnetization M(H) is distinctly different for field parallel to ab-plane and c-axis; the ab-plane magnetization varies nearly lin-early with field before the occurrence of an induced ferromagnetic phase (spin-flip) at 6.2 Tesla; on the other hand M(H) along the c-axis is accompanied by two metamagnetic transitions followed by a spin-flip at 4.1 T. A model including anisotropic exchange and dipole-dipole interactions re-produces the main features of magnetization plots but falls short of full representation. (H,T) phase diagrams have been constructed for the field applied along the principal directions. From
the 151Eu M¨ossbauer spectra, we determine that the 13.2 K transition leads to an
incommensu-rate antiferromagnetic intermediate phase followed by a transition near 10.5 K to a commensuincommensu-rate antiferromagnetic configuration.
PACS numbers: 75.50.Ee, 81.10.Fq, 81.10.-h , 75.30.Gw, 76.80.+y, 75.25.-j, 72.15.Gd
I. INTRODUCTION
Determining the magnetic structure of divalent Eu compounds remains a challenge since neutron diffraction is not easy to perform in such materials due to the large absorption of neutrons by Eu isotopes. One way of obtaining information about the spin arrangement is to perform single crystal magnetization measurements. M¨ossbauer spectroscopy on the isotope 151Eu in polycrystalline samples can also yield information about the
commensura-bility of the magnetic structure with the lattice. Recently, we studied single crystals of two members of the EuMX3 family, where M = Pt and X is Ge or Si,1,2 which crystallize in
the body-centered tetragonal BaNiSn3-type structure which is noncentrosymmetric (space
group I4mm). The properties of a polycrystalline sample of a third compound of the family, EuNiGe3, have recently been reported in the literature.3 EuNiGe3 orders
antiferromagnet-ically at TN=13.6 K. Assuming a collinear A-type antiferromagnetic (AFM) structure in
which ferromagnetic layers of Eu magnetic moments in the ab-plane alternate along the c-axis with AFM coupling, the in-plane J1 and interplane Jc nearest neighbor exchange
integrals were derived in Ref. 3.
In the present work, we report on the synthesis of a single crystal of EuNiGe3. We have
measured the magnetization along the principal directions of the crystal and applied 151Eu
M¨ossbauer spectroscopy to study the hyperfine interaction. The heat capacities in zero and applied magnetic field, electrical resistivity and magnetoresistivity of the single crystal have also been measured. The prominent feature of our data is the magnetization curves at 1.8 K, which are strongly anisotropic, the curve along the [001] crystal axis showing a metamagnetic staircase-like behavior. We present a model, including the dipole-dipole interaction and exchange anisotropy, to interpret these findings.
II. EXPERIMENTAL DETAILS
The single crystal of EuNiGe3 was grown by using a high temperature solution growth
method with In as a solvent. Initially we used Sn flux as it had resulted earlier in the successful growth of the single crystals of EuPtX3 (X = Si or Ge),1,2 but we failed to
obtain the single crystals of the Ni compound. However, we were successful in growing the single crystals of EuNiGe3 from In solvent. Arc melted polycrystalline EuNiGe3 and excess
indium kept inside an alumina crucible were sealed in vacuum inside a quartz ampoule. The temperature of the ampoule was uniformly raised to 1100◦C/h in 24 hours and held at that
value for another 24 hours to ensure homogeneity of the solution. After this a cooling rate of 2◦C/h was employed upto 600◦C followed by relatively faster cooling (60 ◦C/h) to room
temperature. The excess indium flux was removed by centrifugation process. The quality of the single crystals was confirmed by recording the Laue patterns which showed sharp spots conforming to the tetragonal symmetry. A portion of the crystal was powdered for x-ray diffraction; all the peaks of the spectrum could be indexed to the tetragonal structure with space group I4mm (#107). The absence of any extra peaks confirms the phase purity of the grown crystal. The single crystal was cut along the desired directions by electric spark discharge under a suitable dielectric and the orientation of the desired plane(s) confirmed by Laue patterns. Magnetization was measured in a Quantum Design VSM magnetometer, and the heat capacity and electrical resistivity were measured in a Quantum Design PPMS.
151Eu M¨ossbauer spectra were recorded at a few selected temperatures using a constant
acceleration spectrometer with a 151Sm∗F
3 source.
III. RESULTS
A. Magnetic properties
The Rietveld analysis of the powder x-ray diffraction spectrum yielded the lattice pa-rameters a = 0.4338(8) nm and c = 0.9895(9) nm, in good agreement with the previously reported values.
The inverse susceptibility, χ−1, of EuNiGe
3 is practically isotropic above 20 K for the
three directions [100], [110] and [001] of the magnetic field (0.1 T). The high temperature susceptibility and the fit to the Curie-Weiss expression χ = C/(T −θp) in the range
50 - 300 K yields the following results: µeff = 7.89, 7.87 and 7.90 µB/Eu and θp = 3.4, 3.8
and 5.1 K along [100], [110] and [001], respectively. The magnitude of µeff is consistent with
the divalent state of the Eu ions (µeff = 7.94 µB/Eu2+) and the polycrystalline average 4.1 K
of θp is comparable to the value (5 K) reported previously in Ref. 3. A similar situation
of positive θp along [100] and [001] was also encountered in EuPtSi31 which undergoes
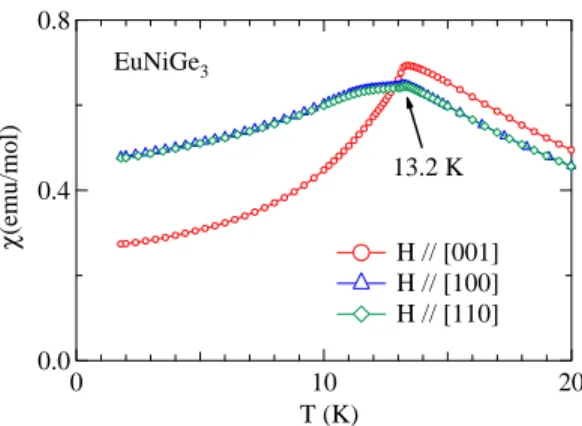
0.8 0.4 0.0 χ (emu/mol) 20 10 0 T (K) H // [001] H // [100] H // [110] EuNiGe3 13.2 K
FIG. 1: (Color online) Low temperature part of the magnetic susceptibility χ=M/H in EuNiGe3
for a field of 0.1 T applied along [001], [100] and [110].
AFM nearest neighbor exchange, J1, and a ferromagnetic (F) next neighbor exchange J2
with J2 > |J1|. The susceptibility M/H below 20 K along the three directions is shown
in Fig. 1. The antiferromagnetic transition is marked by a peak at TN = 13.2 K. The
transition temperature is slightly lower than that reported on the polycrystalline sample. The susceptibility is isotropic in the ab-plane but its magnitude at TN is distinctly higher
for H k [001]. This difference, reflected in the higher value of θp along [001], persists for
T > TN but decreases with temperature and eventually disappears above 45 K. It is due
to the crystal field and exchange anisotropy to be introduced below in section IV. The susceptibility along the c-axis [001] at 1.8 K is 0.27 emu/mol and is field-independent for applied fields of H = 0.005, 0.02 and 0.1 T, in the temperature range below 20 K. The ab-plane susceptibility at 1.8 K in a field of 0.1 T is about twice larger with a value of 0.47 emu/mol. The evolution of magnetic susceptibility of EuNiGe3 with magnetic field
applied along [001] and [100] at low temperatures is shown in Fig. 2. There is a broad hump in the ab-plane susceptibility centered near Tm=10.5 K and the temperature dependent
magnetization shows a field dependence even at low fields (see Fig. 2), unlike the data for H k [001]. However, the field dependence of the susceptibility is seen even for H k [001] at higher fields as inferred from Fig. 2)b. The broad hump is presumably the phase boundary between commensurate and incommensurate modulated antiferromagnetic structures, which is elaborated in the M¨ossbauer spectroscopy section.The TN decreases with increase
in the strength of the magnetic field as expected for an antiferromagnetic compound. Ref. 3 reports a cusp in the susceptibility at 5 K in low fields (< 500 Oe), but such a feature is
0.8 0.6 0.4 χ (emu/mol) 20 10 0 .02 T 1 T 2 T 3 T 4 T 5 T 6 T 6.5 T H // [100] EuNiGe3 1.0 0.5 0.0 χ (emu/mol) 20 10 0 T (K) .02 T 1.5 T 2 T 2.5 T 3 T 3.5 T 4 T 5 T H // [001] EuNiGe3 (a) (b)
FIG. 2: (Color online) Low temperature susceptibility for (a) H k [100] and (b) H k [001] in
EuNiGe3 for different values of the applied field.
absent from our data.
The magnetization M(H) at 1.8 K along the three directions [100], [110] and [001] is shown in Fig. 3. For H in the ab-plane, M varies almost linearly with the field up to a spin-flip (or saturation) field of 6.2 T, with a slight slope change at 4.6 T. In antiferromagnets, such a response is typically seen when the field lies along a hard axis or inside a hard plane. So the Eu moments of the zero field magnetic structure do not lie in the (ab) plane in EuNiGe3;
they could be perpendicular to this plane. The behavior of the magnetization is much more remarkable when the field is applied along [001]. It first increases linearly with the field, then undergoes a spin-flop like jump at 2 T followed by another spin-flop like feature near 3 T, and by a spin-flip transition at 4.1 T. This suggests that [001] is the easy axis of magnetization. However, the [001] magnetization is not zero below the first spin-flop field of 2 T, indicating that the magnetic structure is more complicated than a simple collinear bipartite AF structure. The saturation magnetization along all the three directions reaches
7 µB/f.u., matching with the theoretical T = 0 spin only moment of Eu2+ (S = 7/2 and
L = 0). The observed difference in spin-flip field values is rather unexpected in a material where crystalline anisotropy is weak, and this behavior could be due to exchange anisotropy or arise from dipole-dipole interactions. In section IV, we present a model which tries to account for this interesting behavior, without full success however. The M(H) curves for H k [001] at selected temperatures are shown in Fig. 4. The staircase like behavior is getting blurred as temperature increases, with decreasing spin-flop fields.
8 4 0 M ( µB /Eu) 7 6 5 4 3 2 1 0 H (T) EuNiGe3 T=1.8K H // [001] H // [100] H // [110]
FIG. 3: (Color online) Isothermal magnetization curves at 1.8 K in EuNiGe3 for field along [100],
[110] and [001].
B. Heat Capacity
The heat capacity between 1.8 and 30 K in zero magnetic field and with a field of 3 T is plotted in Fig. 5. A single sharp peak at 13.2 K in the zero-field data is representative of the AFM transition; a broad anomaly centered around 10.5 K correlates well with the anomaly in the susceptibility for H k [100] observed near the same temperature. The correlation holds in an applied magnetic field as well, at least upto 3 T. For this field value, the narrow peak has shifted down to 11.6 K and the broad anomaly occurs near 8 K. For the sake of comparison, the M/H data measured at the same value of the field for H k [100] are also plotted in Fig. 5. There is a very good correspondence between the two sets of the data. The zero-field 151Eu M¨ossbauer spectra, to be described in section III D, reveal
that the transition at TN=13.2 K leads to an incommensurate (ICM) AFM phase, and that
8 4 0 M ( µB /Eu) 7 6 5 4 3 2 1 0 H (T) EuNiGe3 H // [001] 1.8 K 4 K 8 K 12 K
FIG. 4: (Color online) Magnetization curves along [001] in EuNiGe3 at different temperatures.
transition temperature will be referred to in the following as TIC.
40 20 0 C (J/K-mol) 20 10 0 T (K) 70 60 50 40 χ (10 -2 emu/mol) EuNiGe3 C(T) at 0T C(T) at 3T M/H(T) at 0.1T M/H(T) at 3T H // [100]
FIG. 5: (Color online) Heat capacity (left scale) and magnetic susceptibility (right scale) in
EuNiGe3 for fields of 0 and 3 T. The 3 T heat capacity curve is shifted down by 3 J/mol.K for
clarity.
C. Resistivity and magnetoresistivity
The electrical resistivity ρ(T) of EuNiGe3 with the current density J k [100] in zero field
and for different values of the field applied along [001] is shown in Fig. 6. Qualitatively, its thermal variation is similar to that reported for the polycrystalline sample in Ref. 3, with an anomaly at the AFM transition temperature. The residual resistivity ratio of our single crystal sample, defined as R(300 K)/R(1.8 K), is worth 5.5 and is thus almost an order of magnitude smaller than that of the polycrystal in Ref. 3. The values of R(300 K)/R(≃ TN)
18 15 12 9 ρ ( µΩ -cm) 40 30 20 10 0 T (K) 0 T 1T 2.5T 3T 3.5T 4T 5T 8T I // [100] H // [001] EuNiGe3
FIG. 6: (Color online) Thermal variation of the resistivity in EuNiGe3 for a current along [100]
and various values of the field applied along [001].
are however comparable: 3.5 for the single crystal compared to 7 for the polycrystalline sample. It may be recalled that there is an anomaly near 5 K in the susceptibility of the polycrystalline sample, which is absent in the single crystal. Though the resistivity value at 300 K in the two samples is nearly the same, the polycrystalline sample has a resistivity of 1.5 µΩcm at 1.8 K, compared to 11 µΩcm for the single crystal. In the presence of the
-30 -20 -10 0 10 20 MR (%) 14 12 10 8 6 4 2 0 H (T) 8 4 0 -4 -8 d(MR)/dH 10 5 0 H (T) 2K 2K 4K 8K 12K 20K I // [100] H // [001] EuNiGe3
FIG. 7: (Color online) Magnetoresistance with H k [001] in EuNiGe3 at various temperatures.
The inset shows the field derivative of the MR ratio at 2 K.
magnetic field, the magnetic transition temperature can be easily identified as the resis-tivity decreases rapidly below TN. As seen in Fig. 6, application of a field decreases TN,
which is consistent with the magnetization and the heat capacity data discussed above. At H ≥ 3.5 T the anomaly in the resistivity due to the magnetic transition is no longer discernible. For H ≥ 4 T the resistivity is less than the corresponding zero-field values in
the range 1.8-40 K shown in the figure. Typically the magneto-resistance ratio MR, defined as [R(H)-R(0)]/R(0), of an ordinary polycrystalline metal is positive and of the order of a few %. MR can be appreciable for metals and single crystals with large residual resistivity ratio which is not the case with our sample. A negative MR suggests a magnetic origin
-40 -30 -20 -10 0 10 MR (%) 14 12 10 8 6 4 2 0 H (T) -1.5 -1.0 -0.5 0.0 0.5 d(MR)/dH 15 10 5 0 H (T) 2K 5K 8K 12K 20K I // [100] H // [100] EuNiGe3
FIG. 8: (Color online) Magnetoresistance with H k [100] in EuNiGe3 at various temperatures.
The inset shows the field derivative of the MR ratio at 2 K.
and indicates that short range interactions, suppressed by the field, are present above TN.
At lower fields regions of both positive and negative MR are observed and a monotonically varying behavior is not present. The MR at a few selected temperatures measured up to 14 T is shown in Fig. 7. The field variation of MR is tightly correlated with that of the magnetization for H k [001] at various temperatures (Fig. 4). At 2, 4 and 8 K the sharp, almost vertical upturn in MR occurs at the value of the field where the first metamagnetic transition takes place, 2 T at 1.8 K. The vertical fall in MR occurs at the field where the second metamagnetic transition takes place, i.e near 2.8 T at 1.8 K. The MR at 2 K becomes negative close to 4 T where the magnetization is close to its saturation value and the Eu moments are in the field-induced ferromagnetic state. A negative MR is typically seen in ferromagnets. At 12 K, the MR is initially positive up to about 1.5 T and then becomes negative at higher fields. A spin-flop like behavior is seen in the magnetization at 12 K at around 1.5 T. At a higher temperature of 20 K the MR is negative throughout and smaller in absolute magnitude than at 12 K, signifying the increasing influence of thermally induced scattering on the motion of charge carriers. For H k [100], the MR field variations up to 14 T at 2, 5, 8, 12 and 20 K are shown in Fig. 8. At 2 K, MR is slightly positive up to 5 T and then begins to decrease and becomes negative close to 6 T and remaining so up to 14 T.
20 10 0 -10 MR (%) 14 12 10 8 6 4 2 0 H (T) H // [001] H // [010] I // [100] 2K EuNiGe3
FIG. 9: (Color online) Magnetoresistance ratio at 2 K in EuNiGe3 for H k [100] (right scale) and
H k [001] (left scale)
The sign transition occurs in the field region where the magnetization along [100] shows a minor anomaly followed by the spin-flip transition at 6 T (see Fig. 3). As the temperature increases the field at which the anomaly occurs decreases and the MR also changes sign at lower fields. At 12 and 20 K, the MR is negative in the entire range of applied fields, as expected in the paramagnetic phase under field. Fig. 9 shows a comparison of the MR for H k [001] and [100] at 2 K. For fields exceeding 6 T the MR is comparable along the two directions and hence in conformity with the magnetization data.
From the field and temperature dependence of magnetization and electrical resistance, (H,T) phase diagrams have been constructed for the principal crystallographic directions, which are shown in Fig. 10. It is observed that the boundaries derived from different measurements corroborate each other and the dotted lines are possible extrapolations beyond the measure-ment limits. In the upper panel (H k [001]), three different phases are inferred labeled as AF1, AF2 and AF3 with critical fields of 2, 3 and 4 Tesla, respectively at absolute zero temperature and triple points at (2.6 T, 8 K) and (1.1 T, 12 K). The phase diagram for H k [100] shown in the bottom panel of the Fig 10 is different from that of H k [001]. There are no triple points and the critical fields at absolute zero temperature are realatively higher (5.2 and 6.4 Tesla). The phase boundary between AF1 and AF4 possibly separates the com-mensurate and incomcom-mensurate modulated antiferromagnetic structures as indicated by the M¨ossbauer spectra (see section III D).
5 4 3 2 1 0 H (T ) 15 10 5 0 T(K) H // [001] M vs H M vs T R vs H R vs T AF1 AF2 AF3 PM EuNiGe3 (a) 8 6 4 2 0 H (T ) 15 10 5 0 T (K) AF1 AF4 PM H // [100] M vs H M vs T R vs H R vs T
FIG. 10: (Color online) Magnetic phase diagram of EuNiGe3 for (a) H k [001] and (b) H k [100].
The label PM is for paramagnetic phase, and the labels AF1, AF2 ... for different AFM phases. Lines are guide to the eyes.
D. M¨ossbauer spectroscopy
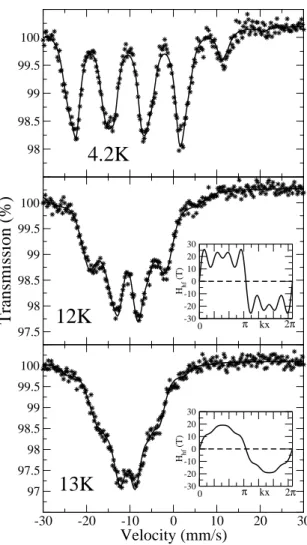
151Eu M¨ossbauer spectra have been recorded at 4.2, 10, 11, 12, 13 and 14 K in EuNiGe 3
(see Fig. 11). The spectra below 10 K show a magnetic hyperfine spectrum due to a single hyperfine field of 30.6(1) T at 4.2 K and 25.7(1) T at 10 K, with an Isomer Shift with respect to Sm∗F
3 of −10.6 mm/s. All these values are characteristic of a divalent Eu ion. Above
10 K and up to 13 K, the spectra change shape and become characteristic of a distribution due to an incommensurate modulation of collinear hyperfine fields.4 At 14 K, the spectrum
is a broad featureless line characteristic of the paramagnetic phase.
This hyperfine field modulation arises from a modulation of moments since the hyperfine field is proportional to the Eu2+ magnetic moment to a good approximation when the
former has the standard value of ≃30 T. The change in spectral shape occurs between 10 and 11 K, and thus we think that it correlates with the broad anomaly in specific heat and susceptibility observed near TIC=10.5 K. The AFM moment modulation along the direction
98 98.5 99 99.5 100 Transmission (%) 97.5 98 98.5 99 99.5 100 -30 -20 -10 0 10 20 30 Velocity (mm/s) 97 97.5 98 98.5 99 99.5 100 kx -30 -20 -10 0 10 20 30 Hhf (T) kx -30 -20 -10 0 10 20 30 Hhf (T)
4.2K
12K
13K
0 π 2π 0 π 2πFIG. 11: (Color online) 151Eu M¨ossbauer absorption spectra at 4.2, 12 and 13 K in EuNiGe
3. For the 4.2 K spectrum, the line is a fit to a single hyperfine field pattern. For the 12 and 13 K spectra, the line is a fit to a distribution of hyperfine fields arising from an incommensurate moment modulation. The insets show the corresponding hyperfine field modulations.
of the propagation vector k was described by the expression:
m(kx) =
4
X
l=0
m2l+1sin (2l + 1)kx (1)
where the mn are the odd Fourier coefficients of the modulation and are fitted to the shape
of the spectrum. The shape of the modulation is represented in the insets of Fig. 11. It tends to a sine-wave shape close to TN and squares up when approaching TIC. The
situation in EuNiGe3 is therefore similar to that in EuPtSi31, where a cascade of transitions
difference is that the specific heat anomaly marking the transition to the commensurate AFM phase is much sharper in EuPtSi3 than in EuNiGe3. One can also notice that the
presence of an ICM phase just below TN in the EuMT3 series seems to be correlated with
the presence of anisotropy: in EuPtGe3, where the magnetisation is rather isotropic, no ICM
phase is present.2
IV. MODEL FOR COMPUTING THE SINGLE CRYSTAL MAGNETIZATION
In the centered tetragonal lattice of the Eu2+ ions (without however inversion symmetry
due to different arrangements of the Ni and Ge ions above and below a given plane), one can consider three exchange integrals: nearest neighbour intra-plane integral J1 (ion
sep-aration a), nearest neighbour interplane integral Jc (ion separation 1/2 √(c2+ 2a2), both
considered in Ref. 3 and using the notations therein, to which one can add a next-nearest neighbour integral J2 between ions in two non-adjacent planes (ion separation c).5 With
the lattice parameters in EuNiGe3, these ion separations are respectively about 0.43 nm,
0.6 nm and 1 nm. Thus we restrict ourselves to exchange J1 and Jc, and neglect J2 since the
corresponding ion separation is much larger. According to the relative signs and magnitudes of J1 and Jc (our convention is a negative integral corresponds to an AFM interaction), the
two simplest AFM structures are:
(i) ferromagnetic (ab) planes with alternating moment directions along c (S1 structure wih k = [001])
(ii) ferromagnetic stripes along [110] in the (ab) planes with alternating moment directions in parallel stripes (S2 structure with k = [1/2,1/2,0]).
Using the molecular field relations for the N´eel temperature TN and the paramagnetic Curie
temperature θp quoted in Ref. 3:
kBTN = S(S + 1) 3 X j Jij cos φij (2) kBθp = S(S + 1) 3 X j Jij (3)
where ˜J is the exchange tensor, the sum runs over the neighbours of ion i and φij is the
angle between moments at sites i and j, one can obtain the exchange integrals for each of the magnetic structures S1 and S2. Using an isotropic mean value θp = 4 K and TN= 13 K,
one obtains
1. for structure S1: J1 = 0.40 K and Jc = -0.11 K,
2. for structure S2: J1 = -0.62 K and Jc = 0.40 K.
In order to compute the magnetization, and in view of its anisotropic behavior, one must add two interactions:
(i) the single ion crystalline anisotropy ECF, which is small for Eu2+ but plays a role in
defining the easy plane/axis. Since the local symmetry at the Eu site is tetragonal (4mm), we consider only the leading second order term ECF = DS2z, where D is a parameter and
Oz the local fourfold axis, i.e. the c crystal axis. Usually, |D| amounts to a few 0.05 K. For negative D, the easy axis is the fourfold c axis, while for positive D the ab-plane is the easy plane.
(ii) the standard dipole-dipole interaction Hdip which is taken to be of infinite range (see
Appendix A for details about the summation over lattice sites.6,7) This interaction is also
weak, but it is of the same order as the crystalline anisotropy and must be taken into account. The importance of the dipole-dipole interaction in determining magnetic structures for Gd compounds has been examined, using a different approach, in Ref. 8. An example of magnetization single crystal curves computed with and without the dipolar interaction is provided in Appendix A. The total hamiltonian acting on an Eu ion is thus:
H = DS2
z + gµB H.S− S.
X
j
JijSj + gµB S.Hdip, (4)
where the different terms are, from left to right, the crystal field, the Zeeman interaction (g=2 for Eu2+), the exchange coupling restricted to intra-plane and interplane nearest neighbours,
and the infinite range dipolar interaction with the field Hdip acting on the given ion.
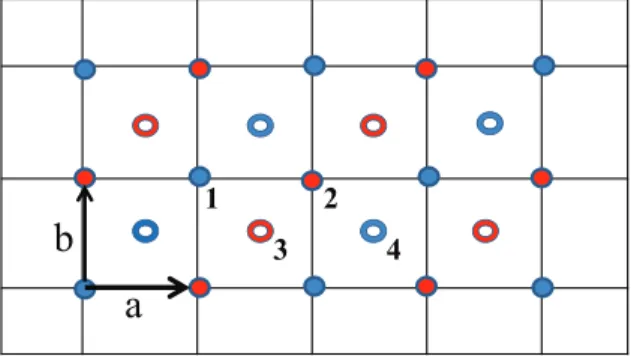
The sublattice decomposition of the zero-field magnetic structure is essential for the cal-culation of the single crystal magnetization. In the absence of knowledge of this magnetic structure, and in order to be able to examine the two simple types of aforementioned struc-tures S1 and S2 with the same formalism, we have used a decomposition into 4 sublattices,
as sketched in Fig. 12. When describing an S1 type structure, sublattices 1 and 2 on the one hand, 3 and 4 on the other hand, are identical. As to the S2 structure, sublattices 1 and 4 on the one hand, 2 and 3 on the other hand, are identical. The computation of the magnetization is performed treating the exchange and dipole-dipole interactions in mean field involving the 4 sublattices, in a self-consistent way. We have first simulated the
a
b
1 2
3 4
FIG. 12: (Color online) Decomposition of the EuNiGe3 tetragonal lattice into 4 sublattices, in
projection onto the (ab) plane. The full circles represent Eu atoms in the z = 0 plane, the open circles those in the z = c/2 plane.
magnetization curves at 1.8 K for the S1 and S2 structures relevant to EuNiGe3 using the
aforementioned exchange integrals. The value of the D parameter was taken negative and adjusted so that the spin-flop field value, for H k [001], be 2 T, as experimentally observed. For the S1 structure, |D| has to be taken rather large lest the structure lies in the (ab) plane, which is an effect of the dipolar field. The calculated magnetization curves along [100] and [001] are represented in Fig. 13. The obtained spin-flip fields along [001] and [100], 3.3 and 4.8 T, respectively, for S1, and close to 4.5 T for S2, do not precisely match the experimental values 4.1 and 6.2 T, respectively (see Fig. 3), and neither the initial non-zero slope of M(H) nor its staircase-like behavior when H k [001] are reproduced. For the S1 case, the large difference in spin-flip fields is due to the large value of |D|.
Another type of possible anisotropy is that of the exchange integrals (see Appendix B for details). In a simple model, we assume that, for each Eu-Eu bond, the symmetric part of the exchange tensor is diagonal and has axial symmetry in a frame linked with the Eu-Eu bond, i.e. it possesses two components Jk and J⊥. Since we consider the nearest
neighbor intraplane and interplane integrals, we introduce the four parameters, J1k, J⊥
1 , J
k c
0 1 2 3 4 5 H (T) 0 2 4 6 8 M ( µB /E u) 0 1 2 3 4 5 6 7 S1 D = -0.32K S2 D=-0.026K [001] [100] [001] [100]
FIG. 13: (Color online) Calculated magnetization curves at 1.8 K for the S1 (planes) and S2 (stripes) structures along [001] and [100] with isotropic exchange and dipolar interaction. The |D| value is more than 10 times larger for S1 than for S2 in order to obtain a spin-flop field of 2 T.
exchange integrals and D value which yields spin-flip field values closer to experiment, and susceptibility curves in reasonable qualitative agreement with the data. These parameter sets are:
1. for the S1 structure: J1k = 0.23 K, J1⊥ = 0.485 K, J k
c = −0.125 K, Jc⊥ = −0.145 K, and
D = −0.06 K,
2. for the S2 structure: J1k = −0.70 K, J1⊥ = −0.64 K, J k
c = 0.45 K, Jc⊥ = 0.36 K, and
D = −0.10 K.
The M(H) and χ(T) curves are the same for both sets; the AFM transition temperature is TN = 14 K and the paramagnetic Curie temperatures are θp[100] = θp[110] = 2.2 K and
θp[001]=5.1 K. The curves corresponding to S1 are shown in Fig.14 and should be compared
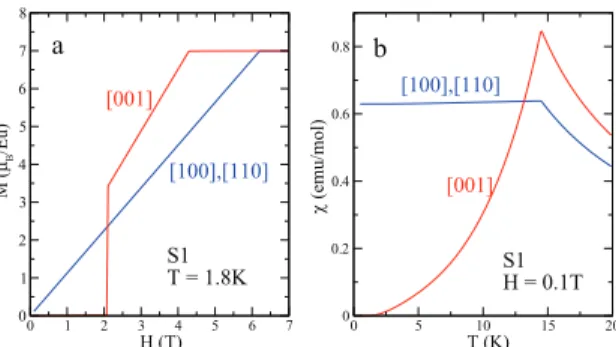
with Figs. 1 and 3. For the S1 structure, with the introduction of exchange anisotropy, one recovers a smaller, hence more physical, |D| value. The calculated values for TN and for
the θp’s are rather close to the experimental values, particularly for H k [001]. The larger
value of θp[001] is an effect of the anisotropy and it is reflected in the larger value of χ(TN)
for this field direction. However, it is still not possible to obtain a non-zero initial slope,
nor a staircase like behavior, for M (H) along [001] since the easy axis in both S1 and S2 structures is the c axis. This suggests that the zero field structure is a “canted” structure, i.e. it possesses a spin component in the (ab) plane, and one must find mechanisms able to induce such a deviation from the easy axis. This is the subject of discussion in the next
0 1 2 3 4 5 6 7 H (T) 0 1 2 3 4 5 6 7 8 M ( µB /E u) 0 5 10 15 20 T (K) 0 0.2 0.4 0.6 0.8 χ (e m u/ m ol ) [001] [100],[110] [001] [100],[110] S1 T = 1.8K S1H = 0.1T a b
FIG. 14: (Color online) Calculated magnetization curves at T = 1.8 K (a) and susceptibility curves at H = 0.1 T (b) for the S1 structure in the presence of exchange anisotropy and dipolar interaction.
section.
V. DISCUSSION
One can readily think of two mechanisms leading to a magnetic structure canted off the c axis. The first one is a crystallographic distortion that would occur in the AFM phase, such that the Eu site no longer has fourfold point symmetry. This would imply a loss of the isotropy of the magnetic properties in the (ab) plane, which contradicts observations since the magnetization and susceptibilty along [100] and [110] are identical. So a low temperature symmetry breaking distortion can be discarded.
The second mechanism is the presence of an asymmetric term of the exchange tensor, namely the Dzyaloshinski-Moriya interaction. It can be seen to be non-zero for the two exchange paths considered here since none of the mid points of the intraplane and interplane exchange bonds is an inversion center for the crystal structure of EuNiGe3. Considering
only nearest neighbour exchange, i.e. intraplane exchange, application of the Moriya rules9
shows that the associated Dzyaloshinski-Moriya vector DDM lies in the (ab) plane and is
perpendicular to the Eu-Eu bond. This can lead to a canted zero field magnetic structure. However, in order to test this hypothesis, a more sophisticated sublattice decomposition is needed, because convergence cannot be reached in our present in-field calculation in the presence of asymmetric exchange. This suggests that the 4 sublattices used here are not adequate to reproduce the actual magnetic structure and its evolution with the field, and one must await the determination of the magnetic structure of EuNiGe3 to check for the
One can also note that the absence of mirror symmetry with respect to the (ab) plane implies that there should be two different interplane nearest neighbour exchange integrals Ju
c and Jcl, according to the upper or lower position of the Eu-Eu bond with respect to the
(ab) plane. This asymmetry is a priori not expected to lead to a transverse spin component since it does not break the fourfold symmetry around the c axis. With our present definition of the 4 sublattices, which are invariant by a translation of vector c, introduction of these different integrals amounts to replacing Jc by (Jcu+ Jcl) and therefore this kind of asymmetry
is not relevant within our model.
Finally, an anisotropic magnetic behavior has also been observed in EuPtSi31 and, for
the case of the other S-state ion Gd3+, in several intermetallics: GdRu
2T2 (T = Ge or Si),10
Gd2PdSi311 and Gd5Ge4,12 where a metamagnetic behavior of the magnetization is reported
along some particular direction. This behavior was attributed in these works to exchange anisotropy.
VI. CONCLUSION
As a conclusion, single crystals of the intermetallic material EuNiGe3 have been
synthe-sized and studied with a variety of techniques: magnetization, specific heat, transport and M¨ossbauer spectroscopy. EuNiGe3 contains divalent Eu, its N´eel temperature is found to
be TN = 13.2 K, in agreement with Ref. 3. The M¨ossbauer spectra show that there occurs
a cascade of transitions, as often observed in intermetallic Eu materials, from paramagnetic to incommensurate AFM to commensurate AFM as temperature decreases. The magne-tization and magnetoresistance in the AFM phase are found to be strongly anisotropic, which is a priori surprising for a spin only ion like Eu2+. In particular, the
magnetiza-tion along the c axis at 2 K shows an unusual staircase-like behavior. With the aim of obtaining the exchange integrals in EuNiGe3, we applied a model with anisotropic exchange
and dipole-dipole interactions which reproduces the main features of the magnetization and susceptibility curves. However, we could not reach a fully satisfying reproduction of the magnetization curves along c, which suggests that the magnetic structure is more complex than the AFM collinear arrangement assumed in our model. To go further, one must await the determination of the magnetic structure by neutron diffraction. We emphasize that the dipole-dipole interaction must be taken into account for a full understanding of the magnetic
structure and its evolution with the applied field in Eu intermetallics.
Appendix A: The dipole-dipole interaction
We show here that it is important to take into account the dipole-dipole interaction in computing the single crystal magnetization curves. Indeed, Eu2+has a rather large saturated
moment (7 µB), and the dipolar field is of the order of 0.05 T. This value is small with respect
to the characteristic exchange fields in EuNiGe3 (a few T), but it is of the same magnitude
as the anisotropy field in Eu2+ compounds. Therefore, it must be taken into account for
determining both the zero field magnetic structure, since it can compete with the crystalline anisotropy in defining the easy magnetic axis, and the low field magnetization since it plays a role in defining the spin-flop field.
In order to obtain the dipolar field on a given Eu2+ ion on a given sublattice, we use the
Ewald summation method to compute the infinite lattice sums6,7, and we write the dipolar
field acting on an ion in the l sublattice as:
Hldip =X
k
Qlk mk (A1)
where the Ql
k matrices contain lattice sums. For instance, the self-sublattice matrix Qll is
diagonal and writes, in units of the Lorentz field parameter HL = 3V4πµB, where V = 2a2c is
the volume of the primitive cell, and a = 0.4388 nm and c = 0.9895 nm:
Qll = 1.7345 0 0 0 1.7345 0 0 0 −0.4690 (A2)
and the matrix Q1
3 writes, in the same units:
Q13 = 0.0620 −0.3822 0 −0.3822 0.0620 0 0 0 2.8760 . (A3)
To illustrate the importance of taking into account the dipolar interaction, we consider the S1 magnetic structure (ferromagnetic planes), with J1 = 0.40 K and Jc = −0.11 K. For
0 1 2 3 4 5 6 H (T) 0 1 2 3 4 5 6 7 8 M ( µB /E u) 0 1 2 3 4 5 6 7 H // [100] H // [001] H // [100] H // [001] a b
FIG. 15: (Color online) Self-consistent computation of the magnetization curves at 1.8 K for J1 =
0.40 K, Jc = −0.11 K and D = −0.32 K, for two directions of the applied magnetic field, in the
absence (a) and in the presence (b) of the dipolar field.
taking into account the dipolar field, the Eu moments lie in the ab-plane until D reaches the rather large value −0.23 K, and there is no spin-flop for H k [001]. For D < −0.23 K, the easy c axis is recovered and a flop occurs for H k [001], and as |D| increases the spin-flop field increases. As an illustration of the importance of the dipole-dipole interaction for the calculation of the magnetization curves, we have represented in Fig. 15 the M(H) curves for the S1 magnetic structure without and with the dipolar field with the same (probably unphysically large) value of the D parameter : D = −0.32 K. In this case, introduction of the dipolar field has the effect of decreasing the spin-flop field, which in turns affects the value of the spin-flip field for H k [001]. With this example, we want to show that the dipolar field should be taken into account for any realistic calculation of the single crystal magnetization in Eu compounds, especially when the ordering temperature is not too high, i.e. the exchange fields are not too large with respect to the dipolar field (≈ 0.05 T).
Appendix B: The anisotropic exchange tensor
We consider a simple implementation of anisotropy of the exchange interaction, by con-sidering that the exchange tensor Jij has axial symmetry in a frame where the Eu-Eu bond
is taken as the z -axis, i.e. it has a longitudinal component Jk and two identical transverse
exchange Hamiltonian writes, in a frame linked with the Eu-Eu bond: Hex = −JαkS z iS z j − J ⊥ α(S x iS x j + S y iS y j). (B1)
For instance, considering the intraplane exchange bond between sublattice 1 and 2 along a (see Fig. 12), the frame Oxyz linked to this bond is taken as: z k a, x k c and y k -b. The diagonal axial exchange tensor with components J⊥
1 and J k
1 is then transformed into
the (abc) frame and, taking into account 4 such intraplane bonds, one obtains the total intraplane exchange matrix between sublattices 1 and 2, or 3 and 4, to which one can add an antisymmetric Dzyaloshinski-Moriya term with vector DDM which lies in the ab-plane
and is perpendicular to the bond:
J1t = 2 J1⊥+ J1k 0 −DDM 0 J⊥ 1 + J k 1 −DDM DDM DDM 2J1⊥ . (B2)
Repeating this procedure for the interplane exchange (without Dzyaloshinski-Moriya term), one finds that the total interplane exchange matrix between sublattices 1 and 3 or 1 and 4, 2 and 3 or 2 and 4, reads:
Jct= 2 Jc⊥+ δ δ 0 δ Jc⊥+ δ 0 0 0 Jck − 2δ , (B3) where δ = Jck−Jc⊥
2+y2 and y = c/a.
∗ Electronic address: [email protected]
1 N. Kumar, S.K. Dhar, A. Thamizhavel, P. Bonville, and P. Manfrinetti, Phys. Rev. B 81, 144414
(2010).
2 N. Kumar, P. K. Das, R. Kulkarni, A. Thamizhavel, S.K. Dhar, and P. Bonville, J. Phys.:
Condens. Matter, 24, 036005 (2012).
3 R.J. Goetsch, V.K. Anand, and D.C. Johnston, Phys. Rev. B, 87, 064406 (2013).
4 P. Bonville, J.A. Hodges, M. Shirakawa, M. Kasaya, D. Schmitt, Eur. Phys. J. B 21, 349 (2001)
6 P. P. Ewald, Ann. Phys. (Leipzig) 64, 253 (1921).
7 Z. Wang, C. Holm, J. Chem. Phys. 115, 6351 (2001).
8 M. Rotter, M. Loewenhaupt, M. Doerr, A. Lindbaum, H. Sassik, K. Ziebeck, B. Beuneu, Phys.
Rev. B 68, 144418 (2003).
9 T. Moriya, Phys. Rev. 12, 91 (1960).
10 A. Garnier, D. Gignoux, D. Schmitt, T. Shigeoka, Physica B 222, 80 (1996).
11 S.R. Saha, H. Sugawara, T.D. Matsuda, H. Sato, R. Mallik, E.V. Sampathkumaran, Phys. Rev.
B 60, 12162 (1999).
12 Z.W. Ouyang, V.K. Pecharsky, K.A. Gschneider Jr., D.L. Schlagel, T.A. Lograsso, Phys. Rev.
![FIG. 2: (Color online) Low temperature susceptibility for (a) H k [100] and (b) H k [001] in EuNiGe 3 for different values of the applied field.](https://thumb-eu.123doks.com/thumbv2/123doknet/13235939.395027/6.918.311.603.114.525/color-online-temperature-susceptibility-eunige-different-values-applied.webp)
![FIG. 7: (Color online) Magnetoresistance with H k [001] in EuNiGe 3 at various temperatures.](https://thumb-eu.123doks.com/thumbv2/123doknet/13235939.395027/9.918.318.602.629.838/fig-color-online-magnetoresistance-h-eunige-various-temperatures.webp)
![FIG. 8: (Color online) Magnetoresistance with H k [100] in EuNiGe 3 at various temperatures.](https://thumb-eu.123doks.com/thumbv2/123doknet/13235939.395027/10.918.313.603.253.461/fig-color-online-magnetoresistance-h-eunige-various-temperatures.webp)
![FIG. 13: (Color online) Calculated magnetization curves at 1.8 K for the S1 (planes) and S2 (stripes) structures along [001] and [100] with isotropic exchange and dipolar interaction](https://thumb-eu.123doks.com/thumbv2/123doknet/13235939.395027/17.918.302.620.107.302/calculated-magnetization-stripes-structures-isotropic-exchange-dipolar-interaction.webp)