HAL Id: hal-03088683
https://hal-ensta-paris.archives-ouvertes.fr//hal-03088683v2
Submitted on 24 Jun 2019
HAL is a multi-disciplinary open access
archive for the deposit and dissemination of
sci-entific research documents, whether they are
pub-lished or not. The documents may come from
teaching and research institutions in France or
abroad, or from public or private research centers.
L’archive ouverte pluridisciplinaire HAL, est
destinée au dépôt et à la diffusion de documents
scientifiques de niveau recherche, publiés ou non,
émanant des établissements d’enseignement et de
recherche français ou étrangers, des laboratoires
publics ou privés.
Observation of large multiple scattering effects in
ultrafast electron diffraction on monocrystalline silicon
Isabel González Vallejo, Geoffrey Gallé, Brice Arnaud, Shelley Scott, Max
Lagally, Davide Boschetto, Pierre-Eugène Coulon, Giancarlo Rizza, Florent
Houdellier, David Le Bolloc’H, et al.
To cite this version:
Isabel González Vallejo, Geoffrey Gallé, Brice Arnaud, Shelley Scott, Max Lagally, et al.. Observation
of large multiple scattering effects in ultrafast electron diffraction on monocrystalline silicon. Physical
Review B, American Physical Society, 2018, 97 (5), pp.54302. �10.1103/PhysRevB.97.054302�.
�hal-03088683v2�
This is the accepted manuscript made available via CHORUS. The article has been
published as:
Observation of large multiple scattering effects in ultrafast
electron diffraction on monocrystalline silicon
Isabel González Vallejo, Geoffrey Gallé, Brice Arnaud, Shelley A. Scott, Max G. Lagally,
Davide Boschetto, Pierre-Eugene Coulon, Giancarlo Rizza, Florent Houdellier, David Le
Bolloc'h, and Jerome Faure
Phys. Rev. B 97, 054302 — Published 1 February 2018
DOI:
10.1103/PhysRevB.97.054302
Observation of large multiple scattering effects
in ultrafast electron diffraction on single crystal silicon
Isabel Gonz´alez Vallejo,1,2 Geoffrey Gall´e,1Brice Arnaud,3Shelley A. Scott,4 Max G. Lagally,4Davide Boschetto,1 Pierre-Eugene Coulon,5 Giancarlo Rizza,5 Florent Houdellier,6 David Le Bolloc’h,2 and Jerome Faure1
1LOA, ENSTA ParisTech, CNRS, Ecole polytechnique, Univ. Paris-Saclay, Palaiseau, France 2LPS, CNRS, Univ. Paris-Sud, Univ. Paris-Saclay, 91405 Orsay, France
3
Institut des Mol´ecules et Mat´eriaux du Mans, UMR CNRS 6283, Le Mans Univ. , 72085 Le Mans, France
4
University of Wisconsin-Madison, Madison, Wisconsin 53706, USA
5LSI, CNRS, CEA-DRF-IRAMIS, Ecole Polytechnique, Univ. Paris-Saclay, Palaiseau, France and 6
CEMES, CNRS, 29 Rue Jeanne Marvig, 31055 Toulouse, France
We report on ultrafast electron diffraction on high quality single crystal silicon. The ultrafast dynamics of the Bragg peaks exhibits a giant photo-induced response which can only be explained in the framework of dynamical diffraction theory, taking into account multiple scattering of the probing electrons in the sample. In particular, we show that lattice heating following photo-excitation can cause an unexpected increase of the Bragg peak intensities, in contradiction with the well-known Debye-Waller effect. We anticipate that multiple scattering should be systematically considered in ultrafast electron diffraction on high quality crystals as it dominates the Bragg peak dynamics. In addition, taking into account multiple scattering effects opens the way to quantitative studies of non-equilibrium dynamics of defects in quasi-perfect crystals.
I. INTRODUCTION
The field of ultrafast dynamics in condensed matter has been very active in the past decades. Its main moti-vation is to gain new insight on the complex interplay be-tween the various degrees of freedom in materials (charge, lattice, spins) directly in the time domain. In particular, ultrafast X-ray diffraction [1, 2] and ultrafast electron diffraction (UED) [3–5] are ideal techniques for obtain-ing valuable information on structural dynamics at the atomic scale. The use of ultrafast electron diffraction in pump-probe experiments has proven to be very efficient for studying the dynamics of photo-induced phase tran-sitions by measuring the relative changes of the diffrac-tion pattern following photo-excitadiffrac-tion [6–10]. Indeed, in the case of a structural phase transition, interpret-ing the dynamics of the diffraction pattern is relatively straightforward: the change in the crystal symmetry can be monitored through the appearance/disappearance of Bragg peaks [7, 10]. However, a wealth of additional information is contained in the diffraction pattern, e.g. lattice heating can be estimated through the change of the Bragg peak intensity due to the Debye-Waller ef-fect. Quantitative analysis mostly relies on the use of kinematical diffraction theory, which assumes that the scattering potential of the crystal lattice is a small per-turbation, so that the probing electrons undergo a single elastic scattering event, leading to a weak diffracted in-tensity compared to the incident electron beam. This theory gives satisfactory results when applied to the case of polycrystalline samples where the grain size is only a few nanometers [10, 11]. It led to quasi-direct mea-surements of the lattice temperature with sub-picosecond resolution in several materials [5, 11]. However, as high quality single crystal samples adapted to UED
experi-ments are becoming available, kinematical theory does not appear sufficient to explain all experimental results. Several UED studies on high quality crystals, such as silicon [12] and graphite [13] have reported large photo-induced changes of the Bragg peak intensity that cannot be explained by kinematical theory. The authors pro-posed that multiple scattering of the electrons must be at play but no quantitative analysis was performed to fully confirm this hypothesis.
In electron microscopy, multiple scattering is taken into account in the framework of dynamical diffraction theory [14, 15]. In high quality crystals, multiple scatter-ing needs to be considered due to the very high elas-tic scattering cross section of electrons. Despite this, little attention has been given to these effects in time-resolved electron diffraction experiments. To our knowl-edge, multiple scattering was considered in detailed only in [16] in a UED experiment in reflexion geometry de-signed to study surface dynamics. In this paper, we show that multiple scattering completely dominates the dy-namics of the diffraction pattern in the commonly used transmission geometry. The experiment is performed on nano-membranes of monocrystalline silicon which is the archetypal example of the perfect single crystal. In ad-dition, the availability of the silicon scattering potential enables a thorough and quantitative comparison between experiment and theory, leading to the unambiguous con-clusion that the observed dynamics is dominated by the photo-induced changes of multiple scattering physics.
II. EXPERIMENTAL METHOD
The electron bunches are first generated by back-illuminating a gold photo-cathode with a λ = 266 nm
2
FIG. 1: Scheme of the experimental setup. The electron beam is generated on the photo-cathode by the third harmonic of the laser and accelerated in the DC gun followed by a solenoid. After a certain time delay the pump arrives on the other side of the sample. The resulting diffraction pattern is detected with an MCP and imaged onto a CCD camera.
ultrashort laser pulse of < 60 fs duration. Electrons are then accelerated in a DC gun, delivering acceler-ating voltages up to 100 keV, and then focused by a solenoid to a spot size of 150 µm Full Width Half Max-imum (FWHM) at the sample position. The charge of the electron bunch beam is < 1 fC resulting in space charge dominated bunches with a transverse coherence length of ∼ 4 nm and < 300 fs duration, as estimated using the GPT code [17]. An scheme of the experimental setup is shown in Fig. 1. Unless stated otherwise, the electron energy is 45 keV. The silicon sample is pumped with a 35 fs pump laser pulse, with λ = 400 nm photons. The incident fluence is 12 ± 1 mJ/cm2, over a 500 µm FWHM laser spot. The diffracted peaks are detected with a MCP detector imaged onto a CCD camera. The experiment is performed at 1 kHz repetition rate and each diffraction image is obtained by accumulating over 5000 pulses. The silicon samples were thinned out from a silicon on insulator wafer [18], resulting in a grid of 350 × 350 µm free standing nano-membranes with [001] orientation. The membrane thickness was measured us-ing convergent beam electron diffraction [19] and esti-mated to be 70 ± 2 nm.
III. RESULTS
We start by reviewing some properties of silicon and its expected dynamical response following photo-excitation. We measured the pump pulse absorption in the sample to be 55 ± 5%. Thus, starting from an incident flu-ence of Finc = 12 mJ/cm
2
, the absorbed fluence is es-timated at Fabs = 6.5 mJ/cm2. The pump laser pulse
causes the excitation of electron-hole pairs and the den-sity of excited electrons in the conduction band is given
by: nexc = Fabs/L~ω, i.e. nexc = 1.8 × 1021cm−3 for
our experimental parameters. Excited carriers thermal-ize via electron-electron scattering on the 100 fs time scale [20] and form two subsystems comprising hot elec-trons and holes. The elecelec-trons (holes) subsequently re-lax to the bottom of the conduction band (top of the valence band) through electron-phonon coupling on a pi-cosecond timescale, causing lattice heating [11, 21]. Us-ing ab initio calculations [22] for determinUs-ing the quasi-particle density of states of the valence and conduction bands [23], as well as the specific heat Cp(T ) of
sil-icon, we were able to determine the lattice tempera-ture after electron relaxation assuming that the num-ber of electron-hole pairs stays constant during this part of the dynamics. This gives a lattice temperature in-crease of ∆T = 240 K. Additional delayed heating oc-curs via electron-hole pair recombination across the gap. At this excitation level, it is well-known that the dom-inant mechanism is Auger recombination [24]. The dy-namics of excited carrier is governed by the following equation dnexc/dt = −(Ce+ Ch)n3exc, where Ce and Ch
are the Auger coefficients for electron and holes respec-tively. Following Dziewior and Schmid [25] , we used
Ce+ Ch = 3.8 × 10⁻³¹ cm6s−1, and we find that 90%
of the Auger recombination has occurred after 40 ps and 94% after 100 ps. Therefore, after 100 ps, we estimate a temperature increase of ∆T = 460 K. At this point, the system reaches a metastable state as heat diffusion occurs on the microsecond time scale for our sample geometry. In kinematical diffraction, lattice heating manifests it-self by the decrease of the Bragg peak intensities accord-ing to the Debye-Waller factor: Ihkl(T ) = Ihkl(0)e−2M,
with 2M = hu2i∆k2
hkl. Here, hu
2i represents the rms dis-placement of atoms around their equilibrium position and ∆khkl= 4π sin θhkl/λ, where λ is the electron de Broglie
wavelength. Using ab initio calculations [22, 23, 26] for estimating the values of hu2i, we find that the (220) peaks should all decrease by 10% after lattice heating is com-pleted: I220(800 K)/I220(300 K) − 1 = 0.9. This scenario and the use of kinematical theory to interpret the de-crease of the Bragg peak intensities was validated in a UED experiment on polycrystalline silicon [11].
We now demonstrate that this interpretation does not hold in the case of high quality single crystals. Typical diffraction patterns from the silicon nano-membranes are shown in Fig. 2. In a), the electron beam is oriented so that it is parallel to the [001] direction: the diffraction pattern is symmetric and the various (220) peaks have similar intensity. The diffracted beam intensities is about one order of magnitude lower compared to the intensity of the transmitted electron beam (referred to as the 0-order beam in the following). In contrast, in b) the sample was tilted along the horizontal axis (represented by the dashed black line) so that the (2-20) peak satisfies the Bragg condition. The diffraction pattern is quite asym-metric and remarkably, the 0-order and the (2-20) peak
3 (2−20) (000) (220) (−220) (2−20) (400) (0−40) (040) (−400) 0 500 1000 1500 2000 (2−20) (000) (220) (−220) (2−20) (400) (0−40) (040) (−400) −20 −10 0 10 20 30 40 50 −0.6 −0.4 −0.2 0 0.2 0.4 time (ps) I/I 0 (2−20) (220) 400 a) b) c)
FIG. 2: a-b): Diffraction images from a [001] oriented sili-con nano-membrane. a) The crystal is oriented such that the electron beam is parallel to the [001] axis. b) The crystal is tilted by the Bragg angle θ220 = 0.84◦ such that the Bragg
condition is satisfied for the (2-20) peak. c) Result of a pump-probe scan showing the relative intensity changes of various Bragg peaks ∆I/I. The incident fluence is 12 mJ/cm2
have similar intensities. This fact clearly contradicts the basic hypothesis of kinematical diffraction theory which states that the diffracted intensity is much lower than the transmitted beam intensity. Fig. 2c shows the dynamics of various Bragg peaks following photo-excitation at in-cident fluence of 12 mJ/cm2. In this case, the sample was oriented so that the (2-20) peak is slightly off Bragg. All Bragg peaks exhibit similar dynamics: the relative inten-sity ∆I/I starts with a sharp decrease on the picosecond time scale. This is followed by a slower roll-off and fur-ther decrease on the 10 ps time scale. According to the above-mentioned scenario, the fast picosecond time scale can be attributed to electron relaxation and lattice heat-ing via electron phonon couplheat-ing while the slower time scale can be attributed to delayed heating due to Auger recombination. After tens of picoseconds, the Bragg peak intensity is relatively flat and a quasi-steady state is es-tablished that lasts hundreds of picoseconds.
These different time scales are consistent with previous results [12], but a truly intriguing feature is the magni-tude of the measured signal: the (2-20) peak decreases by 40% while the 0-order peak increases by nearly 30%. Even more surprisingly, we observed that the dynamics of the Bragg peak is extremely sensitive to sample orien-tation. In Fig. 3, we show the dynamics ∆I/I(t) for the transmitted beam (a) and for the (2-20) peak (b) for five different sample orientations. The results are striking as
−0.6 −0.4 −0.2 0 0.2 0.4 0.6 time (ps) 0 order B B+ B+2 B+3 B+4 −20 −10 0 10 20 30 40 50 −0.6 −0.4 −0.2 0 0.2 0.4 0.6 time (ps) (2−20) peak I/I
FIG. 3: Photo-induced dynamics for various sample orienta-tions. The blue curve is obtained when the sample is exactly at the Bragg angle; the other curves are obtained by tilting the sample by δθ = 0.26◦. The incident fluence is 12 mJ/cm2. Top: dynamics of the transmitted beam. Bottom: dynamics of the (2-20) peak.
a 1◦tilt can turn the intensity change of the (2-20) peak from −40% to almost 60%. Therefore, we not only ob-serve a giant photo-induced response in the Bragg peak intensity but the sign of the response ∆I/I is determined by sample orientation. It is also interesting to note that the 0-order and the (2-20) peak have a complementary behavior, indicating a possible coupling.
These observations are in complete contradiction with the predictions of kinematical theory. In kinematical the-ory, the 0-order should remain unchanged while the all (220) peaks should decrease by less than 10%. Finally, the magnitude of the intensity changes ∆I/I should be independent on sample orientation.
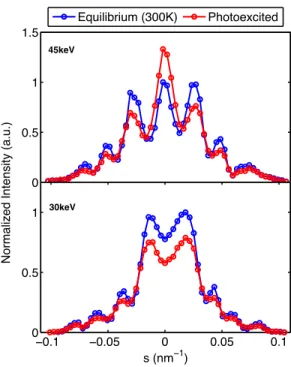
In order to gain further insight on these large changes of intensity, we measured the rocking curves of several diffraction peaks. Figure 4 shows the rocking curve of the (2-20) peak at equilibrium (i.e. at 300 K, blue curves) and in the photo-excited state (red curves) taken 150 ps after the arrival of the pump pulse, i.e. after thermalization of the sample has occurred. Rocking curves are shown at two different electron energies. We plot the Bragg peak intensity I(s), where s is the amplitude of the de-viation vector s = ∆k − g, and g is the lattice reciprocal vector corresponding to the (2-20) peak. Figure 4 clearly shows that the shape and magnitude of the rocking curve changes upon photo-excitation. However, there is no an-gular shift of the rocking curve upon photo excitation, invalidating previous interpretations based on lattice ex-pansion [13] or sample distortion [12]. In addition, the results of Fig. 4 summarize and clarify the surprising fea-tures of Fig. 3: for 45 keV electrons, the intensity change
4
0 0.5 1 1.5
Normalized Intensity (a.u.)
45keV Equilibrium (300K) Photoexcited −0.1 −0.05 0 0.05 0.1 0 0.5 1 s (nm−1) 30keV
FIG. 4: Top: experimental rocking curves for the (2-20) peak taken with 45 keV electrons, at equilibrium T = 300 K (blue curve) and in the photo-excited state (red curve), taken at
t = 150 ps delay. Bottom: same but using 30 keV electrons as
a probe. The rocking curves were normalized relative to the equilibrium case.
is positive at the Bragg angle, whereas it is negative for most off-Bragg cases. For 30 keV electrons, the behav-ior is quite different: here, the intensity change is always negative after photo-excitation. The shape of these rock-ing curves, by departrock-ing from the usual sin2x/x2 line shape of kinematical theory, indicates that dynamical ef-fects are dominating the physics of electron diffraction, even at equilibrium.
IV. DISCUSSION
The fact that the rocking curve changes with temper-ature and electron energy can be understood quantita-tively using a simplified version of dynamical diffraction theory: the 2-beam theory where one considers only the transmitted beam and one diffracted beam with intensity
Ig. In 2-beam theory, the diffracted intensity depends on
the thickness of the sample L and reads
Ig(s, L) = 1 V sin2(seL/2) (seξg)2 (1) where se= q s2+ 1/ξ2
g is the amplitude of the effective
deviation vector and ξg is the extinction distance. The
extinction distance defines the shape of the rocking curve and changes of ξgwill modify the rocking curve.
At T = 0 K, the extinction distance reads ξg= γλ1 π~ 2
meUg
where me is the electron mass, γ = 1 + E/mec2 is the
Lorentz factor of an electron with kinetic energy E. The two beams are coupled through Ug, the Fourier
compo-nent of the crystal potential V (r) corresponding to recip-rocal lattice vector g: V (r) =P
gUgeig·r. Clearly, the
extinction distance depends on electron energy via γλ, explaining why the rocking curve changes with electron energy. The temperature dependence can be accounted for by formally replacing Ug by Uge−M [27].
Conse-quently, the extinction distance increases with temper-ature [28] like ξg(T ) = ξg(0)eM. Evidently, a rise in
temperature causes an increase of ξg, implying changes
of the shape of the rocking curve.
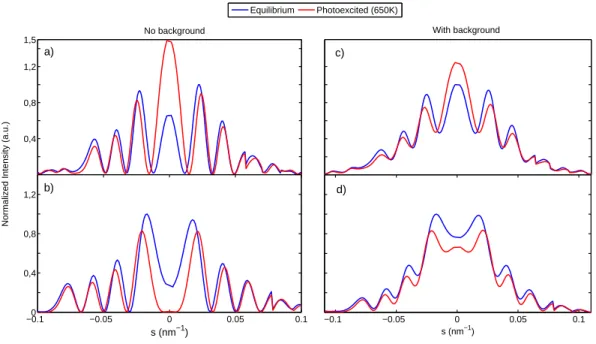
We found that 2-beam theory does not allow us to fit our experimental rocking curves and that additional Bragg peaks need to be taken into account. This is also apparent in the experimental data of Fig. 3: the diffracted intensity is not conserved if one considers only the 0-order and the (2-20) peak, indicating that more diffracted beams need to be considered. Therefore, we turned to a N-beam theory and solved the Howie-Whelan equations [29] ∂φg ∂z = isgφg+ X g06=g i 2ξg−g0 φg0 (2)
Here, φg is the amplitude of the diffraction peak g and
two peaks φgand φg0 are coupled through the extinction
distance ξg−g0 ∝ 1/Ug−g0. Implementing this method
re-quires the detailed knowledge of the scattering potential. Silicon data on the various Ug−g0 was taken from the
code JEMS [30]. In the experiment, we detect 12 diffrac-tion peaks during a rocking curve scan but we found that the N-beam theory converges for N > 24 and we present results with N = 26 (more details can be found in the appendix). Figure 5 a-b) shows the results of the cal-culations for E = 45 keV electrons and 30 keV electrons without considering absorption. The experimental trends are well reproduced: the shapes of the calculated rocking curves are similar to the experimental ones. In partic-ular, the signs of the relative intensity change is repro-duced: ∆I(s = 0)/I > 0 at 45 keV and ∆I(s = 0)/I < 0 at 30 keV. However, the experimental data in Fig.4 dis-plays a large background and the diffracted intensity I(s) oscillates but never cancels to zero, in contradiction with dynamical diffraction calculations. Experimentally, the background can be due to many factors, such as inelas-tic scattering (on phonons, plasmons, defects...), surface contamination or surface amorphization. Because of the difficulty of modeling all these effects, we turn to a phe-nomenological approach and model the background using a simple gaussian distribution. We were able to obtain a quantitative fit of the experimental data using the fol-lowing function:
I(s) = AIdyn+ Be−s
5
Normalized Intensity (a.u.)
Equilibrium Photoexcited (650K) −0.1 −0.05 0 0.05 0.1 s (nm−1) 0,4 0,8 1,2 1,5
Normalized Intensity (a.u.)
−0.10 −0.05 0 0.05 0.1 0,4 0,8 1,2 s (nm−1) a) b)
No background With background
c)
d)
FIG. 5: Results of N-beam dynamical diffraction theory with N = 26 beams: a) calculated rocking curves for the (2-20) peak in the case of 45 keV electrons. The blue curve shows the result at T = 300 K and at T = 650 K (red curve), b) same calculations but with 30 keV electrons. In figures c) and d), a gaussian background that was added to the N-beam calculations in order to better fit the data. The rocking curves are normalized relative to the equilibrium case.
where Idyn is given by dynamical theory (no free
param-eters) and A, B and σ are free parameters allowing us to fit the experimental data more accurately. While N-beam theory reproduces all the trends of the experiment, the data can be even better fitted by adding this gaussian background to the results of the N-beam calculations as shown in Fig. 5 c) and d). The photo-excited state was best fitted considering a T = 650 K temperature. Re-sults are represented by the red curves in Fig. 5, showing excellent agreement with the measurements.
We conclude that the observed dynamics of the Bragg peaks and in particular the behavior of ∆I/I can be fully explained by lattice heating and dynamical diffraction effects. In particular, we obtained the non-intuitive result that depending on the electron energy and the sample orientation, lattice heating can cause an increase of the Bragg peak intensity, contrary to the well-known Debye-Waller effect.
V. CONCLUSION
While this study was performed on silicon, we antici-pate that such effects should be present in all materials provided that the crystal quality is high and the thick-ness comparable with the extinction distance. Indeed, when L 2πξg, multiple scattering can be neglected
and kinematic theory appears to be a valid
approxima-tion. Typical extinction distances are tens of nanometers (2πξ220 = 56 nm for silicon at 45 keV), so that multiple
scattering and dynamical effects have to be considered as soon as the sample thickness is larger than 1-10 nm, de-pending on the material. In conclusion, we have shown that multiple scattering effects play an important role when UED experiments are performed on high quality single crystals, consequently these effects should be al-ways considered. Nonetheless, the quantitative interpre-tation of UED experiments might become quite complex as modeling multiple scattering requires prior knowledge of the crystal scattering potential. Dynamical effects, in turn, could potentially be used to obtain new informa-tion on the dynamics of the crystal potential. Finally, dynamical effects are also useful to visualize crystal de-fects, such as dislocation or stacking faults [15]. There-fore, they should enable a new type of experiments in which the dynamics of defects following laser irradiation can be studied using ultrafast electron imaging.
ACKNOWLEDGMENTS
This work was funded by the European Research Council under Contract No. 306708, ERC Starting Grant FEMTOELEC, by a grant from the “Laboratoire d’Excellence Physics Atoms Light Mater”, LabEx PALM, Contract No. ANR-11-IDEX-0003-02 and
Laserlab-6 Europe (EU-H2020 654148). Fabrication and
characteri-zation of Si nano-membrane samples (S.A.S. and M.G.L.) was supported by the US Department of Energy Grant No. DE-FG0203ER46028.
Appendix: N-BEAM DYNAMICAL DIFFRACTION THEORY
In dynamical theory, the main electron beam diffracts into N −1 diffracted beams because of its interaction with the crystal scattering potentiel. The crystal scattering potential is developed into a Fourier series as
V (r) =X g
Ugeig·r (3)
where g are the lattice reciprocal vectors, and Ugare the
potential Fourier components corresponding to g. The scattered wave function is also written as a Fourier se-ries: |ψi =P
gφg|k + gi, where φg are the amplitude of
the scattered wave in diffraction peak corresponding to vector g. Injecting these expressions into the Shr¨odinger equation and solving in Fourier space, one obtains the Howie-Whelan equations: ∂φg ∂z = isgφg+ X g06=g i 2ξg−g0 φg0 (4)
where sg, the deviation error, depends on the crystal
ori-entation, and ξg−g0 = 1
λ 2~
2
meUg is the extinction distance.
The extinction distance is related to Ug−g0 which causes a
coupling of the two diffracted beams φgand φg0 because
hk + g| ˆV |k + g0i = hk + g|Ug−g0ei(g−g
0)
|k + g0i 6= 0. Note that for a weakly relativistic electron, the effect of the relativistic mass increase can be included simply by replacing me by γme where γ = 1 + E/mec2 is the
electron Lorentz factor. The Howie-Whelan equations describe the evolution of the scattered wave intensities during propagation of the electron into the sample. This system of N coupled differential equations can be written in matrix form:
dΦ
dz = iM Φ (5)
where Φ is a column vector of length N and M is a N ×N matrix that can be decomposed as
M = 0 0 0 . . . 0 sg1 0 · · · 0 0 sg2 · · · .. . ... ... +∆ 0 U−g1 U−g2 U−g3 · · · Ug1 0 Ug1−g2 Ug1−g3 · · · Ug2 Ug2−g1 0 Ug2−g3 · · · .. . ... ... with ∆ = γme 2π~2λ 0 20 40 60 80 100 0 0.2 0.4 0.6 0.8 1 L(nm) I22 0 a) Equilibrium Photoexcited (650K) 20 40 60 80 100 120 140 0 0.5 1 b) E(keV) I22 0
FIG. 6: Results of dynamical diffraction theory including N = 26 beams. a) Intensity of the (220) peak at the Bragg angle,
I220(s = 0) for varying sample thicknesses, assuming 45 keV
electrons. b) Intensity of the (220) peak at the Bragg angle,
I220(s = 0) for varying electron energy, assuming a 70 nm
thickness.
The left matrix is diagonal and its elements are the am-plitudes of the deviation vectors for each diffraction peak
sg−g0. The right matrix is composed of the Fourier
am-plitudes Ug−g0. This is an eigenvalue problem and the
solution is found by diagonalizing matrix M . If D is the diagonal matrix in the basis of eigenvectors and C is the matrix for changing basis, we have M = CDC−1and the solution of the problem is given by
Φ(z) = CeiDzC−1Φ(0)
This general solution allows us to compute the ampli-tude of the various diffracted peaks φg(L) at the output
of the crystal, z = L. This theory can be used pro-vided that the crystal potential V (r) is precisely known. In our case, we extracted the Ug matrix for the silicon
potential from the code JEMS. We modeled the experi-ment assuming a 70 nm thickness and considering N = 26 beams, including all (220), (400), (440), (620) peaks and a few higher order peaks as well. Such a high number of beams was necessary to ensure the convergence in the shape of the (220) rocking curve. Note that there are no free parameters in this model.
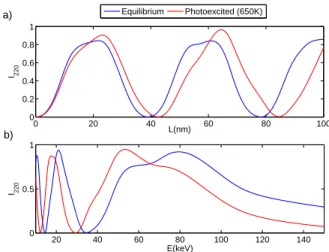
As a complement, we show in fig. 6 different non in-tuitive behaviors of dynamical diffraction effects. Fig-ure 6a) shows the evolution of the (220) peak at the Bragg angle, s = 0, as a function of thickness. The diffracted in-tensity oscillates along propagation in the sample which is one of the main feature of dynamical diffraction. Inter-estingly, the diffracted intensity in the high temperature case (red curve) shows a different behavior, indicating that the relative intensity changes are also expected to change sign depending on the sample thickness. Note that for small thicknesses, one recovers kinematical the-ory and ∆I/I < 0, i.e. the diffracted intensity is smaller
7 in the high temperature case. Figure 6b) shows a
simi-larly complex behavior when the electron energy is var-ied. This indicates that the relative intensity ∆I/I have varying amplitude and sign depending on the energy of the probing electrons. We conclude that the ultrafast re-sponse of the Bragg peak intensity is, in general, greatly dependent on the sample thickness and the electron en-ergy.
[1] D. M. Fritz, D. A. Reis, B. Adams, R. A. Akre, J. Arthur, C. Blome, P. H. Bucksbaum, A. L. Cavalieri, S. Enge-mann, S. Fahy, et al., Science 315, 633 (2007).
[2] R. Mankowsky, A. Subedi, M. F¨orst, S. O. Mariager, M. Chollet, H. T. Lemke, J. S. Robinson, J. M. Glownia, M. P. Minitti, A. Frano, et al., Nature 516, 71 (2014). [3] A. H. Zewail, Annu. Rev. Phys. Chem. 57, 65 (2006). [4] G. Sciaini and R. J. D. Miller, Rep. Prog. Phys. 74,
096101 (2011).
[5] R. J. D. Miller, Science 343, 1108 (2014).
[6] P. Baum, D. S. Yang, and A. H. Zewail, Science 318, 788 (2007).
[7] M. Eichberger, H. Sch¨afer, M. Krumova, M. Beyer, J. Demsar, H. Berger, G. Moriena, G. Sciani, and R. J. D. Miller, Nature 468, 799 (2010).
[8] G. Sciaini, M. Harb, S. G. Kruglik, T. Payer, C. T. Hebeisen, F. M. Heringdorf, M. Yamagushi, M. H. Hoe-gen, R. Ernstorfer, and R. J. D. Miller, Nature 458, 458 (2009).
[9] M. Gao, C. Lu, H. Jean-Ruel, L. C. Liu, A. Marx, K. Onda, S. Koshihara, Y. Nakano, X. Shao, T. Hira-matsu, et al., Nature 496, 343 (2013).
[10] V. R. Morrison, R. P. Chatelain, K. L. Tiwari, A. Hen-daoui, A. Bruh´acs, M. Chaker, and B. J. Siwick, Science 346, 445 (2014).
[11] M. Harb, R. Ernstorfer, T. Dartigalongue, C. T. Hebeisen, R. E. Jordan, and R. J. D. Miller, J. Phys.
Chem. B 110, 25308 (2006).
[12] M. Harb, W. Peng, G. Sciaini, C. T. Hebeisen, R. Ern-storfer, M. A. Eriksson, M. G. Lagally, S. G. Kruglik, and R. J. D. Miller, Phys. Rev. B 79, 094301 (2009). [13] S. Lahme, C. Kealhofer, F. Krausz, and P. Baum, Struc.
Dynam. 1, 034303 (2014).
[14] L. Reimer and H. Kohl, Transmission electron
mi-croscopy (Springer Series in Optical Sciences, New York,
2008).
[15] B. Fultz and J. Howe, Transmission electron microscopy
and diffractometry of materials (Springer Series in
Grad-uate Texts in Physics, Berlin, Heidelberg, 2013). [16] S. Sch¨afer, W. Liang, and A. H. Zewail, J. Chem. Phys.
135, 214201 (2011). [17] www.pulsar.nl/gpt.
[18] S. A. Scott and M. G. Lagally, J. of Phys. D: App. Phys. 40, R75 (2007).
[19] F. S. Allen, Phil. Mag. A 43, 325 (1981).
[20] S. Jeong, H. Zacharias, and J. Bokor, Phys. Rev. B 54, R17300 (1996).
[21] C.V. Shank, R.Yen, and C.Hirlimann, Phys. Rev. Lett. 50, 454 (1983).
[22] X. Gonze, B. Amadon, P. Anglade, J. Beuken, F. Bot-tin, P. Boulanger, F. Bruneval, D. Caliste, R. Caracas, M. Cˆot´e, et al., Computer Physics Communications 180, 2582 (2009).
[23] B. Arnaud, S. Leb`egue, and M. Alouani, Phys. Rev. B 71, 035308 (2005).
[24] A. Richter, S.W. Glunz, F. Werner, J. Schmidt, and A. Cuevas, Phys. Rev. B 86, 165202 (2012).
[25] J.Dziewior and W. Schmid, Appl. Phys. Lett. 31, 346 (1977).
[26] C. Lee and X. Gonze, Phys. Rev. B 51, 8610 (1995). [27] S. Takagi, J. Phys. Soc. Japan 13, 278 (1958).
[28] G. Thomas and E.Levine, Phys. Stat. Sol 11, 81 (1965). [29] A. Howie and M. J. Whelan, Proc. R. Soc. Lond. A 263,
217 (1961).
[30] P. A. Stadelmann, JEMS-EMS java version (2004), URL www.jems-saas.ch.

![FIG. 2: a-b): Diffraction images from a [001] oriented sili- sili-con nano-membrane. a) The crystal is oriented such that the electron beam is parallel to the [001] axis](https://thumb-eu.123doks.com/thumbv2/123doknet/13130673.388031/5.918.490.830.77.380/diffraction-images-oriented-membrane-crystal-oriented-electron-parallel.webp)