HAL Id: hal-02993106
https://hal.archives-ouvertes.fr/hal-02993106
Submitted on 30 Nov 2020HAL is a multi-disciplinary open access archive for the deposit and dissemination of sci-entific research documents, whether they are pub-lished or not. The documents may come from teaching and research institutions in France or abroad, or from public or private research centers.
L’archive ouverte pluridisciplinaire HAL, est destinée au dépôt et à la diffusion de documents scientifiques de niveau recherche, publiés ou non, émanant des établissements d’enseignement et de recherche français ou étrangers, des laboratoires publics ou privés.
Physical and chemical characterization of shock-induced
cavitation
Laureanne Parizot, Hugo Dutilleul, Maria-Elena Galvez, Tony Chave, Patrick
da Costa, Sergey I. Nikitenko
To cite this version:
Laureanne Parizot, Hugo Dutilleul, Maria-Elena Galvez, Tony Chave, Patrick da Costa, et al.. Physical and chemical characterization of shock-induced cavitation. Ultrasonics Sonochemistry, Elsevier, 2020, 69, pp.105270. �10.1016/j.ultsonch.2020.105270�. �hal-02993106�
Physical and chemical characterization of shock-induced cavitation
Laureanne Parizota,b, Hugo Dutilleula, Maria-Elena Galveza, Tony Chaveb, Patrick Da Costaa*, Sergey
I. Nikitenkob*
a Sorbonne Université, Jean Le Rond D’Alembert Institute, CNRS UMR 7190, 2 place de la gare de
ceinture, 78210 Saint Cyr L’Ecole, France
b ICSM, Univ Montpellier, UMR 5257, CEA-CNRS-UM-ENSCM, Marcoule, France
*Corresponding authors: patrick.da_costa@sorbonne-universite.fr ;serguei.nikitenko@cea.fr
Abstract
A strong impact on a water surface induces a shock wave propagation with a significant pressure variation leading to cavitation bubble formation. A new shock induced cavitation reactor described in this work was characterized by physical and chemical techniques. Water hammer model verification with Joukowsky approach allowed to determine the wave speed propagation and gas fraction in water submitted to shock. These values were used for frequency analysis and compared with direct bubble visualization in order to estimate the influence of the experimental parameters on the shock-induced cavitation. Thereby, the shock wave contains a broad spectrum as decomposed into frequencies. This multi-frequency nature induces heterogeneous bubbles with calculated radii of 0.01 to 3.5 mm and observed radii of 0.01 to 2.8 mm depending on experimental conditions (initial pressure, impact height, gas atmosphere). For the first time, the formation of hydroxyl radicals was proven under impact-induced cavitation. The concentration of radicals increases with increasing number of successive impacts, reaching ca. 1.3 µmol.L-1 after 500 impacts in the presence of 20% O
2-Ar as saturating gas. Radical
generation seems to be relatively independent of the impact height but strongly depend on the type of gas saturating water, being substantially lower in the presence of air. Moreover, radical generation increases when decreasing the initial pressure and depends on the frequency at which water is impacted by the piston. Nevertheless, yield of OH radicals during shock-induced cavitation remains much lower than that produced by power ultrasound.
1. Introduction
Pressure gradient in fluids may produce cavitation, which is generally described as a formation, growth and transient implosive collapse of the gas and vapor filled microbubbles [1]. The physical and chemical effects of cavitation are interesting for multiple applications [2]. Shock waves and micro jets produced by bubble collapse lead to disaggregation of powdered solids, surface erosion and micro-deformation, and depassivation of metals as well [3]. Violent collapse yields nonequilibrium plasma inside the bubble [4] which emits the light, called sonoluminescence [5], and generates chemically reactive species [6,7]. The latter phenomenon is directly linked to the sonolysis of water molecules inside the cavitation bubbles. In this sense, cavitation is promising for the development of advanced oxidation processes for liquid waste management without the addition of any chemical product [8–12]. Cavitation and its consequences have been widely studied in the last decades. Though hydrodynamic cavitation was discovered first, cavitation bubbles are also produced commonly by power ultrasound, generated by piezoelectric transducers or magnetostrictors. Ultrasonically induced cavitation has found practical application in many industrial processes [13–17]. Cavitation can be moreover induced upon high intensity light irradiation or upon electrolysis, what has been very useful for studying single bubble phenomena and for understanding the fundamentals of bubble dynamics[18–20].
This paper focuses on much less studied cavitation produced by shock waves in solutions. Indeed, shock-induced cavitation is a relatively recent innovation. To the best of our knowledge only few studies of shock-induced cavitation have been reported so far [21,22]. Bubble formation and collapse upon the impact of a piston on a liquid surface were recently evidenced, as well as its contribution to the acceleration of oxidation reactions [23,24]. The impact of the piston generates a trail of shockwaves that propagates within the bulk of the liquid, inducing pressure variations that result in the formation of cavitation bubbles. The pressure profile is similar to the one obtained by lithotripsy, with a high pressure followed by a rarefaction [25]. Then, both phenomenon might have some properties in common [26– 28]. It was reported recently that shock-induced cavitation can be accurately described by the water
hammer model [29,30] (i.e. the Joukowsky equation [31]) and, contrary to ultrasonic cavitation, the shock wave propagated in liquid phase has multiple frequencies [23]. On the other hand, chemical effects of shock-induced cavitation have never been studied up to date. The occurrence and intensity of shock-induced cavitation seemed so far to strongly depend on many experimental parameters, but no quantitative analysis was performed either on the physical or on the chemical consequences of this type of cavitation. In order to potentially apply this type of cavitation to wastewater remediation, similarly than when using ultrasounds, further insight needs to be gained, particularly concerning the formation of radical or oxidant species in water. Moreover, there is a lack of information regarding the amount of energy provided in shock-induced cavitation, this being of key importance when comparing this impact-induced process to ultrasonic sonochemistry. Then, more detailed physico-chemical characterizations of this phenomenon are required. This work focuses on the multiparametric study of shock-wave induced cavitation by the impact of a piston on the water contained in a cylindrical reactor. The impact and resulting shock wave features were further studied from a physical point of view, considering a modified water hammer model as well as through the visualization and determination of bubble occurrence and size. The quantification of the chemical species was performed using analytical dosimetry techniques currently used in ultrasound sonochemistry.
2. Materials and methods
2.1 Shock-induced cavitation experimental setup
Designed shock-induced cavitation reactor used in this study was composed of a stainless-steel piston (7,8 cm2 surface, 0,6 kg weight) operated by an electrical engine that delivers a rotation
movement, raising and letting it fall on the liquid surface (Fig. 1). Then, the piston movement into the created space is accelerated by gravity and by outside air pressure. In these conditions, the impact piston is highly strong and induces a shock wave which creates cavitation bubble during its propagation. Piston bounces can be observed depending on the impact force due to water being nearly incompressible and the resulting non-elastic mechanical shock force resultant [32].
Fig. 1. Motorized piston system used in the shocked-induced cavitation experiments.
The frequency (0 to 1.5 Hz) and the number of impacts was settled via a Matlab code piloting a Red Pitaya interface. The height of impact (8 to 20 mm) depends on the volume of liquid contained in a stainless-steel cylindrical reactor (75 mm diameter, 13 mm thickness, 200 mm height). A PMMA reactor, having the same dimensions, was used for bubble visualization experiments. This visualization was performed with the aid of a CDD camera (Phantom V711). The initial pressure was fixed (20-80 mbar) using a vacuum pump and a regulation valve. Pressure target was established either at the beginning of each experimental run or maintained all through the experiment (continuous vacuum conditions, when indicated). Static pressure measurements were performed by a piezoelectric sensor (Kistler 601H, connected to a 5018A amplifier), placed at the bottom of the reactor. Piston position was monitored using a linear transducer (Gefran, type PC). All signals were acquired and recorded using the Red Pitaya interface (16 386 data acquisition) compiled and triggered by a Matlab code or by an oscilloscope (MSO7054A of Keysight-Agilent, 500 000 data acquisition). Gas atmosphere was controlled by sparging at 100 mL.min-1, inside the liquid contained in the reactor from the bottom or
from the middle part of the reactor, during 15 min before each experiment. During impact treatment, dissolved gas content was self-adjusting as impact series couldn’t be interrupted to maintained the settled impact frequency. When a continuous vacuum was applied, gas atmosphere was modified. In order to adjusted gas atmosphere, a 5 min sparging was achieved every 100 impacts. Initial conditions were checked thank to impact pressure measurement and physical characterization. Liquid samples were
taken at positions of gas inlet. No gas sparging was achieved in the experiments performed under air atmosphere. Overall scheme of the reactor is shown in Fig 2.
Fig. 2. Diagram of shock-induced cavitation reactor.
2.2 Reagents
2-Hydroxyterephthalic acid (97%, Sigma Aldrich), terephthalic acid (99%, Acros Organics), NaOH (98% Alfa Aesar), KH2PO4 (99%, Sigma Aldrich), Na2HPO4 (99%, Sigma Aldrich) were used as
received without further purification. All solutions were prepared with commercial demineralized water (<10 μS.cm-1 at 20°C). Ar/O
2 gas mixture with 20 vol.% of O2, Ar of 99.999% purity and O2 99.999%
purity were supplied by Air Liquide.
2.3 Data treatment
Static pressure and piston position data treatment was achieved using different Matlab codes. The signals were smoothed using a moving average algorithm. The parameters of this algorithm were chosen according to the type of analysis performed: an average step was set at 10 points for frequency analysis
90 mm 75 mm
200 mm
Red Pitaya Computer Position sensor
Electrical engine
Gas or sample taking Outside (solution insertion and
atmosphere pressure) Vacuum pump Pressure regulator Manometer Pressure sensor Gas Liquid
and at 200 points for maximum pressure and position study. The images of water submitted to the impacts were obtained with Phantom V711 camera and processed using as well a Matlab code yielding bubble size histograms for each image treated. This Matlab code runs a binarization with background subtraction and a gain for each frame, before using a circle detection function to save radius and position for each detected bubble. Bubble’s formation was visually verified by drawing a circle on the original pictures representing bubbles with each obtained radii and position. Then, this method was used to determine the best binarization threshold and sensitivity setting detecting all bubbles in the obtained images.
2.4 Chemical dosimetry
The concentration of OH radicals formed during impact cavitation was determined using terephtalic acid dosimetry, as describe by Iida et al. [33]. The initial solution was prepared as follows: 332 mg of terephtalic acid was dissolved under mechanical stirring at ambient temperature in a 500 mL buffer solution prepared with 200 mg of NaOH, 590 mg of KH2PO4 and 980 mg of Na2HPO4 dissolved in
demineralized water. Once the solution is homogenized, dilution was completed with demineralized water until 1 L. This solution was directly introduced into the shock-induced cavitation reactor and subsequently submitted to a series of impacts. It is well known that terephtalic acid reacts selectively with OH radicals producing fluorescing 2-hydroxyterephtalic acid [13]. A Fluoromax-4 with a Horiba Nanoled laser (Jobin Yvon) was used with a 3 mm slit width and a 315 nm excitation wavelength to observe an emission at 425 nm for each sample analyzed. The detection limit of 2-hydroxyterephtalic acid (OH radicals) was 10-10 mol.L-1, whereas the measurement error was calculated at 6.10-9 mol.L-1 of
terephthalic acid, after a comparative study considering several calibration plots in our conditions.
3. Results and discussion
3.1 Parameters study and water hammer model
Several modifications were introduced to the studied shock-induced reactor compared to the previously studied setups [23,24]. Therefore, the influence of the different operating parameters and
water hammer model was first checked in order to validate that both apparatus have a similar response to the experimental conditions and to anticipate the impact effects. Indeed, water hammer model is a simple way to define the proprieties of this system for a better comprehension. The verification that the impact was adequately represented by the water hammer model consist in the evaluation of the initial pressure (20, 40, 60 and 80 mbar) and impact height (from 8mm to 19mm). Each experimental condition was tested for 15 successive impacts in order to average pressure and velocity results. Measurement error was estimated at 20% by this method. The piston velocity was obtained from the position derivative of its position at each time.
Plotting the maximal pressure at the impact versus the impact height for different initial pressures (Fig. 3 (a)) evidences a linear relationship between these parameters depending on the initial pressure in the cavitation reaction. At low initial pressures, i.e. 20 mbar, a stronger influence of piston height on the impact pressure can be observed, whereas at higher pressures, i.e. 80 bar, the impact pressure is not as importantly influenced by the piston height. Indeed, the slope of each plot in Fig. 3(a) varies also linearly with the initial pressure in the reactor (Fig. 3(b)). In this way, the peak pressure at the impact can be easily predicted using these linear trends. This is clear that initial pressure and impact height have a big influence on impact intensity. A light variation of initial pressure could decrease drastically impact pressure meaning probably that the rest of gas between piston and water surface limit the energy transfer from the piston to the water column by its resistance.
Fig. 3. (a) Dependence of impact pressure 𝑃𝑖𝑚𝑝 on impact height ℎ and (b) linear relationship between the slope of the pressure vs. height curves and initial pressure 𝑃𝑖.
Otherwise, the piston velocity is principally influenced by impact height, as shown in Fig.S1. The initial pressure variation does not seem to importantly influence the piston velocity, considering the experimental error. Since the initial pressure inside the reactor varies from 20 mbar to 80 mbar here, the pressure force on the outer surface of the piston, exposed to atmospheric pressure, is always more important than the one on the inner surface (with a pressure variation of maximum 8%for each experimental condition). Some friction force depending on the piston position may occurs in the reactor as a simple free fall fit without friction force can’t match with experimental results neither if a constant force of 340 N based on experimental results is considered (Fig. S1.).
As the maximal pressure attained at the instant of the impact depends linearly on the impact height (Fig. 3), plotting the impact pressure against the piston speed (Fig. S2) further evidences a linear relationship between these two parameters. This is in complete agreement with the predictions based on the water hammer model, as observed previously for other similar shock-induced cavitation setups [23,24]. The water hammer phenomenon is indeed the hydraulic shock that occurs when a fluid in motion is suddenly forced either to stop or to modify its direction. This shock results in a pressure surge, noise and, sometimes, in the formation of cavitation bubbles. In industry, this shock can be provoked by opening or closing a valve, by starting/stopping a pump, or in the feeder pipe elbows [30]. The force
balance corresponding to the impact of a solid piston on the surface of a static fluid is analogous to the case of a moving fluid suffering an hydraulic shock, and can be therefore described using the Joukowsky equation [31]:
∆𝑃 = 𝜌 𝑐 ∆𝑣 (1)
where ∆𝑃 = 𝑃𝑖𝑚𝑝− 𝑃𝑖 ≈ 𝑃𝑖𝑚𝑝, since 𝑃𝑖 (initial pressure) can be neglected in front of 𝑃𝑖𝑚𝑝 (impact pressure, in Pa), 𝜌 is fluid density (kg/m3), c is the shockwave celerity in the fluid (m/s), and ∆𝑣 = 𝑣 −
0 = 𝑣, the piston velocity (m/s).
This simple model highlights the possible influence of initial parameters on the shock wave celerity at the impact time. Indeed, the linear relation, in Fig. S2, means that the slope 𝜌 𝑐 could be a constant for each initial pressure indicating that the variation of liquid/gas ratio with initial pressure should be taken into account. Considering a constant density 𝜌 = 1000 kg/m3 for water, as the gas amount
in our conditions is very low, the shock-wave celerity 𝑐 can be calculated from the value of each slope. The celerity values calculated are 1177 m/s for 20 mbar, 913 m/s for 40 mbar, 603 m/s for 60 mbar and 374 m/s for 80 mbar. These estimations are consistent with speed of sound propagation in water (1500 m/s) and in air (340 m/s). Shock wave celerity should indeed be highly influenced by the gas layer between piston and water during impacts. This means that at higher initial pressures, i.e. 80 mbar, the volume of air/vapor in contact with the liquid surface is more important that at lower initial pressures, i.e. 20 mbar. At the impact, this volume is violently compressed and mixed with the liquid water inside the reactor, generating a gas-liquid mixture that contains more and more gas as the initial pressure increases. Therefore, as this initial pressure increases, the celerity of the shockwave generated upon the impact gets closer to sound speed in air. Moreover, sound celerity is similarly influenced by gas fraction in a liquid/gas system as shown in Fig. S3 reproduced from Werner Kieffer et. al. [34] and plots sound celerity in an air/water mixture depending on air fraction for various ambient pressure. Each estimated wave celerity shown in Fig. S3 corresponds to an air fraction from 0.05% to 1% depending on impact pressure. These results are consistent since an impact pressure increase corresponds to an impact height
increase for a same initial pressure. As impact height determines the introduced gas volume, it settles also initial void fraction.
Related density for each impact gas fraction was calculated from Fig. S3 and indexed in Table S1. As expected, density decreases with impact pressure increase and hence with impact height. Density adjustments in 𝜌 𝑐 does not significantly influence shock wave celerity. It is worth noting that a minimal variation of gas fraction could change significantly shock wave propagation due to the wave reflections on the gas/liquid interface [18]. It means that impact intensity is probably not the only factor which could influence shock wave propagation effect as cavitation. In this work, we considered water hammer model that reveals a possible shock wave celerity influence but a better understanding should be possible with a complete Rayleigh equation study.
3.2 Pressure signals and bubble size relation
Hypothesis that shock-induced wave has multiple frequencies was already verified with a wavelet transformation of pressure signals in previous studies [23,24]. In this work, a diagram of frequency distribution was obtained and reveals frequency from 0.1 to 100 kHz limited by used pressure sensor. Multiple frequency means the shock contains a broad spectrum decomposed into frequencies representing various excitation level in water which could eventually produce cavitation bubble according to Minnaert equation (a simplification from Rayleigh-Plesset equation for the dynamic of cavitation bubble [35]): 𝜔𝑁 = [ 3𝑘(𝑃̅̅̅̅ − 𝑃∞ 𝑣) 𝜌𝐿𝑅𝐸2 ] 1 2 (2)
where 𝜔𝑁 is the natural frequency (kHz), 𝑘 is the polytropic exponent (dimensionless), 𝑃∞(𝑡) represents fluid pressure at infinity distance from bubble (Pa), 𝑃𝑣 the steam pressure (Pa), 𝜌𝐿 is liquid density near bubble (kg.m-3) and 𝑅
𝐸 the excitation bubble radius (m).
Wavelet transformation was also studied for the new shock-induced motorized reactor and Minnaert equation was applied on the obtained frequency distribution to estimate probable excitation
bubble radii [36]. The Haar wavelet, which transform signals in a square fit, was used to do the wavelet transformation here [37]. An example of this transformation was given in Fig. S4. Motorized reactor frequency range was larger than the previous reactor operated by electromagnet due to a different smoothing treatment and sensor resonance frequency involves a signal saturation at 250 kHz. Yellow color indicates a strong intensity of frequencies and reveals that shock wave delivers mostly low frequencies less than 10 kHz. High frequency apparition is not homogeneous during shock wave propagation but all signals, regardless initial parameter setting, show high frequency during impact and 2 ms after impact when piston bounces.
Minnaert equation allow us to simply estimate the possible bubble radii: greater probability of 1 to 3.5 mm radii and non-homogenous apparition of bubbles below 1 mm radii. These represent bubble resonance radii which could be formed, growth and collapse after shock wave propagation. Nevertheless, theoretical Minnaert estimation and experimental results often present important difference as it was demonstrated by Brotchie et al. [33]. Theoretical radii were overestimated compare to reality (for example: at 213 kHz, resonance radius was calculated at 14 µm and experimental radius determined at 3.9 µm) [38]. Multiple frequencies produced by shock wave increases resonance probabilities but are not constant over time and formed bubbles have various size. However, wavelet study does not permit precise analysis of all parameters since all pressure signals are within the similar frequency range. High intensity of low frequency occurs all along impact cycles and high frequency only appears during impact and bounce for any initial parameters. No relevant parameter influence was found among our signal pressure analysis as this method can’t be considered as a reliable model compare to a Fourier transform study at each time, for example. Direct bubble visualization was therefore necessary to identify bubble radii during shock wave propagation depending on operational conditions.
3.3 Bubble visualization
Bubble apparition seems random due to multiple frequency excitation and instantaneous propagation of shock wave. The aim of this part of study was to evaluate bubble size distribution and the number of bubbles created at each impact in a specific volume depending on various operational
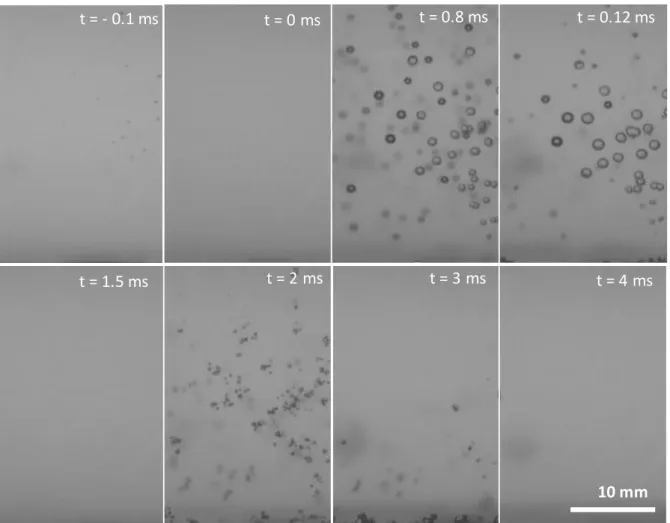
condition. Several parameters were studied, such as the time of bubble apparition, radius range (compare to Minnaert estimation), and impact gas fraction (compare to water hammer model). Some typical pictures during initial transient phase are shown in Fig. 4 for the impact at 12 mm, 20 mbar under air. Before the impact at t= -0.1 ms, stable bubbles are already formed due to piston rise (pressure of water is initially close to vapor pressure). These stable bubbles constitute nuclei sites which help bubble formation after impact. At the impact, t = 0 ms, gas is dissolved in water and pressure is maximal. Next, pressure decreases by shock wave propagation for forming cavitation bubbles which will growth and collapse from t = 0.7 ms to t = 1.3 ms after impact and from t = 2 ms to t = 3.5 ms after piston bounce.
Fig. 5. (a) shows bubble size distribution over time of shock wave propagation obtained from the image treatment using Matlab software. Comparison with pressure profile (Fig. 5.(b)) points out bubble formation during impact rarefaction and the piston bounce. This rarefaction period from 20 mbar to -3 bar could be due to the shock wave reflection on the bottom and the wall of the reactor. Its propagation time through the reactor is approximately 0.1 ms (Fig.5.(b)). Besides, this rarefaction can increase if a pressure is applied on the bottom of the reactor. Then, the bottom become mobile and can respond to the shock wave inducing a stronger reflection wave and rarefaction in the liquid. Those results was observed in previous work on phenol degradation [23]. Bubble radii are observed here from 0.01 mm (lowest detectable size by the camera and numerical treatment) to 2.8 mm depending on pressure wave propagation. First, biggest appear, at the impact, then bubbles divide themselves after the first collapse given new nuclei sites. At piston bounce, bubbles were more abundant but smaller.
Fig. 4. Typical pictures of obtained bubbles after an impact at 12mm, 20mbar, under air.
t = - 0.1 ms t = 0 ms t = 0.8 ms t = 0.12 ms
t = 1.5 ms t = 2 ms t = 3 ms t = 4 ms
Fig. 5. (a) Bubble size range and (b) original signal pressure, for an impact at 12 mm, 20 mbar, under air.
More detailed results of bubble image treatment summarized in Table S2 underline some challenges in the determination of bubble behavior in shock-induced cavitation reactor. Indeed, each setting parameter used in Matlab code for image treatment influences the well detection of bubble. Furthermore, bubbles in a same video often need a different treatment which necessitates to adjust these parameters by hand:
- Binarization threshold setting determines the position of bubble border and finally bubble radii. - Sensitivity setting could permit to detected large bubbles, but it hinders smaller bubble
detection.
(a)
- Completely dark bubbles and bubble with only dark border which are observed in the same picture need a different treatment.
- Gas fraction calculation was achieved at maximum detected gas volume considering perfect spherical bubbles in camera field volume which is closed to reactor side where bubbles are easily formed.
All these factors induce a numerical treatment error difficult to estimate. Furthermore, circle detection limit of 0.01mm inhibits bubble visualization corresponding to frequencies beyond sensor resonance at 250 kHz (Fig. S4.(b)).
Maximum detected bubble number is considered while volume percentage calculation normalized by camera field which is adjusted for each video due to some shadow. The time of bubble apparition was considered from the first formed cavitation bubbles after impact until the last formed cavitation bubbles after piston bounce. Number of maximum impact bubbles was considered after impact rarefaction and bubble size ranking allows us to compare them at the same time for various experimental parameters. Then, maximum detected bubbles number is different than maximum impact bubble number. Indeed, maximum bubble number appears after piston bounce due to bubble division after first impact collapse. Particularly, at 8 mm and 80 mbar, maximum detected bubbles corresponding to the piston rise before impact and not to shock wave propagation.
Heterogeneous bubble sizes complicate the linking of experimental data and experimental conditions, but a few observations could be noticed:
- At 8 ms, bubbles are smaller than 0.5mm of radius.
- At 12 and 16 mm, bubble ranges are wider (smallest bubbles were detected at these heights). - Time of bubble apparition increase with impact height.
- Under Ar/20%O2, more bubbles were observed and this profusion of bubble could obstruct the
picture which is constituted of mostly black shade such as compromising the circle detection. - At 8mm and 80 mbar, no cavitation was observed. The too important gas layer may stop shock
wave propagation.
- Gas fraction is lower than 0.65% that is consistent with sound wave propagation in liquid/gas mixture (Fig. S3) and it decreases with initial pressure increase. When initial pressure increases,
the gas layer increases also which induced the decrease of shock wave propagation velocity. Then, the shock wave is less strong to produce cavitation bubble which decreases gas fraction in liquid media.
These results confirm the conclusions of water hammer and Minnaert approaches [23,38]. Indeed, initial pressure and height conditions are essential to define impact pressure intensity and shock wave propagation speed. For a chosen initial pressure, propagation speed is approximatively the same for each impact height, and then for each impact pressure. However, gas fraction at the impact increase with impact pressure for each shock wave propagation velocity, probably meaning that a stronger impact induced more cavitation bubble formation in liquid (Fig. S3). For example, at 80 mbar and 8 mm, wave propagation is too weak to obtain an efficient rarefaction and cavitation. At 40 mbar for a same 8 mm height, cavitation bubble was well produced. Thus, initial pressure is essential to create bubbles and a maximum of 40 mbar seems to be necessary. Bubble sizes observed by camera are similar to the estimated ones by Minnaert study (Fig. S4). Whereas speed camera resolution and numerical picture treatment don’t permit to check bubble radii less than 0.01mm corresponding to high frequency beyond 250 kHz, the sensor resonance frequency.
Influence of successive impact at 1.1 Hz was studied with a camera frame on all reactor height. Four impacts have been saved on video. The previous bubble detection method is unable on these pictures due to abundant bubble formation from the second impact and especially under Ar/20% O2 atmosphere.
An example of impact at 16 mm, 20 mbar and under Ar/20%O2, is shown in Fig. S5. These pictures
Fig. 6. Pressure signal during several successive impacts at 1.1Hz, 16 mm, 20 mbar after Ar/20% O2
gas paddling (step number description in the text).
Each step of Fig. 6 corresponds to the following description of two cycle of impact (123 - 456) and the beginning of a third one (7). First impact shows same pictures than Fig. 4: during piston rising (1) at t = -0.5 s, stable bubbles are produced due to the decreasing pressure until chosen initial pressure setting. Bubbles are dissolved (2) at the impact of the piston (at t = 0 s) and then wave propagation induces formation, growth and collapse of cavitation bubbles until t = 2 ms. Next, few stable bubbles appear at the reactor top at t = 5 ms due to piston contact on the water surface. From t = 0.2 s and 0.3 s, the motor cam collides with piston (3) before raising it gradually which induces a small pressure decrease and then a pressure increase when piston come back on the water surface. Stable bubbles appear and are dissolved again at this moment. The motorized piston is then progressively risen during 0.5 s (4), which produces numerous stable bubbles coalescing to water surface. At the end of this piston rising at t = 0.7 s, an abundance of bubbles has appeared. Indeed, for the first piston rising, liquid has just been degassed by initial pressure setting. Thus, there is less nucleation sites than for the second piston raise due to the first cavitation bubble division when they collapse which create more site. Second impact (5) occurs at t = 0.95 s. The multiple bubbles are first dissolved before anew be formed, growth and collapse.
50 40 30 20 10 -10
Pr
es
su
re
(b
ar
)
Time (s)
1
2
3
4
5
6
7
Cavitation bubbles are smaller and not as much numerous than stable bubbles formed by piston raise. It is noteworthy that some bubbles are not dissolved and stay stable during wave propagation. Again, from t=1.2 s to 1.3 s, the cam collides with piston (6), even more stable bubbles are formed that coalesce and became undistinguishable anymore since the picture contains mostly black shade. Finally, from t = 1.5 s to t=1.8 s, piston raises and forms again a great number of stable bubble (7) which dissolve themselves before their formation, growth and collapse at t=1.8s. Last cycle until the fourth impact is similar.
At each impact, the number of stable bubbles formed by piston raise increases. The gas coming from the dissolution of bubble at the impact constitutes new nucleation sites for cavitation bubble. Thereby, reactional medium is stirred and degassed gradually which could modify the pressure between piston and liquid surface after several impacts. Then, during high number of impacts treatment, impacts series were limited to 100 impacts before adjusting atmosphere and initial pressure. This profusion of bubble could increase probabilities to obtain interesting chemical effects despite there are mostly big bubbles with probable associated physical effect. Indeed, acoustic cavitation studies revealed that higher frequency induced smaller bubble formation [38] and a better chemical activity [7]. Whereas, low frequency with bigger bubbles is more efficient for mechanical effects, which is used for emulsification or cleaning in industry [2]. Chemical effects produced by shocked-induced cavitation need to be experimentally measured to compare the formation yield of oxidant species to these physical observations.
3.4 Free radical dosimetry
Terephtalic acid dosimetry is the most appropriated to detect hydroxyl radicals with a detection limit estimated as 10-10 mol.L-1 [33,39]. Then the influence of frequency, impact height, initial pressure and
gas atmosphere was evaluated with a continuous vacuum setting to keep a stable intern pressure during no more than 100 impacts before adjusting gas atmosphere. Vacuum application on the reactor side involve a 12 mm impact height minimum. First, the study of the impact height influence (Fig. 7) shows a linear tendency for hydroxyl radical formation depending on impact number. Maximum concentration after 500 impacts was only 1.3x10⁻⁷ mol.L-1 which is very low compared to ultrasonic radical formation
yield [7]. Apparently, height variation has no specific influence on the radical production. As observed with high speed camera study, height increase induces stronger impacts and a wider bubble size distribution and chemical effects appear with smaller bubbles [1]. Thereby, height increase allows bubble size distribution to increase but not the number of small bubbles presumably producing free radicals. Neither impact intensity seems to be decisive on chemical effects.
Fig. 7. Impact height influence on hydroxyl radical formation during impact treatment at 20 mbar, 0.8 Hz, under Ar/20%O2 at ambient temperature.
Initial pressure influence was tested at 20 mbar and 40 mbar (Fig. 8). At 20 mbar, the atmosphere contains less oxygen representing oxidant species, compare to a 40 mbar pressure condition but intern reactor conditions near water vapor pressure (20 mbar at 20 °C) induces a stronger impact on the water surface and probably a higher shock wave propagation speed. Thus, both pressure conditions could be favorable to radical species formation. Nevertheless, Fig. 8 reveals that 20 mbar is most efficient to produce hydroxyl radicals. Indeed, impact force is stronger, then rarefaction too, and bubble formation is easier near water vapor pressure. The system is maintained to evaporation limit and wave propagation, facilitated as there is less introduced gas, causes vapor bubble formation. An initial pressure reduction
0,00E+00
2,00E-08
4,00E-08
6,00E-08
8,00E-08
1,00E-07
1,20E-07
1,40E-07
1,60E-07
0
100
200
300
400
500
H
O
•ra
d
ic
al
co
n
ce
n
tr
at
io
n
(µ
m
o
l.L
-1)
Impact number
12 mm
14 mm
16 mm
0.16
0.14
0.12
0.1
0.08
0.06
0.04
0.02
0
of factor 2, from 40 mbar to 20 mbar, allows hydroxyl radical formation to increase from 0.024 µmol.kJ -1 to 0.063 µmol.kJ-1.
Fig. 8. Impact height influence on hydroxyl radical formation during impact treatment at 20mbar, 0.8Hz, under Ar/20%O2 at ambient temperature.
Impact frequency is a new parameter for this shock induced cavitation reactor, compare to the previous studied device operated by an electromagnet [23,24], and it is adjustable from 0 to 1.5 Hz. Terephtalic acid analysis was achieved at 0.5 Hz, 0.8 Hz and 1.1 Hz. Results in Fig. 9 do not show an important frequency influence. Considering the experimental error, only last dots present a difference following this order: 0.5<1.1<0.8 Hz. In this way, frequency at 0.8 Hz represent an interesting ratio experiment time/oxidant species yield. Furthermore, a 1.1 Hz frequency increases the reactor wear risk.
Finally, various gas atmospheres were tested in comparison to ultrasonic experiments [7]. Results in Fig. 10 reveals the importance of introduced gas on the formation yield of OH radicals which is consistent with the results observed during ultrasonic irradiation. Indeed, gas mixture influences radical formation rate according to following order: Ar/20%O2 > Ar > air. These results are quite similar
to the sonochemical effects produced by ultrasound [8]. Ar/20%O2 atmosphere permit to obtain
maximum radical formation in this study. Argon atmosphere is more efficient than air due to the 0,00E+00 2,00E-08 4,00E-08 6,00E-08 8,00E-08 1,00E-07 1,20E-07 1,40E-07 1,60E-07 0 100 200 300 400 500 H O •ra d ic al co n ce n tr at io n (µ m o l.L -1) Impact number 20 mbar 40 mbar 0.16 0.14 0.12 0.1 0.08 0.06 0.04 0.02 0
previous paddling which produces nucleation sites. Moreover, argon is a gas favoring plasma formation with species ionization and chemical reaction initiation, and oxygen is a supplementary oxidant species.
Fig. 9. Influence of the impact frequency on hydroxyl radical formation during impact treatment at 20 mbar, 12 mm, under Ar/20%O2 at ambient temperature.
Fig. 10. Gas atmosphere influence on hydroxyl radical formation during impact treatment at 12 mm, 20 mbar, 0.8 Hz at ambient temperature.
0,00E+00 2,00E-08 4,00E-08 6,00E-08 8,00E-08 1,00E-07 1,20E-07 1,40E-07 1,60E-07 0 100 200 300 400 500 H O •ra d ic al co n ce n tr at io n (µ m o l.L -1) Impact number 1.1 Hz 0.8 Hz 0.5 Hz 0.16 0.14 0.12 0.1 0.08 0.06 0.04 0.02 0
0,00E+00
2,00E-08
4,00E-08
6,00E-08
8,00E-08
1,00E-07
1,20E-07
1,40E-07
1,60E-07
0
100
200
300
400
500
H
O
•ra
d
ic
al
co
n
ce
n
tr
at
io
n
(µ
m
o
l.
L
-1)
Impact number
Ar/20%O2
Argon
Air
20.16
0.14
0.12
0.1
0.08
0.06
0.04
0.02
0
The yields of hydroxyl radical obtained for impact-induced cavitation and ultrasonic cavitation in the presence of different gases are summarized in Table 1. A factor of almost 100 is observed between the two different techniques. Much higher chemical efficiency of ultrasonic cavitation can probably be attributed to the fact that shock induced reactor produces cavitation bubbles only at impact and bounce time (that being so approximately every second depending impact frequency) whereas ultrasound produces a continuous cavitation bubble cloud. Nevertheless, detection of OH radicals during impact-induced cavitation is important for better understanding of the cavitation mechanisms in general.
Table 1. Hydroxyl radical formation yield: comparison between ultrasonic and impact treatment at ambient temperature. Gas US 207 kHz (45 Wh) US 345 kHz (50 Wh) Impact 12 mm (1.2 Wh) Ar/20%O2 3.16 µmol.kJ-1 5.68 µmol.kJ-1 0.063 µmol.kJ-1
Argon 0.56 µmol.kJ-1 1.02 µmol.kJ-1 0.045 µmol.kJ-1
Air 0.60 µmol.kJ-1 0.46 µmol.kJ-1 0.027 µmol.kJ-1
Calculated delivered power for impact induced cavitation required for yield determination is indicated in Table.2. It was calculated following the delivered kinetic energy ∆𝐸𝑐 at each impact which only depends on impact height as describe in Fig. S1 where a linear relation was observed between the piston speed and the impact height:
∆𝐸𝑐 = 1 2 𝑚𝑝 𝑣
2= 0.00867 ℎ2 (3)
where ℎ is the impact height in mm.
Table 2 contains the results of the power (in Wh) delivered through 1 h impact treatment at different heights from 10 to 16 mm and at an impact frequency of 0.8 Hz. The results are compared to an ultrasonic treatment at 345 kHz and 50 W acoustic power (determined through calorimetric measurements using ultrasonic device reported recently [9]). These data allow to compare the yields of
OH radicals produced by shock wave cavitation and acoustic cavitation. The values evidence that the power delivered upon 1h impact treatment is much lower than the power transferred using ultrasounds at 345 kHz. Contrary to ultrasounds, energy is transmitted in shock-induced cavitation is not provided in a continuous way, but only at the instant the piston impacts the liquid contained in the reactor. Furthermore, all the kinetic energy of the piston is not directly transmitted to the liquid. In fact, the piston rebounds as it touches the liquid surface due to non-elastic propriety of the piston shock on the incompressible water surface [32]. Therefore, a part of its kinetic energy is used in this movement and subsequently transmitted during a second impact caused by this rebound. In any case, at the sight of our energy calculations we can conclude that the amount of energy involved in continuous ultrasound treatment and through shock-induced cavitation are not comparable, and that, moreover, this energy is provided in a very different way in both cases.
Table 2. Calculated power delivered during 1 hour at various impact heights at 0.8 Hz impact frequency compared to 1 hour 345 kHz ultrasonic treatment [12].
US 345 kHz Impact height
(Pac = 50 W) 10 mm (1 J) 12 mm (1.5 J) 14 mm (2 J) 16 mm (2.5 J)
50 Wh 0.8 Wh 1.2 Wh 1.6 Wh 2.0 Wh
4. Conclusions
In this work, new shock-induced cavitation reactor was characterized using physical and chemical techniques. Physical characterization confirmed the possible application of water hammer model to describe shock propagation at studied conditions. Wavelet transformation and Minnaert equation applied for the frequency analysis of pressure signal revealed multiple frequency wave propagation within the reactor and possible various level of bubble excitation (from 0.01 to 3.5 mm radii). Indeed, high-speed bubble imaging allowed to observed bubble size distribution from 0.01 to 2.8 mm radii, consistent with theoretical study from signals pressure, over time of shock wave propagation. It was shown that the initial gas pressure and impact height are the most influent parameters determining the pressure wave propagation in the liquid. While impact height settled impact pressure intensity and piston velocity, initial pressure influence drastically impact energy transfer but probably also shock wave
celerity. It is interesting that these results provided some new insights about the influence of shock wave propagation on bubble cloud formation in the reactor.
For the first time, hydroxyl radical formation has been proven during shock-induced cavitation that rank it among new advanced oxidation processes. A lower initial pressure increases the amount of hydroxyl radical, certainly due to a stronger impact inducing more active bubbles. Furthermore, gas atmosphere is determinant for the yield of OH radicals, similar to conventional sonochemistry, during shock-induced cavitation and follows a general trend: Ar/20% O2 > Ar > air.
Acknowledgements
This work was performed within the Investments for the future program of the French Government and operated by the French National Radioactive Waste Management Agency (ANDRA), Project CADET. The authors would like to thank Jerome Bonnety, Jean-Marie Citerne, Renaud Jalain, Aemilius Gitantra, Maria-Alejandra Castrillon Ramirez, Juan Buceta for participating in experiments.
References