scale.mit.edu
WORKING PAPER
TITLE:
Corporate Supply Chain Disclosures and Factors
Determining the Disclosure Approaches:
A Palm Oil Case Study
AUTHORS AND AFFILIATIONS:
Yin Jin Lee and Alexis Bateman,
MIT Sustainable Supply Chain Lab
DATE:
September 29, 2019
TITLE:
AUTHORS AND AFFILIATIONS:
ABSTRACT:
KEYWORDS:
CORRESPONDING AUTHOR:
scale.mit.edu
Corporate Supply Chain Disclosures and Factors Determining the Disclosure Approaches: A Palm Oil Case Study Yin Jin Lee and Alexis Bateman, Sustainable Supply Chain Lab Palm oil is one of four big commodities contributing to rapid deforestation. Companies face stakeholder pressure to produce and source palm oil sustainably and to disclose their commitments and actions. This study analyses companies' disclosures to understand the state of disclosure practice, identify typical disclosure profiles, examine the complementarity between commitments and sustainable sourcing practices, understand the factors influencing companies' disclosure profiles, and identify ways to encourage companies to act sustainability and disclose their supply chain information. Data were collected from publicly available documents such as websites, annual reports, and sustainability reports. Methods used include content analysis, kmeans clustering and multinomial logit regression. The resulting disclosure profiles can be used as a guide for companies towards to understand the state of disclosures and ideally, select more aggressive supply chain sustainability approaches. The estimated model quantified the importance of media influence and regulations in encouraging greater corporate supply chain sustainability and disclosures. Sustainable supply chain, Disclosures, Palm oil Yin Jin Lee, yinjin@mit.eduAbstract
Palm oil is one of four big commodities contributing to rapid deforestation. Companies face stakeholder pressures to produce and source palm oil sustainably and to disclose their commitments and actions. This study analyzes companies' disclosures to understand the state of disclosure practice, identify typical disclosure profiles, examine the complementarity between commitments and sustainable sourcing practices, understand the factors influencing companies' disclosure profiles, and identify ways to encourage companies to act sustainability and disclose their supply chain information. Data were collected from publicly available documents such as websites, annual reports, and sustainability reports. Methods used include content analysis, k-means clustering and multinomial logit regression. The resulting disclosure profiles can be used as a guide for companies towards to understand the state of disclosures and ideally, select more aggressive supply chain sustainability
approaches. The estimated model quantified the importance of media influence and regulations in encouraging greater corporate supply chain sustainability and disclosures.
Corporate Supply Chain Disclosures and Factors Determining the Disclosure Approaches: A Palm Oil Case Study
Introduction
As supply chains have become increasingly multinational and complex, some of the most significant impacts occur deep in the supply chain, far upstream from the consumer (O’ Rourke, 2014; Lee, 2004). It has been estimated that more than 20% of global emissions are through production of traded goods; that the current level of global production and
consumption are using 50% more natural resources than ecosystems regenerate (O’Rourke, 2014); that millions of children and migrants around the world work in hazardous and
indecent conditions in farms and factories (Human Rights Watch https://www.hrw.org/). As a result of these impacts, many companies have begun to address their impacts by addressing the sustainability of their supply chains.
Supply Chain Disclosure
As the negative social and environmental impacts occurring in the supply chain are increasingly brought to light, stakeholders have been increasingly demanding for companies to be responsible for the sustainability of their supply chains (Boström et al., 2015; Gibbon et al., 2008; Ponte & Gibbon, 2005) and to disclose information about their supply chains and the practices within (Doorey, 2011; Egels-Zandén et al., 2015; Mol, 2015)(Buckley 2002).
Stakeholders believe that disclosure can hold companies accountable for the conditions under which their products are made (Doorey, 2011; Haufler, 2010; Lambin et al., 2018). There are four primary forms of pressure to disclose: to comply with regulation, to satisfy requests from shareholders, to communicate attributes of products to consumers, and to mitigate
reputational risks from stakeholders (Bateman et al. 2017; Marshall, 2016; Zorzini, 2015). Mol proposed that the information age increased the pressure on companies to be transparent in their supply chain practices because civic society can effectively influence public opinions and threaten companies’ reputations (Mol, 2015). A primary example of this is when
Greenpeace campaigned against Nestle S.A. about their sourcing of unsustainable palm oil in 2010 (Chaudhari, 2011). Thus, investors are increasingly concerned about the sustainability of companies and their supply chains (Unruh, 2016). Research shows that companies with sustainable supply chains are less affected by negative corporate social responsibility events (Flammer, 2013) and may be able to generate more profits and business value over time (Ioannou & Serafeim, 2011). Global regulation is emerging that requires increasing disclosure about supply chains including the 2010 Dodd-Frank Wall Street Reform and Consumer Protection Act requiring U.S. companies to disclose usage of conflict minerals as well as the California Transparency in Supply Chain Act of 2010 and the Modern Slavery Act 2015 of UK which require companies of a certain size to disclose information regarding their efforts to eradicate human trafficking and slavery within their supply chains.
In response to stakeholders’ pressures and emerging regulations, some companies now disclose information about their efforts towards supply chain sustainability to set their commitments and communicate their progress (Lambin et al., 2018; Thorlakson et al., 2018). In this study, supply chain disclosure is defined as a businesses sharing information publicly to communicate their responsibilities and activities to mitigate and reduce their supply chain impacts on the environment and the society. The decision of what and when to disclose is specific to industries and companies because each industry faces a different set of
sustainability issues that is dependent on the materials, products, and processes they use. In addition, each company faces different levels of stakeholder pressure, as well as have varied capabilities and willingness to act (Marshall et al., 2016; Mol, 2015). Companies may also use reporting guides from Global Reporting Initiatives (GRI) and the Carbon Disclosure Project to provide information that address issues of materiality.
Even though there is variability in the quality of supply chain disclosure, many stakeholders demand certain pieces of information that can be used to hold companies accountable (Closs et al., 2011). The information includes ethical and sustainability conditions at suppliers (Lambin et al., 2018), adoption of sustainable sourcing practices to ensure
sustainable conditions (Gimenez & Sierra, 2013; Pilbeam et al., 2012; Rueda et al., 2017; Thorlakson et al., 2018), traceability of supply chains (BSR & United Nation Global Compact, 2014; Mol & Oosterveer, 2015), and leadership approaches (i.e., how companies collaborate with other stakeholders to tackle the sustainability issues together) (Bäckstrand, 2006). These disclosure themes span across many types of commodity supply chains such as in the apparel (Doorey, 2011; Egels-Zandén et al., 2015), minerals (Hofmann et al., 2018; Jenkins & Yakovleva, 2006), and agriculture (Coff et al., 2008; Wognum et al., 2011). Amongst these commodities is palm oil, an important global commodity that has led to rapid deforestation, labor issues, and climate impact. Under the pressure of governments through international (e.g., European Union’s Renewable Energy Directive) and national regulations, as well as civic society calls for palm oil sustainability (Nesadurai, 2017), many companies now disclose information about their sustainability efforts in palm oil sourcing.
Palm Oil
This study of supply chain disclosure focuses on palm oil (referring to oil palm and its derivatives) because of its impact as well as that, given the impacts, many companies that use palm oil have some focus and depth of disclosure in this topic. Palm oil is an important
international commodity, it accounts for 38% of global vegetable oil consumption in
2014/2015 (World Wide Fund for Nature, 2016). Most of the raw material supply (84%) is from Indonesia and Malaysia in 2016 (United States Department of Agriculture, 2018). To satisfy global demand, large areas of rainforests are cleared for palm oil agriculture. Between 1990 and 2015 Indonesia lost 31 million forests, which is equivalent to the size of Germany (Greenpeace, 2016). Moreover, palm oil plantation developments expose carbon-rich peatlands that exacerbate forest fires. Rapid deforestation results in loss of biodiversity, destruction of local and indigenous communities, as well as contribute to global climate change and regional air quality issues (Azhar et al., 2017; Carlson et al., 2017; Lyons-White & Knight, 2018). Palm oil plantations are also labor intensive and rely on many migrant workers working in poor working conditions (The Forest Trust, 2017).
Palm oil, like many other commodities (Mol et al., 2015; Rourke, 2014), has a complicated supply chain structure consisting of informal relationships, transborder
networks, blending and processing of products (Leegwater & van Duijn, 2012; Lyons-White et al., 2018) that impedes companies’ ability to identify the origins of their commodities.
Researchers and NGOs identify three primary companies in the palm oil supply chain (CERES, 2017; Lyons-White et al., 2018; World Wide Fund for Nature, 2016; Zoological Society London, 2017). They include oil processors and traders (OPT) that typically own plantations, mills, and
other processing plants; manufacturers that use palm oil and other derivatives in their consumer products; and retailers that sell the products to end-consumers. OPTs usually source oil palm fresh fruit bunches from informal farmers through middlemen and crude oils from other third-party mills to supplement their own supplies. As a result, only a few OPT, and therefore other companies in the supply chain, have full visibility or control of their palm oil supply chains.
The requirements for sustainable palm oil and the practices that companies can employ to improve or verify the social and environmental performance are not agreed upon (Carlson et al., 2017; Nesadurai, 2017; Von Geibler, 2013). However, some organizations have set out guiding principles as to what constitutes sustainable palm oil (CERES, 2017; RSPO, 2013; Zoological Society London, 2017). The Roundtable of Sustainable Palm Oil (RSPO) outline principles and criteria for widely-adopted requirements for sustainable production of palm oil; around 20% of global palm oil produced are RSPO-certified (Carlson et al., 2017). RSPO provides certified palm oil through four types of supply chains, namely, book-and-claim, mass balance, segregated, and identity preserved. The last three options are considered preferable because the supply of palm oil contains sustainably produced palm oil in fraction or in entirety which is verified through supply chain traceability (BSR et al., 2014; Mol et al., 2015; World Wide Fund for Nature, 2016). Besides RSPO, there are also a range of other external standards that either surpass RSPO in terms of strictness of requirements (e.g., RSPO-Next and Rainforest Alliance Certification) or focus on other goals (e.g., International
Sustainability and Carbon Certification (ISCC) and governmental standards) that companies can use for assessing the sustainability attributes of their palm oil (Nesadurai, 2017).
Companies may also implement internal programs or work with external partners to trace and monitor the sustainability of their suppliers. Companies can collaborate with their industry partners in trade alliances with sustainability agenda, such as the Consumer Goods Forum or AIM-PROGRESS, or collaborate with NGOs and governments who usually have earned local trusts to implement social and environmental programs (Brugmann & Prahalad, 2007). There are also a wide set of sourcing instruments, such as code of conduct, supplier approval processes, contract requirements, supplier trainings and investments that can be used by buyers to impose and reinforce sustainability values on their suppliers (Gimenez et al., 2013; Pilbeam et al., 2012; Porteous et al., 2015; Thorlakson et al., 2018).
Gap in Literature
The goals of this study are first, to identify what companies disclose about their commitments and approaches to source sustainable palm oil. The second goal is to understand how the relationship between disclosure and company characteristics. Understanding disclosure formats and trends provides insights into ways to increase corporate supply chain disclosures and adoptions of sustainable practices. We examined palm oil disclosures by 275 companies, including OPT, manufacturers, and retailers, that are most likely to have palm oil related disclosures in English. Through content analysis of websites, corporate social responsibility reports, annual reports, and other documents, information about palm oil disclosures was coded for analysis. This study focuses on supply chain sustainability disclosures of palm oil, such that specific information, e.g., being a member to the Roundtable of Sustainable Palm Oil (RSPO), refers to the same program and can be disclosed by all companies in the supply chain.
This study addresses several gaps in the literature. First, this study examines the differences in disclosure by both public and private companies across the supply chain. Most existing large-scale disclosure studies only include public companies because of the ease to access their information (Thorlakson, 2018, Patten 1991, Reverte 2009) but as a result, there is a lack of understanding of private companies’ practices and how to motivate them to disclose more information. In addition, there have been few supply chain wide analyses of disclosures (Hahn & Kühnen, 2013) and, no large-scale analyses of supply chain disclosure for any
commodity. Existing studies have looked at a single commodity from the producer
perspective (Hofmann et al. 2018, Jenkins & Yakovleva 2006). Other research in palm oil has similarly focused on only one position in the supply chain. (Zoological Society London, 2017), or a single type of sustainability effort (e.g., RSPO certification) (Donofrio et al., 2018; World Wide Fund for Nature, 2016).
Second, this is a large-scale analysis to identify how a full range of sustainable supply chain practices can complement each other and are used to substantiate sustainability claims. Research includes have case studies about adoption of sustainable practices for stakeholder demands (Doorey, 2011; Formentini & Taticchi, 2016; Lee & Klassen, 2008; Pagell & Wu, 2009), large scale studies on suppliers’ compliance to sustainability requirements (Gimenez et al., 2013; Porteous et al., 2015), and adoption of sustainable supply chain practices (Thorlakson et al., 2018). However, existing large-scale analyses did not examine the adoption of multiple practices in a commodity setting.
Third, this research also contributes insight into factors influencing disclosure of sustainable supply chain practices. Past research has addressed this issue in the form of case
studies examining the adoption of multiple practices (Formentini et al., 2016), and singular practices (Rueda et al., 2017). Large scale studies have been limited to meta-analysis of
existing literature on disclosure practices (Fernandez-Feijoo et al., 2014; Fifka, 2013), adoption of sustainable practices (Thorlakson et al., 2018), and formality of compliance instruments (Pilbeam et al., 2012).
Literature suggested that companies with high brand value (Bateman et al., 2017; Thorlakson et al., 2018), are large in employment or revenue (Mol, 2015), have sustainability brand and public listing, and are consumer-facing (Fernandez-Feijoo et al., 2014; Thorlakson et al., 2018) have higher sustainability disclosure due to external pressures. In addition,
companies with headquarters located in countries with high media attention to sustainability issues (Mol, 2015; Reverte, 2009), and national environmental and social regulations (Bateman et al., 2017; Marshall et al., 2016) have high sustainability disclosures to meet consumers’ expectations or disclose in response to existing or in advance of potential disclosure regulations. Therefore, the hypotheses that are tested in this study are: 1) companies with high brand value, sustainability branding, that are large, publicly listed and consumer-facing have higher sustainable supply chain disclosure, and 2) companies with HQ located in countries that have higher media attention to palm oil sustainability issue and national environmental and social regulations have higher sustainable supply chain disclosure. The control variables are whether the companies use GRI reporting standards, and whether the companies disclosed that they are trying to meet external stakeholders’ expectations.
Method Data Collection
This study used a selective sample of companies producing and/or using palm oil in the supply chain including OPT; manufacturers; and retailers. The sample of companies is representative of multiple geographies and industries (see Table 1). The sample consists of 275 companies that were selected from the World-Wide Fund for Nature (WWF) Palm Oil Scorecard (World Wide Fund for Nature, 2016), Sustainability Policy Transparency Toolkit (Zoological Society London, 2017), Forbes global 2000 companies 2017, Deloitte top 250 retailers 2017, and sustainable consumer blogs (Newman, 2017; “Special report on palm oil,” 2015). Together the retailers and manufacturers represent at least 10% of global palm oil consumption (World Wide Fund for Nature, 2016), and the OPTs control at least 87% of the global trade in palm oil (Nesadurai, 2017).
Table 1. The continent and the supply chain position of companies in the sample.
Region Oil palm grower
and palm oil processor
Retailer and food service
Manufacturer Total
Asia 38 33 27 98
Africa and South America 2 9 2 13 Australasia 0 4 17 21 Europe 7 39 45 91 North America 3 23 31 57 Total 51 108 122 281
The data collection included information relevant to sustainable sourcing of palm oil that are published on websites, annual reports, corporate social responsibility (CSR) reports, and other documents. When annual reports, CSR reports, and other documents are available for multiple years, the most recent versions, as of June 2018, are used. A majority (96.6%) of
the materials are published between 2015 to 2018. The codes are derived from theory or relevant research findings according to direct content analysis (Hsieh & Shannon, 2005). A detailed codebook was developed before the data collection based on initial findings (Berg & Lune, 2012). At the start of the coding, we aligned our definitions of sustainable palm-based production based on the generalized criteria of palm oil transparency as defined by CERES and SPOTT (CERES, 2017; Zoological Society London, 2017) and employed the definition of sustainable sourcing practices proposed by Thorlakson et al. (2018). The codebook was revised for clarity and comprehensiveness after an initial sampling of 60 companies. The finalized codes are described in Table 3.
Some challenges were met in the coding when trying to define certain attributes of “sustainable” palm oil or monitoring suppliers. In practice, there are variations across companies and contexts. For example, in industry practice, there is a range of definition for sustainable palm oil. For example, RSPO guidelines have allowances for deforestation except on High Carbon Stock (HCS) and HCV areas. RSPO also allows for plantation on shallow peatlands while the organization No Deforestation, Peatland, and Exploitation (NDPE) pledges to zero net deforestation and no plantation on peatland (Nesadurai, 2017). In addition, there are a range of definitions of ways to monitor the suppliers, for example, through third party or first party auditing (Doorey, 2011; Porteous et al., 2015; Thorlakson et al., 2018). Because this study focuses on supply chain disclosures across companies and industries, the codes selected are defined based on the mention of at least the
lower/minimum sustainability criteria. Companies can meet or exceed the sustainability criteria as defined by the codes. For example, companies that explicitly commit to zero gross
deforestation are recorded as equal to companies that mentioned the need to reduce
deforestation without further definition of deforestation criteria. While this requirement may be perceived as too lenient, the result of this study would indicate that not all companies would state the minimum-effort commitment or disclose to use the least stringent practices.
This study uses and records disclosure information, thus the codes are recorded based on the disclosure of the companies, rather than the actions that the companies have to take to disclose the information. This means that both an OPT and a manufacturer that have
committed to cease deforestation are marked yes for the “ceasing deforestation” code, even if committing to cease deforestation translates to different sets of actions by either type of companies.
Once the codebook was completed, the 60 preliminary companies were reviewed to align with the revised codebook. Each document was examined independently by at least two of three coders. The coders agree on the interpretations of 85% of the codes for all documents. Differing records of the same code were resolved by consensus between the two coders so that there was 100% agreement at the end.
Cluster Analysis
To classify companies into disclosure profiles, we used K-means clustering. To reduce the dimensionality of the dataset, principle components (example) of the disclosure
dimensions were used as inputs to the clustering analysis. The principle components were created in three steps: first, the 41 binary codes were summed according to their disclosure dimensions, then the disclosure dimensions were scaled to standard normal distribution, and principle component analysis was applied to the five disclosure dimensions. The top three
principle components contributing to 89% of the variation was used as inputs to the
clustering. We used gap statistics with 500 Monte Carlo permutation samples to identify the number of clusters that could best classify the disclosure profiles. K-means clustering and gap statistics were performed using the Cluster package in the R project for statistical computing.
Multinomial Logit Regression
This study used multinomial logit regression to analyze the relationship between the companies’ characteristics and their disclosure profiles. Thirteen variables including those in Table 2 and whether the company is a food manufacturer or a consumer packaged goods manufacturer; the democracy index of the HQ country published by The Economist magazine; and the continent of the HQ country were used as input. The model with coefficients that are consistent with prior expectations and the data, and can explain most of the variance without redundant parameters, i.e., has the best McFadden adjusted-R2 was selected (Ben-Akiva & Lerman, 1985). Regression was performed using PythonBiogeme version 2.6 (Bierlaire, 2003).
Table 2. Description of the independent variables used for multinomial logit regression
Independent variables Description
Oil Processor or Trader (OPT) Equals 1 if the company is an OPT, 0 o.w.
High brand value Equals 1 if company or its product is listed in the Reputation institute and Interbrand list of companies with high brand value, 0 otherwise
Public Equals 1 if the company is listed as public by Bloomberg.com, 0 otherwise
Log-number of employees Logarithm of the larger number of employment as disclosed in their documents or in D&B Hoovers
Corporate sustainability agenda Equals 1 if the company’s disclosures include statements on doing good, brand image and leadership, and meeting demand for sustainable products, 0 otherwise
Independent variables Description
Motivated to meet stakeholder expectation Equals 1 if the company’s disclosures include statements about meeting stakeholders’ expectations, 0 otherwise
Media attention % of publications about palm oil sustainability, including the keywords “palm oil” and “orangutan”, “illegal”, “logging”, “sustainable”, “sustainability”, “deforestation”, “rainforest”, “RSPO” or “biodiversity” out of publications that has the keyword “palm oil” published in the HQ country as recorded by Dow Jones Factiva from 2013 to 2017, Max = 0.47
Environmental regulation strictness Sustainable Global Competitiveness Index by World Economic Forum for 2014-2015. The score is divided by 100 so that it ranges from 0 to 1, Max = 0.68
GRI reporting standard Equals 1 if company discloses using GRI reporting standard, 0 otherwise
Results Codes and Dimensions
Of the sampled companies, 179 out of 275 (65%) disclosed sustainability related information about palm oil. Of the remaining companies, 27 of them did not have information in English for analysis. Of the disclosures in English, 62 of companies do not mention the use (or avoidance) of palm as an ingredient, and of those that mentioned palm as an ingredient, 7 do not mention any sustainable sourcing practices. These 69 companies are considered to have zero palm oil disclosure.
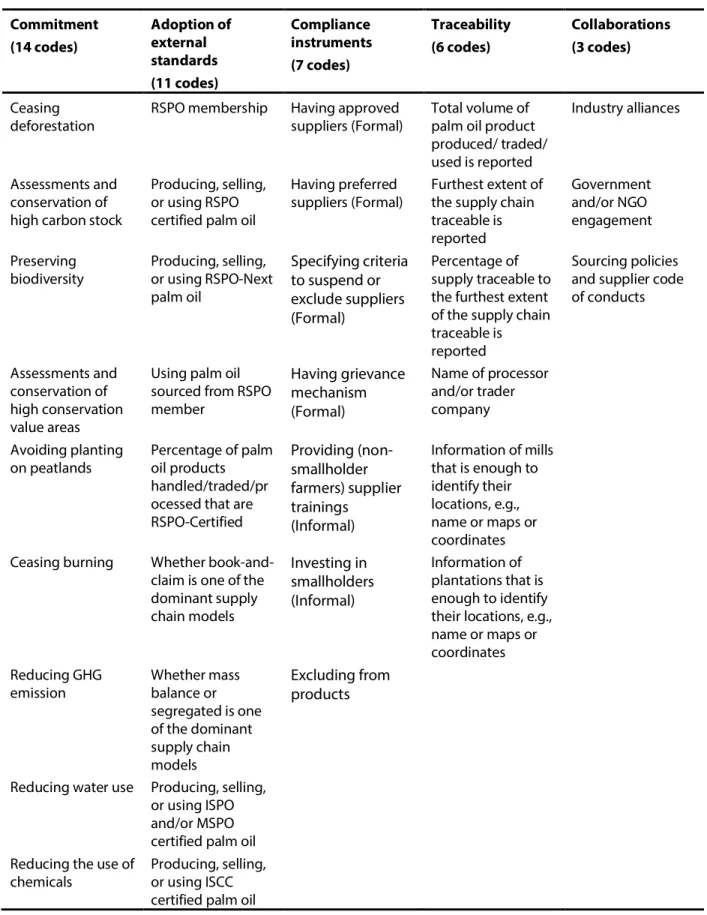
Sustainability related information about palm oil was captured using 41 codes (see Table 3). The 41 codes were categorized into 5 disclosure dimensions: Commitment to sustainable palm oil production criteria, Adoption of external standards, Compliance
instruments, Traceability, and Partnerships. Commitments to sustainable palm oil production criteria matches the principle and criteria of RSPO (RSPO, 2013); adoption of external
standards include RSPO membership and production or usage of certified palm oil; compliance instruments include formal and informal methods that companies can use to ensure activities in the upstream supply chain is sustainable; and collaborations include membership in industry alliance, the use of code of conduct to specify requirements to suppliers, and partnerships with NGOs or governments. Traceability records the percentage of traceability, and other information that companies provide that could be used to identify other suppliers along their supply chain.
Table 3. Codes for disclosure information and the dimensions that the codes are categorized under Commitment (14 codes) Adoption of external standards (11 codes) Compliance instruments (7 codes) Traceability (6 codes) Collaborations (3 codes) Ceasing deforestation
RSPO membership Having approved suppliers (Formal)
Total volume of palm oil product produced/ traded/ used is reported
Industry alliances
Assessments and conservation of high carbon stock
Producing, selling, or using RSPO certified palm oil
Having preferred suppliers (Formal)
Furthest extent of the supply chain traceable is reported Government and/or NGO engagement Preserving biodiversity Producing, selling, or using RSPO-Next palm oil Specifying criteria to suspend or exclude suppliers (Formal) Percentage of supply traceable to the furthest extent of the supply chain traceable is reported
Sourcing policies and supplier code of conducts
Assessments and conservation of high conservation value areas
Using palm oil sourced from RSPO member Having grievance mechanism (Formal) Name of processor and/or trader company Avoiding planting on peatlands Percentage of palm oil products handled/traded/pr ocessed that are RSPO-Certified Providing (non-smallholder farmers) supplier trainings (Informal) Information of mills that is enough to identify their locations, e.g., name or maps or coordinates Ceasing burning Whether
book-and-claim is one of the dominant supply chain models Investing in smallholders (Informal) Information of plantations that is enough to identify their locations, e.g., name or maps or coordinates Reducing GHG emission Whether mass balance or segregated is one of the dominant supply chain models Excluding from products
Reducing water use Producing, selling, or using ISPO and/or MSPO certified palm oil Reducing the use of
chemicals
Producing, selling, or using ISCC certified palm oil
Commitment (14 codes) Adoption of external standards (11 codes) Compliance instruments (7 codes) Traceability (6 codes) Collaborations (3 codes) Respecting land tenure rights Producing, selling, or using NGO-Led certified palm oil Respecting
workers’ rights
Being or sourcing from ISO certified sources Providing welfare to local communities Anti-corruption Respecting relevant local laws
Disclosure Summary Statistics and by Supply Chain Position
At a high level the data shows that some commitments and sourcing practices are more common to companies. The first column in Figure 1 shows the percentage of companies (out of 179) that disclosed each piece of information. Companies are primarily concerned with reducing deforestation (64%), conserving biodiversity (58%), protecting workers’ rights (69%), and respecting relevant laws and regulations (56%). Common practices across all supply chain positions include being RSPO members (70%), using RSPO-certified palm oil (66%), having to approve suppliers (56%), providing supplier codes of conduct (59%), and partnering with governments and non-governmental organizations (56%).
Figure 1. The percentage of companies providing information for each disclosure code.
In general, OPTs disclose the most followed by manufacturers, and lastly retailers (Figure 1). As a result of limited visibility in commodity chains, some supply chain practices and information are less visible further downstream towards the retailers. In addition, manufacturers and retailers have a multitude of materials and/or products and may choose not to disclose as much information on certain materials such as palm oil based on their situation. The differences in the details also provide insight. In particular, manufacturers and retailers do not commit to sustainability for operations at mills and processors likely because they do not have control of this portion of the supply chain. They are typically more focused
on their investment in RSPO membership and certified palm oil. On the other hand, OPTs tend to publicize the other external standards that they have qualified for, the informal compliance measures that they have implemented, and their palm oil supply traceability.
Disclosure Profiles and Its Implications
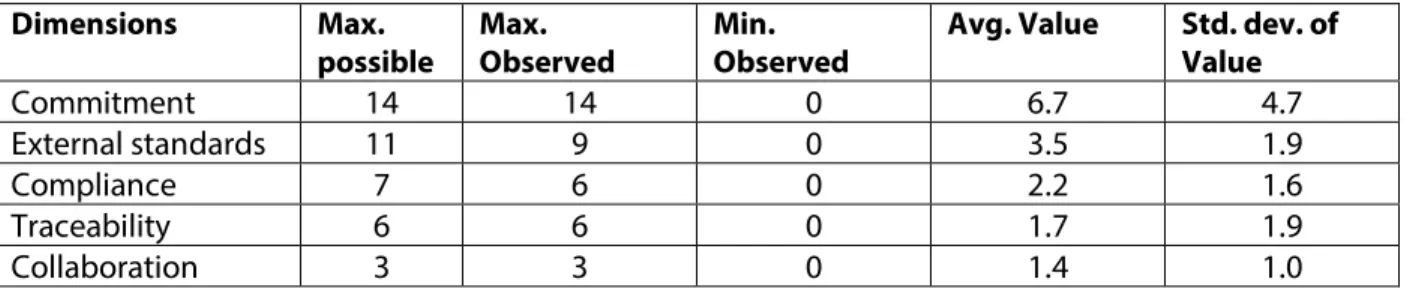
To classify the companies into disclosure profiles, the 41 codes were categorized into the 5 disclosure dimensions for the clustering analysis. Companies were scored in each disclosure dimensions depending on the number of codes they disclosed. For example, if a company made four relevant commitments, then it received 4 out of 14 for the commitment disclosure dimension. Table 4 shows the average scores, the standard deviations, the
minimum and the maximum scores of the 179 companies.
Table 4. Summary statistics of the disclosure dimensions
Dimensions Max. possible Max. Observed Min. Observed
Avg. Value Std. dev. of Value Commitment 14 14 0 6.7 4.7 External standards 11 9 0 3.5 1.9 Compliance 7 6 0 2.2 1.6 Traceability 6 6 0 1.7 1.9 Collaboration 3 3 0 1.4 1.0
The clustering analysis divided the 179 companies into three groups, which are labelled as High, Medium, and Low disclosure groups. The sample also includes 69 zero-disclosure companies that were not included in the clustering analysis. In total, there were four disclosure profiles. The amount of information disclosed decreases in all dimensions across the disclosure profiles (Table 5). The coefficient of variation is higher in the low disclosure profile than in the high and medium disclosure profiles. This implies that companies that are in the low disclosure profile disclose less as well as disclose different
information. The number of companies in each disclosure profile range between 51 to 69 companies. The high disclosure group includes a large portion of OPTs (65%) as well as some manufacturers (35%) but does not include any retailers. On the other hand, medium to zero disclosure groups include mainly manufacturers and retailers; there are no OPT with zero-disclosure.
Table 5. Summary statistics of the disclosure dimensions by the disclosure profiles
Dimensions High Medium Low Zero
Commitment 11.9 (2.2) 6.7 (3.2) 2 (2.6) 0 (0) External standards 5.1 (1.6) 3.6 (1.6) 2.1 (1.5) 0 (0) Compliance 4.0 (1.1) 2.1 (1.2) 0.7 (0.9) 0 (0) Traceability 4.1 (1.2) 0.9 (1.1) 0.5 (0.8) 0 (0) Alliance 2.1 (0.8) 1.7 (0.8) 0.4 (0.5) 0 (0)
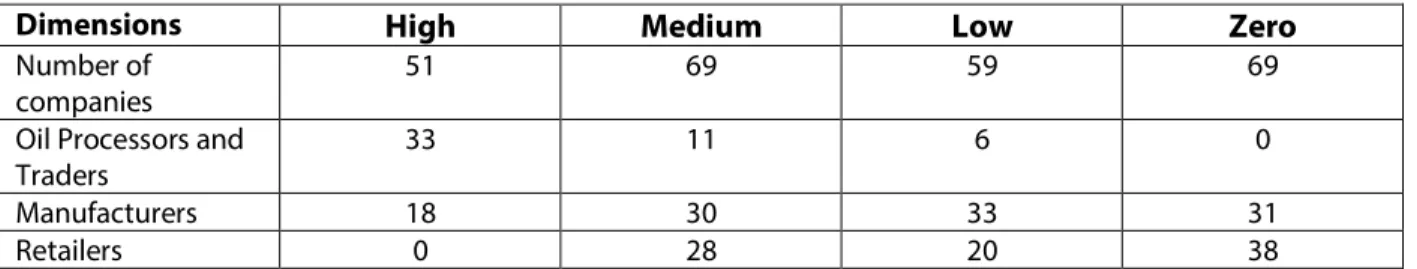
Table 6. Number of companies and the supply chain positions of the companies in each disclosure profile group
Dimensions High Medium Low Zero
Number of companies
51 69 59 69
Oil Processors and Traders
33 11 6 0
Manufacturers 18 30 33 31
Retailers 0 28 20 38
The differences in the information disclosed at the code level by companies in each disclosure profile group provide partial insight into the companies’ sustainable sourcing strategies for palm oil. There are two main types of companies in the low disclosure group. A majority of the companies only discuss some aspects of commitment, such as reducing deforestation, conserving biodiversity and protecting workers’ rights while claiming RSPO membership (49%) and the use of RSPO-certified palm oil (51%). 27% of the companies in the low disclosure group use mass balance or segregated palm oil supply. The second is a group that avoid using palm oil (22% of the companies), who do not qualify to be RSPO Members.
Drawing from their disclosures, companies in the medium disclosure group make more attempts to address sustainability in their supply chain. Most of them participate in RSPO and use formal compliance instruments such as approved suppliers (70%) and code of conduct (78%), to substantiate elaborated commitments to palm oil sustainability. They collaborate with NGOs and governments (65%) to increase their supply chain visibility, but their ability to apply other types of compliance instruments and to trace the supply chain is still limited. Of those that report the traceability score, 18.8% can trace to mills and and 7.2% can trace to farms, and the average reported percentages of traceable palm oil are 8.9% to mill and 0% to farm.
Lastly, companies in the high disclosure group generally trace part of their supply chain and apply a wide range of compliance instruments, including both formal and informal ones. A majority of them have grievance mechanism (78%), provide trainings to their
suppliers (78%), and invest in smallholder farmers (78%). Of those that report on their percent of material traceable, 29% and 60% of them can trace up to mills and to farms respectively, and the average reported percentages of traceable materials are 55.0% to mills and 27.7% to farm. This implies that compliance instruments can reinforce a companies’ ability to trace their supply chain. In another perspective, companies that can trace their supply chain have access to more compliance instruments. Figure 2 illustrates the % of companies providing information for each disclosure codes, with the companies categorized by their disclosure profiles
Factors Influencing Disclosure
Company characteristics and the context of their HQ country have strong influence over their disclosure profiles. The coefficients estimated with multinomial logit regression, using the zero-disclosure profile as the reference alternative, are shown in Table 7. All coefficients are significant at the 89% confidence level, and the McFadden adjusted-pseudo R2 is 0.34. The in-sample prediction accuracy is 63%. The alternative specific constants for
high, medium, and low disclosure groups with respect to the zero disclosure groups are negative implying that all else being equal, companies would prefer not to disclose anything. OPT, public, and companies with more employees are more likely to have medium and high
disclosure profiles. High brand value and high sustainability branding companies are more likely to have high disclosure profiles. Companies that are trying to meet stakeholder expectations, and companies that use GRI reporting standards are more likely to have medium and high disclosure profiles. Companies with HQ located in countries with high media attention on palm oil sustainability and higher environmental regulations also disclose more information about their palm oil sustainability. The results are consistent when the log of employment is used and when only stratified subsets of the data are used to estimate the model.
Table 7. The estimated coefficients of the multinomial logit regression models
Independent variables Estimated coefficient Standard error p-value
High-disclosure profile constant -17.6 3.28 0.00 Medium-disclosure profile constant -8.94 2.11 0.00 Low-disclosure profile constant -4.97 1.55 0.00 Oil processor and trader (specific to HDP) 6.26 1.45 0.00 Oil processor and trader (specific to MDP) 2.20 1.04 0.03
High brand value 3.94 0.82 0.00
Public (specific to HDP and MDP) 0.88 0.46 0.06 Log-number of employees (specific to HDP) 0.48 0.19 0.01 Log-number of employees (specific to MDP) 0.21 0.12 0.08
Sustainability branding 1.55 0.69 0.05
Stakeholder expectations (specific to HDP) 1.97 0.84 0.02 Stakeholder expectations (specific to MDP) 1.70 0.42 0.00 Media attention (specific to HDP) 12.9 4.19 0.00 Media attention (specific to MDP) 7.68 2.47 0.00 Media attention (specific to LDP) 5.49 2.22 0.01 Sustainability Global Competitive Index 0.65 0.31 0.04 GRI reporting standard (specific to HDP) 2.75 0.70 0.00 GRI reporting standard (specific to MDP) 0.70 0.44 0.11
Scenario Analysis
The model indicates that if the HQ country contexts have stronger emphasis on environmental issues either through media or regulation, it can increase companies’
tendency to disclose more information on their palm oil supply chain sustainability. Since the media attention coefficient increases with the extent of disclosure, the model indicates that for a given increase in media attention, the tendencies for companies to fall into higher disclosure profiles are higher too. The increase in the companies’ utility to use higher disclosure profiles increase more than the lower disclosure profiles. On the other hand, the coefficient for regulation is the same for all extents of disclosure, indicating that for a given increase in regulation strictness, the tendencies for companies to fall into all non-zero
disclosure groups increase at similar rates. The following scenario analyses demonstrates the influence of this difference on the predicted probability for companies to fall into each disclosure group.
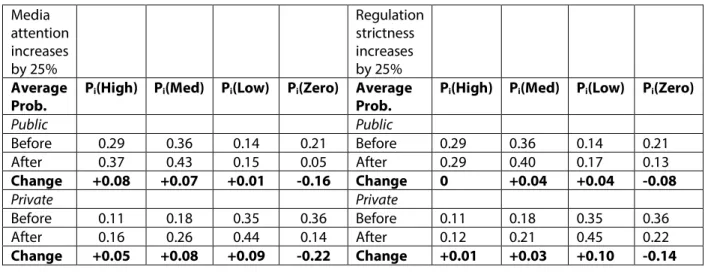
Two scenarios are simulated, the first describes a 25% increase in media attention on palm oil sustainability issues, and the second describes a 25% increase in the sustainability global competitiveness index (proxy of environmental regulation). Table 8 shows that 25% increase in media attention would increase the probability of high and medium disclosure profiles more than a 25% increase in regulation strictness. The estimated model coefficients and the scenario analysis demonstrate that regulation only motivates companies to meet the minimum requirements. Nonetheless, both scenarios increase private companies’ chances to adopt higher disclosure profiles.
Table 8. Results of scenario analysis where media attention and regulation strictness are increased by 25% Media attention increases by 25% Regulation strictness increases by 25% Average Prob.
Pi(High) Pi(Med) Pi(Low) Pi(Zero) Average Prob.
Pi(High) Pi(Med) Pi(Low) Pi(Zero)
Public Public Before 0.29 0.36 0.14 0.21 Before 0.29 0.36 0.14 0.21 After 0.37 0.43 0.15 0.05 After 0.29 0.40 0.17 0.13 Change +0.08 +0.07 +0.01 -0.16 Change 0 +0.04 +0.04 -0.08 Private Private Before 0.11 0.18 0.35 0.36 Before 0.11 0.18 0.35 0.36 After 0.16 0.26 0.44 0.14 After 0.12 0.21 0.45 0.22 Change +0.05 +0.08 +0.09 -0.22 Change +0.01 +0.03 +0.10 -0.14 Discussion
In this study, we identified that there are distinct disclosure profiles in palm oil supply chain sustainability ranging from zero, low, medium, and high disclosures. This study
suggests that companies that disclose more about their sustainable sourcing practices do so to comply with external forces, and our study builds on the fact that companies are disclosing a significant amount of information on certain issues with high impact (Thorlakson et al. 2018, Henders et al. 2015), in this case palm oil. The findings demonstrate that there is a continuum in disclosure approaches that consist of not disclosing at all, disclosing partial or limited information, or disclosing a significant amount of information with insights into the supply chain. Through these disclosure profiles, we see that low disclosure firms primarily report on their membership to the RSPO, the primary multi-stakeholder association for sustainable palm. Medium disclosure companies tend to report more significantly on their commitments for sustainable palm oil as well as their compliance approaches for their commitments (such as selecting an approved supplier or a contract requirement). For high disclosure companies, the major difference is that they report more on traceability of their palm oil source and apply
a wide range of formal and informal supplier management instruments. Through these findings, we find that the lowest common denominator for disclosure is RSPO membership, while disclosure on traceability of palm oil sources is only reported by copnaies with
significant the commitment to palm oil sustainability. This difference between adoption rates of two sustainability efforts could be explained by the efforts needed: RSPO membership only requires a fee and annual self-reporting (RSPO, 2017) whereas traceability requires extensive work on getting visibility in the supply chain that can be difficult and expensive (Lyons-White et al., 2018; Mol, 2015). .
Second, the results support the hypothesis that companies that face more external stakeholder pressures, i.e., company with attributes that included high brand value, public, large, and sustainability brandings will have higher supply chain disclosure. However, the results also indicate that OPTs disclosed the most relative to manufacturers and retailers, which is contrary to the common assumption that non-consumer facing brands disclose less (Fernandez-Feijoo et al., 2014; Thorlakson et al., 2018). However, it aligns with OPT’s control of the upstream supply chain processes with increased visibility as well as the business value of providing sustainable palm oil to its buyers (Unruh et al. 2016).
Lastly, we found that an increase in HQ country environmental regulation would results in more companies disclosing but focus by the media would result in more high-quality disclosures. As regulation on supply chain transparency and disclosure increase globally, this has significant implications for motivating companies to disclose. With an
increasing number of regulations mandating supply chain disclosure and due diligence about a specific issue, e.g., forced labor, companies would be compelled to disclose. However, they
will do the least possible to comply with that requirement. Whereas, if there is significant media attention, companies will increase the quality of the disclosure, moving from the lowest amount of information to more substantial information on supply chain practices. While our regression model shows a positive proportional relationship between media attention and disclosure, it is noted that the relationship between media attention and disclosure could be more complex. For example, previous research on media influence on green consumer attitude found that media coverage of organic in Denmark evolved from positive to negative news to retain audience interests. The research warns that sustained negative news on green issues (e.g., attacks on sustainability claims) can undermine public trust in sustainable products over time, nullifying the value of sustainability disclosures (Thøgersen, 2006).
Our study was limited by a few factors. As with other large scale studies on sustainable sourcing practices and disclosure (Lock & Seele, 2016; Martí et al., 2013; Thorlakson et al., 2018), we were limited to public disclosures of companies to derive this information. Companies both overreport and underreport on their activities, which reduces the overall representation of actions (Thorlakson et al. 2018). We also only used English disclosures to enable complete understanding and avoid translation bias. Our study was also limited to a single commodity of palm oil to ensure that the information disclosed are consistent enough to compare the differences in the disclosures of companies across the supply chain.
Conclusion
In this large-scale study of palm oil disclosures, we gained insight into the sustainable supply chain practices in the palm oil supply chain. We were able to understand the
differences of approaches across supply chain positions within the specific issue of palm oil. In addition, our data highlights the knowledge gap across the supply chain in major
commodities such as palm oil. This study contributes several new perspectives to the literature by providing insight into a large-scale study of disclosure practices across the supply chain of a high-focus commodity. We classified the types of disclosure profiles and analyzed how company’s characteristics influence their supply chain disclosure. In addition, we investigated scenarios of increasing regulation and media focus as motivators for
disclosure. This study also provides insight for companies who source palm oil by
understanding what disclosure and sourcing practices are common in the industry; what are the minimum expectations; how do companies substantiate sustainability commitments with sourcing practices; as well as what high supply chain disclosure looks like. This study allows companies to evaluate their approach relative to others, as well as identify a new strategy as both regulation pressures and media attention on palm oil sustainability continue to increase. Future research could pair these findings across other commodities and find commonalities between disclosure approaches across commodities.
References
Azhar, B., Saadun, N., Prideaux, M., & Lindenmayer, D. B. (2017). The global palm oil sector must change to save biodiversity and improve food security in the tropics. Journal of
Environmental Management, 203, 457–466.
Bäckstrand, K. (2006). Multi-Stakeholder Partnerships for Sustainable Development : Rethinking and Effectiveness. European Environment, 16, 290–306.
Bateman, A. H., Blanco, E. E., & Sheffi, Y. (2017). Sustainable Supply Chains, 4, 119–144. Ben-Akiva, M., & Lerman, S. (1985). Discrete Choice Analysis. Cambridge, MA: MIT Press. Berg, B., & Lune, H. (2012). An Introduction to Content Analysis. In J. J. Craig Campanella,
Dickson Musslewhite (Ed.), Qualitative Research Methods for the Social Sciences (8th ed., pp. 349–385). New Jersey: Pearson Education Inc.
Bierlaire, M. (2003). BIOGEME: A Free Package for The Estimation of Discrete Choice Models.
Swiss Transport Research Conference, 1–27.
Boström, M., Jönsson, A. M., Lockie, S., Mol, A. P. J., & Oosterveer, P. (2015). Sustainable and responsible supply chain governance: Challenges and opportunities. Journal of Cleaner
Production, 107, 1–7.
Brugmann, J., & Prahalad, C. . K. (2007). Cocreating Business ’ s New Social Compact. Harvard
Business Review, 85(2).
BSR, & United Nation Global Compact. (2014). A guide to traceability: A practical approach to advance sustainability in global supply chains. New York, NY: United Nation Global Compact. Retrieved from https://www.unglobalcompact.org/library/791
Carlson, K. M., Heilmayr, R., Gibbs, H. K., Noojipady, P., Burns, D. N., Morton, D. C., … Kremen, C. (2017). Effect of oil palm sustainability certification on deforestation and fire in Indonesia.
Proceedings of the National Academy of Sciences, 115(1), 201704728.
CERES. (2017). Reporting Guidance for Responsible Palm, (January), 16.
Chaudhari, A. (2011). Greenpeace, Nestlé and the Palm Oil Controversy : Social Media Driving
Change ? (Vol. 44). Hyderabad, India.
chains: The role of supply chain management. Journal of the Academy of Marketing
Science, 39(1), 101–116.
Coff, C., Korthals, M., & Barling, D. (2008). Ethical Traceability and Informed Food Choice. (C. Coff, M. Korthals, D. Barling, & T. Nielsen, Eds.). Springer.
Donofrio, S., Rothrock, P., & Leonard, J. (2018). ZOOMING IN: COMPANIES, COMMODITIES, &
TRACEABILITY, COMMITMENTS THAT COUNT, 2018.
Doorey, D. J. (2011). The Transparent Supply Chain: from Resistance to Implementation at Nike and Levi-Strauss.
Egels-Zandén, N., Hulthén, K., & Wulff, G. (2015). Trade-offs in supply chain transparency: The case of Nudie Jeans Co. Journal of Cleaner Production, 107, 95–104.
Fernandez-Feijoo, B., Romero, S., & Ruiz, S. (2014). Effect of Stakeholders’ Pressure on Transparency of Sustainability Reports within the GRI Framework. Journal of Business
Ethics, 122(1), 53–63.
Fifka, M. S. (2013). Corporate Responsibility Reporting and its Determinants in Comparative Perspective - a Review of the Empirical Literature and a Meta-analysis. Business Strategy
and the Environment, 22(1), 1–35.
Flammer, C. (2013). Corporate Social Responsibility and Shareholder Reaction: The
Enviornmental Awareness of Investors. Academy of Management Journal, 56(3), 758–781. Formentini, M., & Taticchi, P. (2016). Corporate sustainability approaches and governance
mechanisms in sustainable supply chain management. Journal of Cleaner Production, 112, 1920–1933.
Economy and Society, 37(3), 315–338.
Gimenez, C., & Sierra, V. (2013). Sustainable Supply Chains: Governance Mechanisms to Greening Suppliers. Journal of Business Ethics, 116(1), 189–203.
Greenpeace. (2016). Cutting Deforestation Out of the Palm Oil Supply Chain. Amsterdam, The Netherlands. Retrieved from
https://www.greenpeace.de/files/publications/20160303_greenpeace_indonesien_palm scorecard.pdf
Hahn, R., & Kühnen, M. (2013). Determinants of sustainability reporting: A review of results, trends, theory, and opportunities in an expanding field of research. Journal of Cleaner
Production, 59, 5–21.
Haufler, V. (2010). Disclosure as Governance : The Extractive Industries Transparency Initiative and Resource Management in the Developing World. Global Environmental Politics, 10(3), 53–73.
Hofmann, H., Schleper, M. C., & Blome, C. (2018). CONFLICT MINERALS AND SUPPLY CHAIN DUE DILIGENCE: AN EXPLORATORY STUDY OF MULTI-TIER SUPPLY CHAINS. Journal of
Business Ethics, 147(1), 115–141.
Hsieh, H.-F., & Shannon, S. E. (2005). Three Approaches to Qualitative Content Analysis.
QUALITATIVE HEALTH RESEARCH, 15(9), 1277–1288.
Ioannou, I., & Serafeim, G. (2011). The Consequences of Mandatory Corporate Sustainability
Reporting (11 No. 100). Harvard Business School Working Paper Series. Boston, MA.
Jenkins, H., & Yakovleva, N. (2006). Corporate social responsibility in the mining industry: Exploring trends in social and environmental disclosure. Journal of Cleaner Production,
14(3–4), 271–284.
Lambin, E. F., Gibbs, H. K., Heilmayr, R., Carlson, K. M., Fleck, L. C., Garrett, R. D., … Walker, N. F. (2018). The role of supply-chain initiatives in reducing deforestation. Nature Climate
Change, 8(2), 109–116.
Lee, S., & Klassen, R. D. (2008). Drivers and Enablers That Foster Environmental Management Capabilities in Small- and Medium-Sized Suppliers in Supply Chains, 17(6), 573–586. Leegwater, M., & van Duijn, G. (2012). Traceability of RSPO-certified Sustainable Palm Oil. In
Palm Oil: Production, Processing, Characterization, and Uses (pp. 713–736). Urbana, IL:
AOCS Press.
Lock, I., & Seele, P. (2016). The credibility of CSR (corporate social responsibility) reports in Europe. Evidence from a quantitative content analysis in 11 countries. Journal of Cleaner
Production, 122, 186–200.
Lyons-White, J., & Knight, A. T. (2018). Palm oil supply chain complexity impedes
implementation of corporate no-deforestation commitments. Global Environmental
Change, 50, 303–313.
Marshall, D., McCarthy, L., McGrath, P., & Harrigan, F. (2016). What’s Your Strategy for Supply Chain Disclosure? MIT Sloan Management Review, 57(2), 37–45.
Martí, J. M. C., & Seifert, R. W. (2013). Assessing the Comprehensiveness of Supply Chain Environmental Strategies. Business Strategy and the Environment, 22, 339–356.
Mol, A. P. J. (2015). Transparency and value chain sustainability. Journal of Cleaner Production,
107, 154–161.
sustainability in global agro-food value chains. Sustainability (Switzerland), 7(9), 12258– 12278.
Nesadurai, H. E. S. (2017). New Constellations of Social Power: States and Transnational Private Governance of Palm Oil Sustainability in Southeast Asia. Journal of Contemporary Asia. Newman, K. (2017). A LIST OF PALM OIL FREE PRODUCTS - HOW YOU CAN REDUCE YOUR
IMPACT. Retrieved March 27, 2018, from https://www.travelfordifference.com/list-palm-oil-free-products/
Pagell, M., & Wu, Z. (2009). Building a more complete theory of sustainable supply chain management using. Journal of Supply Chain Management, 45(2), 37.
Patten, D. M. (1991). Exposure , Legitimacy , and Social Disclosure, 297–308.
Pilbeam, C., Alvarez, G., & Wilson, H. (2012). The governance of supply networks: a systematic literature review. Supply Chain Management: An International Journal, 17(4), 358–376. Ponte, S., & Gibbon, P. (2005). Quality standards, conventions and the governance of global
value chains. Economy and Society, 34(1), 1–31.
Porteous, A. H., Rammohan, S. V, & Lee, H. L. (2015). Carrots or Sticks? Improving Social and Environmental Compliance at Suppliers Through Incentives and Penalties. Production
and Operations Management, 24(9), 1402–1413.
Reverte, C. (2009). Determinants of Corporate Social Responsibility Disclosure Ratings by Spanish Listed Firms Carmelo Reverte, 351–366.
Rourke, D. O. (2014). The science of sustainable supply chains. Science, 344(6188), 1124–1128. RSPO. (2013). Principles and Criteria for the Production of Sustainable Palm Oil. Report
April), 1–70.
RSPO. (2017). RSPO Membership Rules 2016. Kuala Lumpur, Malaysia: Roundtable on
Sustainable Palm Oil. Retrieved from http://www.rspo.org/key-documents/membership Rueda, X., Garrett, R. D., & Lambin, E. F. (2017). Corporate investments in supply chain
sustainability: Selecting instruments in the agri-food industry. Journal of Cleaner
Production, 142, 2480–2492.
Special report on palm oil. (2015). Retrieved March 27, 2018, from
http://www.ethicalconsumer.org/ethicalreports/palmoilreport.aspx
The Forest Trust. (2017). Palm Oil Industry Transformation. Retrieved from http://www.tft- earth.org/wp-content/uploads/2017/02/TFT-Palm-Oil-Industry-Transformation-Paper.pdf
Thøgersen, J. (2006). Media Attention and the Market for ‘Green’ Consumer Products. Business
Strategy and the Environment, 15, 145–156.
Thorlakson, T., de Zegher, J. F., & Lambin, E. F. (2018). Companies’ contribution to sustainability through global supply chains. Proceedings of the National Academy of
Sciences, 201716695.
United States Department of Agriculture. (2018). Production, Supply, and Distribution. Retrieved March 2, 2018, from https://www.fas.usda.gov/
Von Geibler, J. (2013). Market-based governance for sustainability in value chains: Conditions for successful standard setting in the palm oil sector. Journal of Cleaner Production, 56, 39–53.
(2011). Systems for sustainability and transparency of food supply chains - Current status and challenges. Advanced Engineering Informatics, 25(1), 65–76.
World Wide Fund for Nature. (2016). Palm Oil Buyers Scorecard: Measuring the Progress of Palm
Oil Buyers. Gland, Switzerland.
Zoological Society London. (2017). Hidden Land, Hidden Risks? London, UK. Retrieved from spott.org/palm-oil/landbank