HAL Id: hal-00295963
https://hal.archives-ouvertes.fr/hal-00295963
Submitted on 3 Jul 2006
HAL is a multi-disciplinary open access
archive for the deposit and dissemination of
sci-entific research documents, whether they are
pub-lished or not. The documents may come from
teaching and research institutions in France or
abroad, or from public or private research centers.
L’archive ouverte pluridisciplinaire HAL, est
destinée au dépôt et à la diffusion de documents
scientifiques de niveau recherche, publiés ou non,
émanant des établissements d’enseignement et de
recherche français ou étrangers, des laboratoires
publics ou privés.
The impact of cirrus clouds on tropical
troposphere-to-stratosphere transport
T. Corti, B. P. Luo, Qinjun Fu, H. Vömel, T. Peter
To cite this version:
T. Corti, B. P. Luo, Qinjun Fu, H. Vömel, T. Peter.
The impact of cirrus clouds on tropical
troposphere-to-stratosphere transport. Atmospheric Chemistry and Physics, European Geosciences
Union, 2006, 6 (9), pp.2539-2547. �hal-00295963�
www.atmos-chem-phys.net/6/2539/2006/ © Author(s) 2006. This work is licensed under a Creative Commons License.
Chemistry
and Physics
The impact of cirrus clouds on tropical troposphere-to-stratosphere
transport
T. Corti1, B. P. Luo1, Q. Fu2, H. V¨omel3, and T. Peter1
1Institute for Atmospheric and Climate Science, ETH Zurich, Switzerland
2Department of Atmospheric Sciences, University of Washington, Seattle, WA, USA
3Cooperative Institute for Research in Environmental Sciences, University of Colorado, Boulder, CO, USA
Received: 7 December 2005 – Published in Atmos. Chem. Phys. Discuss.: 9 March 2006 Revised: 29 May 2006 – Accepted: 29 May 2006 – Published: 3 July 2006
Abstract. Although it is well known that air enters the
strato-sphere preferentially through upwelling in the tropics, the exact mechanisms of troposphere-to-stratosphere transport (TST) are still unknown. Previously proposed mechanisms have been found either to be too slow (e.g., clear sky up-welling) to provide agreement with in situ tracer measure-ments, or to be insufficient in mass flux to act as a major supply for the Brewer-Dobson circulation (e.g., convective overshooting). In this study we evaluate whether the lofting of air via cirrus cloud-radiation interaction might offer an al-ternative path for TST, which is responsible for a significant fraction of the observed air mass transport. We find that a combination of deep convection and subsequent upwelling associated with cirrus clouds and clear sky can explain the supply of air for the Brewer-Dobson circulation. Thus, up-welling associated with cirrus clouds offers a mechanism for the missing second stage, which links the first stage of TST, deep convection, to the third stage, the Brewer-Dobson cir-culation.
1 Introduction
Air enters the stratosphere preferentially through upwelling in the tropics. Processes involved with tropical troposphere-to-stratosphere transport (TST) therefore determine the com-position of the air masses reaching the stratosphere. It is well accepted that air is lifted from the surface into the tropical upper troposphere by convection, driven by latent heat re-lease. How air reaches the tropical cold point tropopause sit-uated at about 380 K potential temperature is however sub-ject of ongoing research. Due to latent heat release alone, deep convection can reach potential temperatures of typically less than 360 K (Folkins et al., 2000). The main outflow
Correspondence to: T. Corti
of tropical deep convection is found even lower at around 13 km or 350 K potential temperature (Folkins and Martin, 2005). Higher potential temperatures can be reached in over-shooting events, where convective air masses mix with air of higher potential temperature. There have been observations of convective overshooting turrets (e.g., Kelly et al., 1993), transporting air directly into the lower stratosphere, but these cases seem to be very rare. Furthermore, the mass fluxes in-volved in such events are most likely far too small to supply the Brewer-Dobson circulation with sufficient mass (Gettel-man et al., 2002).
The outflow from most deep convection subsides again due to radiative cooling, which prevails below the so-called “level of zero net radiative heating” (Q=0). In clear sky, this level is situated at 15 km or 360 K potential tempera-ture (Gettelman et al., 2004). In full sky, the transition from radiative cooling to heating occurs about 0.5–1.0 km lower than in clear sky (Corti et al., 2005). The existence of a level of Q=0 has led to the general assumption that in order to reach the stratosphere, convection has to transport air at least to 360 K, from where radiative heating continues to lift the air to the cold point tropopause in large scale upwelling. Although the mass fluxes involved in large scale upwelling are large enough to supply the Brewer-Dobson circulation with sufficient air (see e.g., Corti et al., 2005), there is yet another problem. The seasonal cycle of CO2 occurring in
the planetary boundary layer can be found with little damp-ing at 390 K and 420 K with a time lag of 60±20 days and 110±30 days, respectively (Boering et al., 1994; Andrews et al., 1999; Sherwood and Dessler, 2003). Sherwood and Dessler have shown that a combination of deep convection reaching close to the level of Q=0 with subsequent large scale upwelling in clear sky is too slow to explain the time lag. They concluded that overshooting in very deep convec-tion was needed in order to transport air from the ground to the tropical lower stratosphere in a sufficiently short time. However, observations and cloud resolving models indicate
2540 T. Corti et al.: Cirrus and troposphere-to-stratosphere transport Pump Pump Pump Troposphere Stratosphere Tropical pipe T
(a)
(b)
Winter hemisphere Summer hemisphere TropicsFig. 1. Schematic of tropical large scale upwelling. (a) The mean transport through the tropical cold point tropopause is mainly driven by dissipating waves (see Plumb, 2002). (b) The mesoscale differences in the upwelling velocity are determined by radiative properties of cloudy and cloud free air masses. Specifically, absorption of infrared radiation in upper tropospheric cirrus leads to enhanced upwelling.
that this transport mechanism is too rare for being responsi-ble for TST (Gettelman et al., 2002; Kupper et al., 2004).
The fact that the transition between the Hadley circulation and the Brewer-Dobson circulation is smooth and that there-fore the tropical tropopause is not a material surface has led to the introduction of the tropical tropopause layer (TTL). The TTL is thought as a layer in which the transition from a convectively driven circulation to a wave driven circulation occurs. As there is no commonly accepted definition for the TTL, we will give our own here. We take isentropic surfaces as boundaries, so that air enters or leaves the TTL only due to diabatic processes. For the lower limit of the TTL, we choose the 350 K isentropic surface, which corresponds to the level of the main convective outflow. The upper limit of the TTL is set to 420 K potential temperature. This level marks approx-imately the top of the North-South divergence in the tropi-cal upwelling mass flux (Corti et al., 2005). Moreover, it is thought to be the highest level reached by the deepest convec-tion (e.g., Kelly et al., 1993; Sherwood and Dessler, 2001). All dehydration events most likely occur below that level.
Given that overshooting convection is sufficiently rapid but too rare, and that moderately deep convection is suffi-ciently frequent but subsequent radiative lifting in clear sky is too slow, we evaluate if the inclusion of cloud radiative effects might offer an alternative path for TST, which is fast and intensive. We first clarify how radiative transport can ef-fectively drive vertical mass transport. Then, we use radiative transfer calculations to quantify upwelling and subsidence in clouds and in cloud free air in the tropical upper troposphere and lower stratosphere (UTLS).
2 Vertical transport due to radiative processes
Vertical transport that is defined as the transport across isen-tropes might be divided into convective transport due to la-tent or sensible heat release, and radiative transport due to radiative heating or cooling. This classification is justified by the circumstance that latent heat release and in cloud sen-sible heat transport are the major driving forces in low level clouds and deep convection. In high altitude cirrus clouds on the other hand, radiation is the dominant element for trans-port across isentropes.
Convection is an undisputed mechanism for vertical trans-port in the tropics. This is not the case for radiatively driven upwelling. It is broadly acknowledged that air ascends in the tropical upper troposphere and merges into the Brewer-Dobson circulation. However, this circulation is thought to be driven by dissipating synoptic- and planetary-scale waves (Holton et al., 1995; Plumb, 2002), exerting the effect of a suction pump on the tropical tropopause region (Fig. 1a). Forced by wave dissipation, the upwelling motion leads to advective cooling, lowering the temperature below radiative equilibrium, causing radiative heating which allows the air to readjust its temperature while rising continuously. The mean vertical temperature profile is then determined by the mean radiative properties of the atmosphere. In this picture, known as the “downward control principle” (Haynes et al., 1991), the wave drag is the dominant force, the “Master” of the upwelling, whereas radiation is seen as a purely balanc-ing component, as a “Slave”, solely responsible for heatbalanc-ing the air. This is why radiation is often believed to play a purely passive role in tropical upwelling.
Although this picture might be largely correct in the stratosphere, the situation could be quite different in the troposphere, where horizontal variability in cloudiness leads
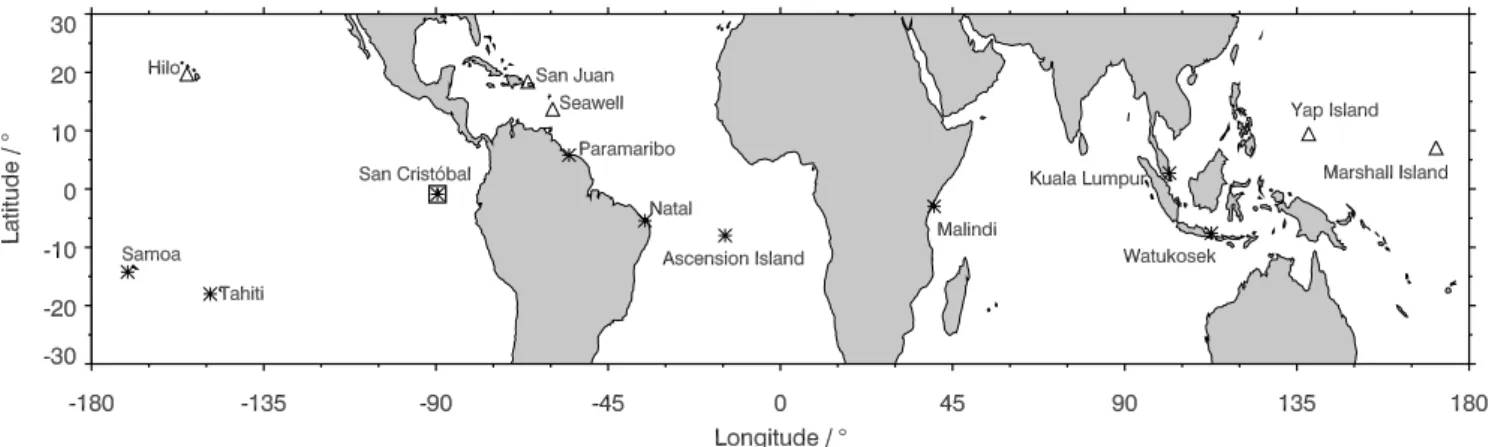
Fig. 2. Locations of tropical (20◦S to 20◦N) radiosonde measurements used in this study. San Crist´obal (square): simultaneously measured profiles of water vapor, temperature and ozone. Tropical Southern Hemisphere Additional Ozonesondes (SHADOZ) network locations (stars): simultaneously measured temperature and ozone profiles. Tropical NOAA/NCDC radiosonde locations (triangles): high resolution temperature profiles.
to different radiative heating rates on the mesoscale or on the scale of individual air parcels. Specifically, enhanced in-frared absorption in thin high altitude cirrus clouds results in higher heating rates, leading to an increase of the potential temperature (θ ) and thus to upward transport of air masses relative to θ levels. In addition, the enhanced radiative heat-ing results in horizontal gradients of isentropes and geopo-tential, which lead to a circulation attempting to flatten the horizontal gradients (Fig. 1b). Such dynamic adjustment is very efficient in the tropics, where the coriolis parameter be-comes small, keeping horizontal temperature gradients small (Sobel et al., 2001). Therefore, enhanced radiative heating in cirrus clouds translates locally into faster upwelling than in cloud free air. This phenomenon is known as “cloud lofting” and has first been described by Lilly (1988) and Ackerman et al. (1988).
In summary, we argue that the extratropical pump may dominate the large scale background circulation, but that ra-diation plays an active role in driving the tropical upwelling on the mesoscale. Whether air masses are efficiently trans-ported upward is determined by their cloud radiative prop-erties relative to the environment. Therefore, individual air parcels experience radiative heating, not as a balancing pro-cess, but as a forcing that determines the actual diabatic as-cent or deas-cent rate of individual air parcels,
dθ
dt =Qrad, (1)
where Qradis the radiative heating rate expressed as potential
temperature change per time (Note: Qradis defined
differ-ently here than in Corti et al. (2005), where it was expressed as temperature change per time). The vertical mass flux M at a certain altitude is then
M = ρdz
dθQrad, (2)
with ρ being the mass density of air.
3 Data
3.1 Atmospheric profile data
Balloon sonde measurements from different sources have been evaluated to establish a set of vertical temperature, ozone and water vapor profiles with high vertical resolu-tion. 15 water vapor profiles reaching from the ground up to at least 28 km altitude were obtained from balloon sound-ings with a frost point hygrometer during different seasons at San Crist´obal, Galapagos Islands (Vomel et al., 2002). Simultaneously measured temperature and ozone profiles were obtained from soundings at all tropical Southern Hemi-sphere Additional Ozonesondes (SHADOZ) network loca-tions (Fig. 2) but Nairobi (because this high altitude station seems to show a clear orographic influence of Mt. Kenya on the profiles) (Thompson et al., 2003a,b). All profiles from 1998–2004 without major gaps up to 28 km were used, adding up to a total of 1554 profiles. In order to obtain a better representation of the Northern Hemisphere in the data set, 15 880 vertical temperature profiles measured between 1998 and 2004 were taken from the Stratospheric Processes and their Role in Climate (SPARC) archive of NOAA/NCDC high resolution radiosonde measurements (Fig. 2).
All data has been gridded vertically with a resolution of 250 m. Calculations with the 15 individual water vapor pro-files from soundings at San Crist´obal showed that a mean water vapor profile is sufficient for the computation of mean clear sky heating rate profiles in the UTLS (Corti et al., 2005). This is not true in the lower troposphere, where non-linear effects from water vapor occur. Calculations with pro-files from the SHADOZ network locations led to similar re-sults for ozone (i.e., it is not necessary to perform many radiative calculations on all individual profiles and do the averaging afterward, but suffices to average over all atmo-spheric profiles and do one single calculation). However,
2542 T. Corti et al.: Cirrus and troposphere-to-stratosphere transport
calculations with individual profiles are indispensable for quantifying heating rate variabilities. Moreover, it needs to be emphasized that the presence of clouds always requires a case-by-case treatment, hence multiplying the number of necessary calculations.
3.2 Cloud data and method
Information on cloud occurrence and properties from two sources were combined for this study, the ISCCP D1 data (Rossow and Schiffer, 1999) and cloud observations from LITE (McCormick et al., 1993).
The ISCCP D1 data set provides cloud occurrence statis-tics from September 1983 to September 2001. It is based on the analysis of radiance measurements from weather satel-lites with a spatial sampling resolution of approximately 30 km. Every radiance measurement is classified either as clear sky or as containing a single layer cloud with specific cloud top pressure and optical depth. The lack of informa-tion on detailed cloud vertical structure is a serious limitainforma-tion of the ISCCP data for the computation of radiative heating rates. In order to overcome this limitation, we have com-bined the ISCCP D1 data with measurements from the LITE, a space borne lidar flown on space shuttle Discovery from 10–19 September 1994. A detailed description of the ex-perimental design can be found in McCormick et al. (1993). Winker et al. (1996) have provided an overview on the mea-surements performed during the experiment.
The standard lidar equation assuming single scattering is insufficient for long-range or wide field-of-view application, where contributions from multiple scattering to the return signal become important. This phenomenon has two aspects. On one hand, the optical depth derived from measurements using the single-scatter assumption can be reduced due to multiple scattering by at least a factor of 2 with respect to the true value (Chepfer et al., 1999). As consequence, a factor η has been introduced to take multiple scattering into account, leading to the equation
S(z) = Cβ(z)exp(−2ητ (z)), (3)
where S(z) is the lidar signal, C an instrumental constant,
βthe backscatter coefficient and τ the optical depth. Volger et al. (2002) have examined in detail the multiple scattering for LITE, finding η to be almost constant in cirrus and water clouds, amounting to 0.4 and 0.6, respectively (In fact, they used an slightly different lidar equation employing a multi-ple scattering coefficient F =1−η). On the other hand, mul-tiple scattering can lead to lidar pulse stretching within opti-cally thick clouds, which appear in the backscattered profiles as streaks of fading intensity at the cloud bases (Miller and Stephens, 1999). However, pulse stretching becomes signifi-cant only in clouds with an optical depth well above unity. As we use exclusively lidar information up to an optical depth of 1.27 (see below), our analysis is not affected by the pulse stretching problem.
The lidar signals were inverted after taking the mean over 10 shots, using Eq. (3), assuming ice clouds above 7 km and water clouds below. A cloud was defined as every atmo-spheric feature that created a signal 6 times higher than the noise level in the backscatter ratio profile. For thin clouds with optical depth τ below 0.1, τ was estimated from the sig-nal using a fixed extinction to backscatter ratio of 40, which was determined based on the analysis of denser clouds. For denser clouds, the extinction to backscatter ratio was esti-mated from the signal below the cloud layer. The analysis was constrained to high gain data only, which allows a good characterization of thin high cirrus clouds, resulting in a to-tal number of 21 472 extinction profiles. We estimate that a cloud layer of 500-m thickness has a minimum detectable τ of about 4×10⁻³(Corti et al., 2005). It should be noted that many subvisual clouds were detected by LITE, whereas sig-nals from ultra thin tropical tropopause clouds (UTTC) (Peter et al., 2003; Luo et al., 2003) with optical depth of typically 10−4remained below detection limit. Despite its short mea-surement period of 10 days, LITE provides excellent infor-mation in vertical structure of optically thin tropical clouds, shown to be an essential complement to other observations, e.g. cloud top statistics from a ground based micropulse li-dar in the tropical western Pacific (Comstock et al., 2002; Corti et al., 2005). Optical depth frequency distributions and mean geometrical thickness agree well with airborne mea-surements presented in McFarquhar et al. (2000). Also, 56% of the LITE profiles have optical depth below 1.27 (includ-ing clear sky situations), compared to 55% for the ISCCP data from 20◦S to 20◦N.
We construct a combined LITE-ISCCP data set in the fol-lowing way. In all cases with optical depth below 1.27 the complete extinction profiles from LITE were used for the ra-diative calculations. In all cases with optical depth above 1.27, the LITE extinction profiles were used from the top of the atmosphere down to the altitude where optical depth reached 1.0. There, a cloud was inserted downward accord-ing to the occurrence frequency for denser clouds from the ISCCP cloud distribution. The vertical extent of these clouds was set to climatological values (Liou, 1992).
3.3 Radiative transfer calculation
The model by Fu and Liou (1992, 1993) was used to calcu-late the radiative heating rates. The single scattering proper-ties of ice water clouds are parameterized with a generalized effective particle size (Dge) and ice water content based on
Fu (1996) and Fu et al. (1998). We assume Dge=13 µm for
cirrus clouds, consistent with aircraft observations (McFar-quhar et al., 2000). The ice water content was calculated from the cloud extinction and Dge, employing the equation
presented in Fu (1996), which assures consistency with the radiative transfer model. For water clouds, an effective ra-dius of 10 µm was assumed, and the liquid water content de-termined following Slingo (1989) analogously to the cirrus
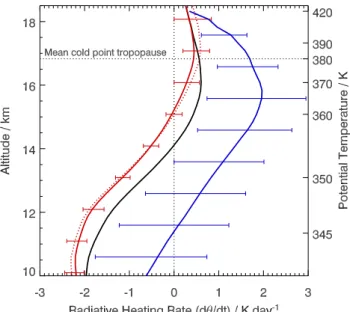
Fig. 3. Mean radiative heating rates in the tropics from more than
300 000 calculations including clouds, separated for air in clouds (blue) and cloud free air (red). The horizontal bars represent the 25th and 75th percentiles. Also shown is a heating rate profile as-suming clear sky (dotted red). The black line represents the full sky heating rates, i.e. the heating rates in clouds and cloud free air weighted with their altitude dependent occurrence frequencies.
case. The heating rates are only weakly dependent on parti-cle size, because the cloud information in the data sets used here is given as optical depth, which is by far the most impor-tant factor influencing the radiative heating rate. Changing the particle size influences the heating rate in the cloud layer by a few percents only and even less outside the cloud.
At each of the 15 balloon sonde locations, full sky heating rate profiles were computed based on all 21 472 cloud extinc-tion profiles combined with randomly selected atmospheric profiles, resulting in more than 300 000 calculations. For ev-ery calculation we accounted for the solar diurnal variation of the day. Mean profiles were calculated at all locations which were then averaged to provide a mean tropical heat-ing rate profile. The heatheat-ing rate variability resultheat-ing from variations in the temperature and ozone profiles and from clouds (σT ,O3,clouds) was estimated based on calculations at
the SHADOZ network locations, where simultaneously mea-sured temperature and ozone profiles were available. The variability from water vapor (σH2O) was estimated from the
15 profiles measured at San Crist´obal, under the assumption that the variability in water vapor is uncorrelated with the variability in temperature, ozone and clouds.
σtot2 =σT ,2O
3,clouds+σ
2
H2O (4)
The radiative calculations have been evaluated to compute separate heating rate profiles for air in clouds and cloud free air. The heating rate profile for air in clouds was calculated
Fig. 4. Mean tropical radiatively driven vertical mass fluxes in cloud free air (red) and in clouds (blue) derived from mean radia-tive heating rates, weighted with their altitude dependent occurrence frequencies. The black line shows the full sky radiative mass flux, i.e. the sum of the two other profiles. The green dashed curve rep-resents mean tropical convective mass fluxes estimated from high resolution satellite images (Gettelman et al., 2002). The horizontal lines are estimated uncertainties.
based on all those parts of the vertical profiles with cloud particles present. The calculation of the heating rate profile for cloud free air was based on all parts of the vertical profiles where no cloud particles were present (i.e., the parts of the profile above and below clouds, or the complete profile in clear sky situations where no clouds were present at all).
A series of additional calculations was performed to test the robustness of the results: For a subset of the data, the at-mospheric and cloud extinction profiles have been combined based on potential temperature instead of geometrical alti-tude. The resulting heating rates profiles did not differ sub-stantially from those computed on geometrical altitudes. Var-ious calculations with mean atmospheric profiles have been performed. As discussed in Sect. 3.1, the results indeed show that one single mean profile would be sufficient to compute the tropical zonal mean radiative heating rate profile in the clear sky case. This is not true for clouds. The extinction profiles have to be combined one by one with atmospheric profiles. Altogether, the results from the radiative calcula-tions presented here are very robust. The following seccalcula-tions discuss only the results based on individual atmospheric and cloud profiles with altitude as vertical coordinate.
2544 T. Corti et al.: Cirrus and troposphere-to-stratosphere transport
4 Results and discussion
Mean tropical profiles of radiative heating rates are depicted in Fig. 3. The figure shows mean radiative heating rates in clouds (blue) and in cloud free air (red). The horizontal bars represent the 25th and 75th percentiles, visualizing the effect of variations in temperature, ozone, water vapor and cloud properties. The red dotted line represents the mean tropic clear sky profile, (i.e. assuming no clouds at all. In contrast, the red line is for “cloud free air”, which also includes air above or below clouds). The difference to the mean cloud free profile is small. This means that the influence of clouds on the mean radiative heating rates outside of clouds is small. The full sky profile (black) is the mean heating rate profile from cloudy and cloud free air weighted with their altitude dependent occurrence frequencies. In cloud free air, radia-tive cooling prevails below 15 km or 360 K potential tem-perature, but radiative heating prevails above. The radiative heating peaks at 0.5 K potential temperature per day around the mean cold point tropopause (380 K) and decreases again slightly with increasing altitude. The mean heating rate in-side of clouds (blue) shows its transition from cooling to heating at 11.5 km or 345 K potential temperature. The hor-izontal bars indicate a substantially larger variability inside clouds compared to cloud free air. In the upper troposphere, the mean radiative heating inside clouds reaches 2 K day−1 and decreases with increasing altitude, approaching clear sky values at about 18 km. Several interesting features can be de-duced from Fig. 3.
First, air experiences radiative cooling in clear sky below 15 km. Outflow air of convection therefore subsides again as soon as it is free of cloud particles (i.e., after they have sed-imented out or evaporated when mixed into a subsaturated environment). As the outflow detrains from convection, it is usually saturated with respect to ice. Due to the subsidence in clear sky, however, the air warms and relative humidity decreases. With typical cooling rates of 1–2 K day−1, the air masses subside so rapidly that a renewed formation of a cloud becomes impossible after a subsidence time ts
corre-sponding to only a few days. This means that the processes occurring in the first days after detrainment from convection are decisive for the further fate of air parcels with respect to TST.
Second, in the range of altitude between 12 and 15 km, air typically experiences radiative cooling in clear sky, whereas it is heated in clouds. In principle, air can therefore be re-cycled in this altitude range, ascending in clouds and de-scending in clear sky. However, such an oscillation will be limited because of the short subsidence time ts mentioned
above. Therefore air masses will preferentially be saturated or heavily subsaturated in clear sky. This implies a bimodal water vapor distribution as observed in the tropical upper tro-posphere (Zhang et al., 2003).
Third, the heating rate variability is high in clouds, be-cause it depends strongly on the structure of the vertical
ex-tinction profile. The heating rate in a thin high altitude cirrus for instance is positive in otherwise clear sky conditions, but close to zero or even negative in the case of an underlying high convective cloud (Ramaswamy and Ramanathan, 1989; Hartmann et al., 2001). It can be expected that an air par-cel experiences different heating rates such that the temporal mean heating rate lies close to the mean.
Forth, the mean radiative heating rates in clouds amount to about 1.5 K day−1between 350 and 370 K potential tem-perature (13 and 16 km). It follows that outflow from deep convection reaching 350 K can be transported into the vicin-ity of the cold point tropopause in approximately two weeks if it stays inside cirrus clouds for most of the time. This is faster by about a factor of 5 than thought previously assum-ing clear sky conditions.
Figure 4 depicts mean vertical radiative mass flux pro-files for the radiative heating rate propro-files shown in Fig. 3, weighted with their altitude dependent occurrence frequen-cies. Therefore the magnitude of the upwelling mass flux inside clouds can be directly compared with that outside clouds. The horizontal bars represent estimated uncertain-ties including measurement errors from the balloon sonde measurements and sampling uncertainties. The dashed green curve in Fig. 4 represents estimated mean tropical convec-tive mass fluxes derived from an analysis of high resolution satellite images (Gettelman et al., 2002).
Figure 4 shows a substantial amount of upwelling air masses due to cirrus cloud lofting between 12 and 16 km (blue curve). Above 16 km, upwelling in clear sky becomes more important than in cirrus clouds. At 17 km, the mean altitude of the cold point tropopause, the upwelling takes predominantly place in clear sky. However, as UTTCs are extremely thin, they are not included in the LITE cloud data. Part of the upwelling near the tropopause could occur in these clouds at approximately the same rate as in clear sky, be-cause UTTCs have only a small influence on radiative heat-ing rates. The mass flux in the Brewer-Dobson circulation, transporting air into the upper stratosphere amounts to 1– 2 kg m−2day−1. It is obvious from Fig. 4 that a combina-tion of cloud lofting and clear sky upwelling is able to trans-port the air without the influence of deep convection from approximately 345–350 K into the stratosphere. The full sky radiatively driven mass flux (black curve) is negative up to 14 km altitude (355 K), which means that radiative processes as a whole lead to subsidence here. It must be concluded that convection is balancing this subsidence. Indeed, estimates of convective mass fluxes broadly support this conclusion (e.g., Gettelman et al., 2002; Kupper et al., 2004). The convec-tive mass fluxes based on Gettelman et al. (2002) are shown in Fig. 4. Below 350 K potential temperature, the convective mass flux exceeds radiatively driven upwelling in clouds. Be-tween 350 and 360 K, radiatively driven upwelling in clouds becomes more important than convective transport. Above, radiative processes as a whole dominate the upwelling.
345
11.0
Q
cloudy= 0
350
13.0
360
15.0
370
16.0
380
17.0
Altitude / km
Potential Temperature / K
Cold Point Tropopause
Q
clear= 0
Clear sky upwelling
In cloud upwelling
390
17.5
~15 days ~ 50 days hours420
18.5
~125 daysFig. 5. Schematic of troposphere-to-stratosphere transport pathway. Left: Deep convection of moderate strength up to about 350 K. Center:
In-cloud upwelling to 370 K. Right: Upwelling in clear sky or in optically in optically very thin cloud through the cold point tropopause into the lower stratosphere. Red numbers indicate typical transport times from the boundary layer to different levels.
5 Conclusions
Based on the results presented in the previous section, we conclude that the following pathway for TST, outlined in Fig. 5, is plausible. Deep convection transports air from the boundary layer to approximately 13 km (350 K) within min-utes to hours. Part of the outflow remains in cirrus clouds and is radiatively heated and lifted further.
Assuming typical mean heating rates of 1.5 K day−1 (Fig. 3), air reaches 370 K potential temperature after about 15 days, if it stays inside cirrus clouds for most of the time. At this altitude, upwelling in clear sky becomes about as im-portant as in cirrus clouds (Fig. 4). Air will therefore typi-cally ascend at a slower rate than lower down. The mean full sky heating rate amounts to 0.6 K day−1 between 370 and
390 K and then decreases to 0.4 K day−1at 420 K. From this we estimate total transport times of 50 and 125 days from the boundary layer to 390 and 420 K, respectively. These values agree well with the transport times derived from tracer measurements, namely 60±20 days and 110±30 days on 390 and 420 K, respectively (Boering et al., 1994; Andrews et al., 1999).
The mass flux involved in the proposed transport mecha-nism is large enough to supply the lower stratosphere with sufficient air to feed the Brewer-Dobson circulation. It there-fore eliminates the need for convective overshooting to occur frequently. Moreover, the apparent discrepancy between ob-servations and theory disappears.
The level of zero clear sky radiative heating (Qclear=0),
located at 15 km, is generally regarded as a barrier for TST which has to be overcome by convection. Our results however demonstrate that outflow from convection reaching about 13 km can be lifted towards the cold point tropopause due to cloud lofting. Therefore, the Qclear=0 level is not a
barrier for upwelling outside of convection.
In summary, our results give strong evidence that cirrus cloud lofting is a key element for understanding tropical TST. However, it should be noted that further work is needed to corroborate this finding: First, it is difficult to deduce path-ways of individual air parcels from the cloud data and de-rived radiative heating rates. The insights may be obtained from trajectory studies similar to that of Jensen and Pfis-ter (2004) including cloud-radiation inPfis-teractions. Second, cloud-resolving model studies of cloud lofting will be use-ful to investigate in detail how the radiative heating affects clouds of different spatial extent and specifically how it af-fects their lifetime. Finally, direct observation of cloud loft-ing could provide better evidence. This is, however, not an easy task, as cloud lofting is a relatively slow diabatic pro-cess, masked by stronger adiabatic processes, mostly from waves.
Acknowledgements. ISCCP and LITE data were obtained from
the NASA Langley Research Center Atmospheric Sciences Data Center. SHADOZ data were provided through the database available at http://croc.gsfc.nasa.gov/shadoz/. UKMO temperature
2546 T. Corti et al.: Cirrus and troposphere-to-stratosphere transport
data and NOAA/NCDC radiosonde data were provided through the SPARC Data Center at http://www.sparc.sunysb.edu/. T. Corti is supported by the Swiss Federal Office for Education and Science as part of TROCCINOX and SCOUT-O3. Q. Fu is supported by NASA Grants NNG04GM23G and NNG05GA19G.
Edited by: B. K¨archer
References
Ackerman, T. P., Liou, K. N., Valero, F. P. J., and Pfister, L.: Heating Rates in Tropical Anvils, J. Atmos. Sci., 45, 1606–1623, 1988. Andrews, A. E., Boering, K. A., Daube, B. C., Wofsy, S. C., Hintsa,
E. J., Weinstock, E. M., and Bui, T. P.: Empirical age spectra for the lower tropical stratosphere from in situ observations of CO2: Implications for stratospheric transport, J. Geophys. Res.-Atmos., 104, 26 581–26 595, 1999.
Boering, K. A., Daube, B. C., Wofsy, S. C., Loewenstein, M., Podolske, J. R., and Keim, E. R.: Tracer-Tracer Relationships and Lower Stratospheric Dynamics – CO2 and N2O Correlations During Spade, Geophys. Res. Lett., 21, 2567–2570, 1994. Chepfer, H., Pelon, J., Brogniez, G., Flamant, C., Trouillet, V., and
Flamant, P. H.: Impact of cirrus cloud ice crystal shape and size on multiple scattering effects: application to spaceborne and air-borne backscatter lidar measurements during LITE mission and E LITE campaign, Geophys. Res. Lett., 26, 2203–2206, 1999. Comstock, J. M., Ackerman, T. P., and Mace, G. G.: Ground-based
lidar and radar remote sensing of tropical cirrus clouds at Nauru Island: Cloud statistics and radiative impacts, J. Geophys. Res.-Atmos., 107, 4714, doi:10.1029/2002JD002203, 2002.
Corti, T., Luo, B. P., Peter, T., Vomel, H., and Fu, Q.: Mean ra-diative energy balance and vertical mass fluxes in the equatorial upper troposphere and lower stratosphere, Geophys. Res. Lett., 32, L06 802, 2005.
Folkins, I. and Martin, R. V.: The vertical structure of tropical con-vection and its impact on the budgets of water vapor and ozone, J. Atmos. Sci., 62, 1560–1573, 2005.
Folkins, I., Oltmans, S. J., and Thompson, A. M.: Tropical convec-tive outflow and near surface equivalent potential temperatures, Geophys. Res. Lett., 27, 2549–2552, 2000.
Fu, Q. and Liou, K. N.: On the Correlated K-Distribution Method for Radiative-Transfer in Nonhomogeneous Atmospheres, J. At-mos. Sci., 49, 2139–2156, 1992.
Fu, Q. and Liou, K. N.: Parameterization of the Radiative Properties of Cirrus Clouds, J. Atmos. Sci., 50, 2008–2025, 1993. Fu, Q., Yang, P., and Sun, W. B.: An accurate parameterization
of the infrared radiative properties of cirrus clouds for climate models, J. Climate, 11, 2223–2237, 1998.
Fu, Q. A.: An accurate parameterization of the solar radiative prop-erties of cirrus clouds for climate models, J. Climate, 9, 2058– 2082, 1996.
Gettelman, A., Salby, M. L., and Sassi, F.: Distribution and influ-ence of convection in the tropical tropopause region, J. Geophys. Res.-Atmos., 107, 4080, doi:10.1029/2001JD001048, 2002. Gettelman, A., Forster, P. M. D., Fujiwara, M., Fu, Q., Vomel, H.,
Gohar, L. K., Johanson, C., and Ammerman, M.: Radiation bal-ance of the tropical tropopause layer, J. Geophys. Res.-Atmos., 109, D07 103, doi:10.1029/2003JD004190, 2004.
Hartmann, D. L., Holton, J. R., and Fu, Q.: The heat balance of the tropical tropopause, cirrus, and stratospheric dehydration, Geo-phys. Res. Lett., 28, 1969–1972, 2001.
Haynes, P. H., Marks, C. J., McIntyre, M. E., Shepherd, T. G., and Shine, K. P.: On the Downward Control of Extratropical Dia-batic Circulations by Eddy-Induced Mean Zonal Forces, J. At-mos. Sci., 48, 651–679, 1991.
Holton, J. R., Haynes, P. H., McIntyre, M. E., Douglass, A. R., Rood, R. B., and Pfister, L.: Stratosphere-Troposphere Ex-change, Rev. Geophys., 33, 403–439, 1995.
Jensen, E. and Pfister, L.: Transport and freeze-drying in the trop-ical tropopause layer, J. Geophys. Res.-Atmos., 109, D02 207, doi:10.1029/2003JD004022, 2004.
Kelly, K. K., Proffitt, M. H., Chan, K. R., Loewenstein, M., Podolske, J. R., Strahan, S. E., Wilson, J. C., and Kley, D.: Water-Vapor and Cloud Water Measurements over Darwin Dur-ing the Step 1987 Tropical Mission, J. Geophys. Res.-Atmos., 98, 8713–8723, 1993.
Kupper, C., Thuburn, J., Craig, G. C., and Birner, T.: Mass and water transport into the tropical stratosphere: A cloud-resolving simulation, J. Geophys. Res.-Atmos., 109, D10 111, doi:10.1029/2004JD004541, 2004.
Lilly, D. K.: Cirrus Outflow Dynamics, J. Atmos. Sci., 45, 1594– 1605, 1988.
Liou, K.: Radiation and Cloud Processes in the Atmosphere, Ox-ford University Press, 1992.
Luo, B. P., Peter, T., Fueglistaler, S., Wernli, H., Wirth, M., Kiemle, C., Flentje, H., Yushkov, V. A., Khattatov, V., Rudakov, V., Thomas, A., Borrmann, S., Toci, G., Mazzinghi, P., Beuer-mann, J., Schiller, C., Cairo, F., Di Donfrancesco, G., Adriani, A., Volk, C. M., Strom, J., Noone, K., Mitev, V., MacKen-zie, R. A., Carslaw, K. S., Trautmann, T., Santacesaria, V., and Stefanutti, L.: Dehydration potential of ultrathin clouds at the tropical tropopause, Geophys. Res. Lett., 30, 1557, doi:10.1029/2002GL016737, 2003.
McCormick, M. P., Winker, D. M., Browell, E. V., Coakley, J. A., Gardner, C. S., Hoff, R. M., Kent, G. S., Melfi, S. H., Men-zies, R. T., Platt, C. M. R., Randall, D. A., and Reagan, J. A.: Scientific Investigations Planned for the Lidar in-Space Technol-ogy Experiment (Lite), Bull. Amer. Meteorol. Soc., 74, 205–214, 1993.
McFarquhar, G. M., Heymsfield, A. J., Spinhirne, J., and Hart, B.: Thin and subvisual tropopause tropical cirrus: Observations and radiative impacts, J. Atmos. Sci., 57, 1841–1853, 2000. Miller, S. D. and Stephens, G. L.: Multiple scattering effects in the
lidar pulse stretching problem, J. Geophys. Res.-Atmos., 104, 22 205–22 219, 1999.
Peter, T., Luo, B. P., Wirth, M., Kiemle, C., Flentje, H., Yushkov, V. A., Khattatov, V., Rudakov, V., Thomas, A., Borrmann, S., Toci, G., Mazzinghi, P., Beuermann, J., Schiller, C., Cairo, F., Di Donfrancesco, G., Adriani, A., Volk, C. M., Strom, J., Noone, K., Mitev, V., MacKenzie, R. A., Carslaw, K. S., Traut-mann, T., Santacesaria, V., and Stefanutti, L.: Ultrathin Tropical Tropopause Clouds (UTTCs): I. Cloud morphology and occur-rence, Atmos. Chem. Phys., 3, 1083–1091, 2003,
http://www.atmos-chem-phys.net/3/1083/2003/.
Plumb, R. A.: Stratospheric transport, J. Meteorol. Soc. Jpn., 80, 793–809, 2002.
Ramaswamy, V. and Ramanathan, V.: Solar Absorption by Cirrus
Clouds and the Maintenance of the Tropical Upper Troposphere Thermal Structure, J. Atmos. Sci., 46, 2293–2310, 1989. Rossow, W. B. and Schiffer, R. A.: Advances in understanding
clouds from ISCCP, Bull. Amer. Meteorol. Soc., 80, 2261–2287, 1999.
Sherwood, S. C. and Dessler, A. E.: A model for transport across the tropical tropopause, J. Atmos. Sci., 58, 765–779, 2001. Sherwood, S. C. and Dessler, A. E.: Convective mixing near the
tropical tropopause: Insights from seasonal variations, J. Atmos. Sci., 60, 2674–2685, 2003.
Slingo, A.: A Gcm Parameterization for the Shortwave Radiative Properties of Water Clouds, J. Atmos. Sci., 46, 1419–1427, 1989. Sobel, A. H., Nilsson, J., and Polvani, L. M.: The weak temperature gradient approximation and balanced tropical moisture waves, J. Atmos. Sci., 58, 3650–3665, 2001.
Thompson, A. M., Witte, J. C., McPeters, R. D., Oltmans, S. J., Schmidlin, F. J., Logan, J. A., Fujiwara, M., Kirchhoff, V., Posny, F., Coetzee, G. J. R., Hoegger, B., Kawakami, S., Ogawa, T., Johnson, B. J., Vomel, H., and Labow, G.: Southern Hemisphere Additional Ozonesondes (SHADOZ) 1998-2000 tropical ozone climatology – 1. Comparison with Total Ozone Mapping Spec-trometer (TOMS) and ground-based measurements, J. Geophys. Res.-Atmos., 108, 8238, doi:10.1029/2001JD000967, 2003a.
Thompson, A. M., Witte, J. C., Oltmans, S. J., Schmidlin, F. J., Lo-gan, J. A., Fujiwara, M., Kirchhoff, V., Posny, F., Coetzee, G. J. R., Hoegger, B., Kawakami, S. J., Ogawa, T., Fortuin, J. P. F., and Kelder, H. M.: Southern Hemisphere Additional Ozoneson-des (SHADOZ) 1998–2000 tropical ozone climatology – 2. Tro-pospheric variability and the zonal wave-one, J. Geophys. Res.-Atmos., 108, 8241, doi:10.1029/2002JD002241, 2003b. Volger, P., Liu, Z. Y., and Sugimoto, N.: Multiple scattering
simu-lations for the Japanese space lidar project ELISE, IEEE Trans. Geosci. Remote Sensing, 40, 550–559, 2002.
Vomel, H., Oltmans, S. J., Johnson, B. J., Hasebe, F., Shiotani, M., Fujiwara, M., Nishi, N., Agama, M., Cornejo, J., Paredes, F., and Enriquez, H.: Balloon-borne observations of water vapor and ozone in the tropical upper troposphere and lower stratosphere, J. Geophys. Res.-Atmos., 107, 4210, doi:10.1029/2001JD000707, 2002.
Winker, D. M., Couch, R. H., and McCormick, M. P.: An overview of LITE: NASA’s lidar in-space technology experiment, Proc. IEEE, 84, 164–180, 1996.
Zhang, C. D., Mapes, B. E., and Soden, B. J.: Bimodality in tropical water vapour, Q. J. R. Meteorol. Soc., 129, 2847–2866, 2003.