HAL Id: hal-00316887
https://hal.archives-ouvertes.fr/hal-00316887
Submitted on 1 Jan 2001
HAL is a multi-disciplinary open access
archive for the deposit and dissemination of
sci-entific research documents, whether they are
pub-lished or not. The documents may come from
teaching and research institutions in France or
abroad, or from public or private research centers.
L’archive ouverte pluridisciplinaire HAL, est
destinée au dépôt et à la diffusion de documents
scientifiques de niveau recherche, publiés ou non,
émanant des établissements d’enseignement et de
recherche français ou étrangers, des laboratoires
publics ou privés.
atmosphere seen by and deduced from MF, HF and
VHF radar, with special emphasis on small-scale
features and anisotropy
W. K. Hocking, J. Röttger
To cite this version:
W. K. Hocking, J. Röttger. The structure of turbulence in the middle and lower atmosphere seen
by and deduced from MF, HF and VHF radar, with special emphasis on small-scale features and
anisotropy. Annales Geophysicae, European Geosciences Union, 2001, 19 (8), pp.933-944.
�hal-00316887�
Annales Geophysicae (2001) 19: 933–944 c European Geophysical Society 2001
Annales
Geophysicae
The structure of turbulence in the middle and lower atmosphere
seen by and deduced from MF, HF and VHF radar, with special
emphasis on small-scale features and anisotropy
W. K. Hocking1and J. R¨ottger2
1Dept. of Physics and Astronomy, University of Western Ontario, London, Ont. N6A 3K7, Canada 2Max-Planck-Institut f¨ur Aeronomie, Katlenburg-Lindau, Germany
Received: 23 October 2000 – Revised: 11 June 2001 – Accepted: 10 July 2001
Abstract. An overview of the turbulent structures seen by
MF, HF and VHF radars in the troposphere, stratosphere and mesosphere is presented, drawing on evidence from previous radar measurements, in situ studies, laboratory observations, observations at frequencies other than those under focus, and modeling studies. We are particularly interested in structures at scales less than one radar pulse length, and smaller than the beam width, and especially the degree of anisotropy of tur-bulence at these scales. Previous radar observations are es-pecially important in regard to the degree of anisotropy, and we highlight the role that these studies have had in furthering our understanding in this area. The contrasts and similarities between the models of anisotropic turbulence and specular reflection are considered. The need for more intense studies of anisotropy at MF, HF and VHF is especially highlighted, since this is an area in which these radars can make impor-tant contributions to the understanding of atmospheric turbu-lence.
Key words. Meteorology and atmospheric dynamics
(turbu-lence) – Atmospheric composition and structure (instruments and techniques) – History of geophysics (atmospheric sci-ences)
1 Introduction
Radars depend on scatter or reflection from perturbations in radio refractive index in order for them to be able to func-tion as tools for atmospheric studies. Turbulence, both in the neutral atmosphere and in ionized parts of the air, is one way by which such perturbations are produced. Our inten-tion in this article is to develop a picture of the structure of turbulence as seen by MF, HF and VHF radars in the upper troposphere, the stratosphere and the mesosphere. We will draw our evidence from a variety of sources, especially con-centrating on (but not restricting ourselves to) previous radar
Correspondence to: W. K. Hocking
observations. Thus, the article serves not only as a way to describe the characteristics of turbulence as seen by radars at these frequencies, but also chronicles the contributions of these radars to understanding the small-scale structures in-herent within the turbulence. We also recognize that an on-going debate exists in regard to the relative contributions of turbulent scatter and specular reflection in VHF radar stud-ies, and we will return to this issue later. For now, we simply recognize that turbulent scatter does exist at least some of the time, and in this article, we choose to focus for the most part on this type of scatter. We will discuss here only turbulence in the neutral atmosphere. Scatter from plasma turbulence and plasma waves in the ionosphere will not be covered we refer to Sahr and Fejer (1996) for a corresponding review of ionospheric turbulence.
Before beginning, we first need to define what we mean by the concept of turbulence within this article. We con-sider turbulence to be quasi-chaotic, non-linear, partly rota-tional atmospheric motions which produce inhomogeneities in density and temperature (and other parameters such as hu-midity and pressure) that lack a dominant coherent structure and which can best be described in terms of statistics and correlation functions. The quasi-random motions which en-sue within a patch of turbulence, and the subsequent temper-ature and density (and other) variations produce refractive index inhomogeneities which are responsible for backscat-ter of radio waves. The refractive index perturbations can be represented as a spectrum, with certain critical scales defin-ing the limits of the turbulence. Important scales include the Kolmogoroff microscale, which defines the regime where the scales are heavily damped due to viscous heat losses, and the buoyancy scale, which defines the typical scales at which the turbulence is generated. Turbulence is considered here to be generally the result of a non-linear breakdown of larger, more organized structures which have become unsta-ble, with scales comparable to or larger than the buoyancy scale. Our definition of turbulence includes the cases of growing, steady-state and decaying turbulence, although we recognize that many theories of turbulence concentrate only
on the steady-state.
When we talk here about scales of turbulence, we need to recognize that radar backscatter results from scales in the turbulence spectrum (which in turn determines the radio re-fractive index variation spectrum), which are equal to one-half of the radar wavelength (the so-called Bragg scale). The backscattered power is the ensemble average over the total illuminated volume, often (but not always) consisting of a multitude of so-called “scatterers”. Such scatterers can be quite arbitrarily and inhomogeneously distributed in the vol-ume, and the volume filled by the scatterers is usually much larger than the Bragg scale. The radars cannot normally resolve turbulence structures at the Bragg scale itself, but they can sometimes resolve scales which are larger than the Bragg scale but smaller than the volume filled by the tur-bulence. The actual resolution is often defined by the radar pulse length, but on occasions, with suitable special tech-niques, it is possible to do better. These special techniques are noted in this article, together with the description of the radar-observed structures and their morphology.
Radars have been especially good for looking at the larger-scale nature of atmospheric turbulence and particular coher-ent structures, and these results will be described here. How-ever, despite the strong dependence of radar backscatter on turbulence, it has, in fact, been rather difficult to deduce cer-tain other types of information about turbulence from these radar studies. This is especially true with respect to studies at very small scales, particularly at sizes less than the pulse length used by the radar. Therefore, many of the most useful studies have incorporated a mixture of special radar observa-tions, in situ studies, and careful deduction.
2 Large-scale studies (>100m)
Perhaps the most obvious feature that is clear from radar studies is the horizontally striated nature of atmospheric tur-bulence, at least at scales of more than a few hundred metres. Figure 1a shows some radar observations of the mesosphere carried out by Czechowsky et al. (1979). The stratified nature of the scatter is quite evident; this is very common. For com-parison, Fig. 1b (from Bondarev et al., 1992) shows some in situ smoke trails released simultaneously by 4 rockets into the atmosphere (in this case, the results refer to the strato-sphere). The layering in the wind-field is quite evident, with adjacent trails very similar in shape. Figure 1c shows more radar observations of thin layers, also called sheets or lami-nae, in this case for the troposphere and lower stratosphere (Hocking and R¨ottger, 1983). It is clear that layered and stratified phenomena are common in the atmosphere. Sim-ilar results have been observed using rocket releases in the mesosphere (e.g. Blamont and Barat, 1967).
Radars have played an important role in demonstrating the prevalence of atmospheric stratification. When combined with suitable modeling studies, it is even possible to make some estimate of the expected degree of stratification and structure in the atmosphere. Figure 1b shows not only a high
level of stratification, but also evidence for wave-like struc-tures in the wind-field. These are associated with a spectrum of gravity waves (e.g. Van Zandt, 1982; Hines, 1991a, b). The interactions between these waves, and with the back-ground wind-field, are often responsible for the generation of turbulence in the mesosphere and stratosphere. (Indeed, radar studies of wind fluctuations played a very important role in establishing the importance of gravity waves in the atmosphere, but that topic is beyond the scope of this arti-cle.) If it is assumed that these waves satisfy a so-called “universal spectrum”, and that there are many waves prop-agating up and down with various (random) phases, then the velocity and temperature fields associated with these waves will add in such a way that, on occasion, they will produce a regime in which turbulence will naturally develop (Richard-son number less than 0.25). It is possible to produce a statis-tical investigation of the likelihood of such levels developing, and thereby obtain a statistical summary of the likely depths of these layers, their frequency of occurrence, and their likely vertical spacing. Figure 2 shows an example of such statistics (Hocking, 1991, after adaptation from Desaubies and Smith, 1982). Similar calculations have been performed by Fairall et al. (1991) for the troposphere, and by Hines (1991a, b, c) for the mesosphere.
Radars have not only been useful in helping us understand the distribution of turbulence, but have also been useful in helping to measure the energy dissipation rates associated with it (e.g. for reviews of these methods, which involve both absolute power measurements and spectral-width determina-tions, see Hocking and Mu, 1997; Hocking, 1999). Radars can also be used to parameterize the processes of diffusion in the atmosphere. While we will not consider this application in any detail here since the focus of the paper is related to the structure of turbulence, there is one aspect related to the issue of diffusion that we do wish to discuss, and this is the mechanism of diffusion itself, since it relates closely to the issue of the spatial and temporal morphology of turbulence in the atmosphere.
Particulates and chemicals may diffuse across a patch of turbulence in the classically accepted manner, being driven along a “random walk” by the velocity field embodied in the turbulence. However, this only permits counter-gradient dif-fusion across the layer itself. What about difdif-fusion over ver-tical scales much deeper than a typical layer thickness? How can diffusion occur over such large scales? To understand this process, we must return to Fig. 2. Layers of the type shown in Fig. 2a form at various intervals of time, and have various lifetimes. Diffusion can occur across such a layer, but once a particle diffuses to the edges, it can go no further. It then waits until, purely by chance, another layer forms on top of the particle, but displaced vertically relative to the pre-vious layer. Diffusion may then occur across this new layer, until the particle reaches an upper or lower edge (depend-ing on the direction of diffusion) or until the layer dissipates. Thus, the rate of vertical diffusion over scales deeper than the typical layer depths depends on factors including the depth of the layers, and the frequency of occurrence of the layers, (as
W. K. Hocking and J. R¨ottger: Structure of turbulence in the middle and lower atmosphere 935
Fig. 1. (a) Illustration of stratification of radar echoes at VHF (from Czechowsky et al., 1979). (b) Evidence of horizontal stratification of
atmospheric winds using in situ techniques (smoke trails). (c) Stratification of persistent thin sheets in the troposphere and lower stratosphere (from Hocking and R¨ottger, 1983).
well as the strength of turbulence within the layers). More details about this process can be found in Dewan (1981), Woodman and Rastogi (1984), and Hocking (1991, 1999), among others. This understanding of turbulent diffusion has been developed, in part, due to the contributions of radar ob-servations which offer one of the best tools to implement cal-culations of diffusion in this manner, as described by Wood-man and Rastogi (1984).
3 Intermediate-scale studies (∼1 m - 100 m)
While radars have made important contributions to our un-derstanding of the large-scale structure of turbulence, they have also made contributions at smaller scales. Interestingly, this has been a difficult challenge, since it often involves ex-amination of scales which are less than the radar pulse length. Various specialized techniques must be employed in order for scales of the order of 10 m or less to be resolved, includ-ing techniques like frequency- domain interferometry (FDI), which is a simplified FM/CW radar techique, as well as more sophisticated deconvolution procedures.
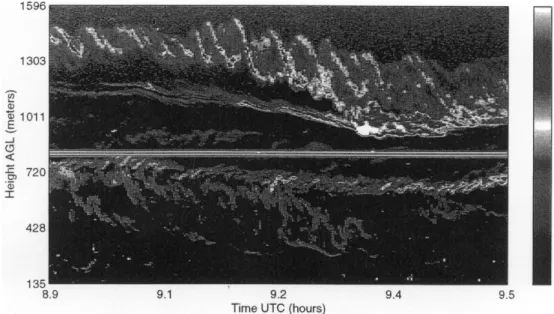
It is even possible to look at metre-size scales if a radar has a sufficiently high frequency, with a correspondingly short wavelength. At these higher frequencies, large band-widths are possible, thereby allowing very good range res-olution. For example, powerful FM-CW radars have been used to obtain high resolution studies of turbulent events in the atmospheric boundary layer (e.g. Gossard et al., 1970, 1978; Eaton et al., 1995). Figures 3 and 4 show exam-ples of such observations taken from Eaton et al., (1995); these figures are very informative, and show excellent resolu-tion. The radar used to create these pictures works at a much higher frequency than the ones under general discussion in this review, but we have already indicated that we will utilize
data from other frequencies if it helps us to understand the processes which are observed within the MF, HF and VHF bands. These images clearly help us visualize these smaller scales. However, such images are generally only possible in the lowest few kilometres of the atmosphere, since the radars used for these studies receive very little backscatter from higher altitudes. Hence, there is also the possibility that some of these results are specific to the atmospheric bound-ary layer and lower levels of the troposphere. Nevertheless, there are still some features which we can find useful.
First, the figures do demonstrate that “cat’s-eye” struc-tures are not uncommon in the atmosphere as a precursor to turbulence breakdown (Fig. 3), and such structures are of-ten associated with Kelvin-Helmholtz (K-H) billows. How-ever, some caution is needed with regard to this observa-tion. It needs to be kept in mind that K-H need not be the only mechanism responsible for the formation of cat’s-eye billows; Smyth and Peltier (1989) have indicated that other mechanisms, such as the Holmboe instability, can also gen-erate such structures. Indeed, K-H instabilites are only dom-inant in weakly stratified flows, whereas the Holmboe insta-bility is more likely in strongly stratified flows.
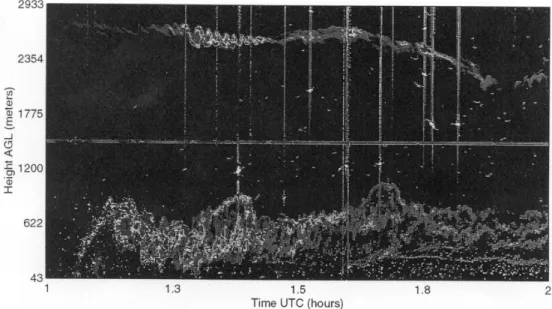
Second, we see from Fig. 4 that there can be occasions when other mechanisms of breakdown can be responsible for the turbulence; the formation of cat’s-eye structures is only one possible mechanism. Cat’s-eye structures are visually impressive, so they tend to dominate the literature, but it is not clear whether they are in fact the main mode of turbu-lence breakdown at all.
Thus, while high-resolution studies of the type shown in Figs. 3 and 4 are very useful, it is still not clear how rele-vant these boundary layer studies are to understanding tur-bulence generation in the stratosphere and mesosphere. Cho et al. (1996) have made higher level, high-resolution
stud-Fig. 2. (a) Another example of stratified radar echoes. (b) Typical profiles of Brunt-Vaisala frequency, wind shears, and resultant Richardson
numbers, for a sample gravity wave field. (c) Distribution of the thicknesses of layers of turbulence expected in the stratosphere. Scales are only representative, and somewhat larger in the mesosphere than in the stratosphere. (d) Histogram of expected layer spacings. These figures have been adapted from Hocking (1991).
W. K. Hocking and J. R¨ottger: Structure of turbulence in the middle and lower atmosphere 937
Fig. 3. FMCW radar images of low level turbulence, in this case, showing Kelvin-Helmholtz billows (from Eaton et al., 1995).
ies using astronomical telescopes working at a frequency of 2320 MHz, and Woodman (1980) has used the Arecibo 2380 MHz radio telescope to perform high-resolution studies of stratospheric layers; such studies are rare. Nevertheless, we recognize that radars are at least able to make some useful studies of turbulence breakdown at high-resolution, and have already been very useful in this regard. More of such studies are very much needed. It is especially important to develop statistics about the probabilities of turbulence generation by different mechanisms, free of any preconceived theoretical biases. This remains a topic for future experimental studies.
We now return to the focus of this paper, which is radars operating in the frequency range between 2 MHz and 300 MHz (MF to VHF). These radars cannot achieve the resolu-tion of FM/CW radars operating in the Gigaherz frequency range (discussed above), but they can achieve a better height coverage. VHF radars can detect signals as high as 90 km in altitude in the middle atmosphere. These radars are of-ten pulsed, with pulse-lengths in the range of 150 m to 2 km. Normally these radars cannot resolve structure at scales less than the pulse length. However, there are certain procedures which can be used to improve the resolution under certain cir-cumstances. One example is shown in Fig. 5, which demon-strates the application of deconvolution procedures (R¨ottger and Schmidt, 1979).
Reid et al. (1987) have shown high-resolution studies of cat’s-eye like structures in the mesosphere using a VHF radar. Other procedures also exist to achieve better spatial resolution, such as FDI (Frequency Domain Interferometry, e.g. Kudeki and Stitt, 1987; Chilson et al., 1996, among others), SDI (Spatial Domain Interferometry, e.g. Pan and R¨ottger, 1996; Hocking, 1997) and newly developed signal processing methods (e.g. Luce et al., 2000; Palmer et al., 2000). However, it should also be noted that the advantages of improved vertical resolution can be negated if there is not
a corresponding improvement in horizontal resolution, and the ideal procedure would be to apply both FDI and SDI si-multaneously to produce improvements in both vertical and horizontal resolution (see R¨ottger et al., 2000).
4 Small-scale studies (metres and less)
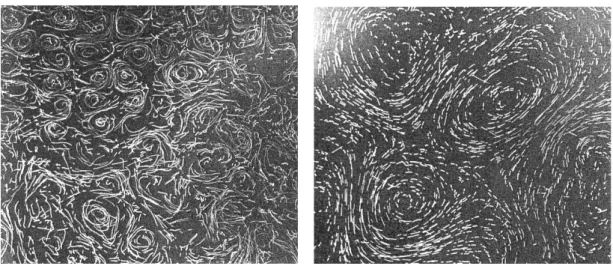
At scales of metres and less, radars provide even less direct information than at intermediate scales. Nevertheless, these scales are still of great interest. As an example of the types of motions which we would like to observe, Fig. 6 shows streak-photographs of small-scale motions taken in a labo-ratory setting (in this case, for two-dimensional turbulence, so it may not be entirely representative of small-scale atmo-spheric turbulence). Eddy motions are clear in both figures, and some ellipticity is evident in some eddies. It is important to know just how representative these pictures are of atmo-spheric processes at scales of a metre and less. Can radars reveal anything about the motions at these smallest scales? We have seen that FM CW radars can provide information about backscattered or partially reflected powers at scales approaching this resolution, but they have yet to produce ve-locity maps at such scales. What about VHF and lower fre-quency radars? Can they provide any information at these scales? In fact, they can, at least indirectly, and one area in which radars have made very important contributions is in the area of anisotropy studies.
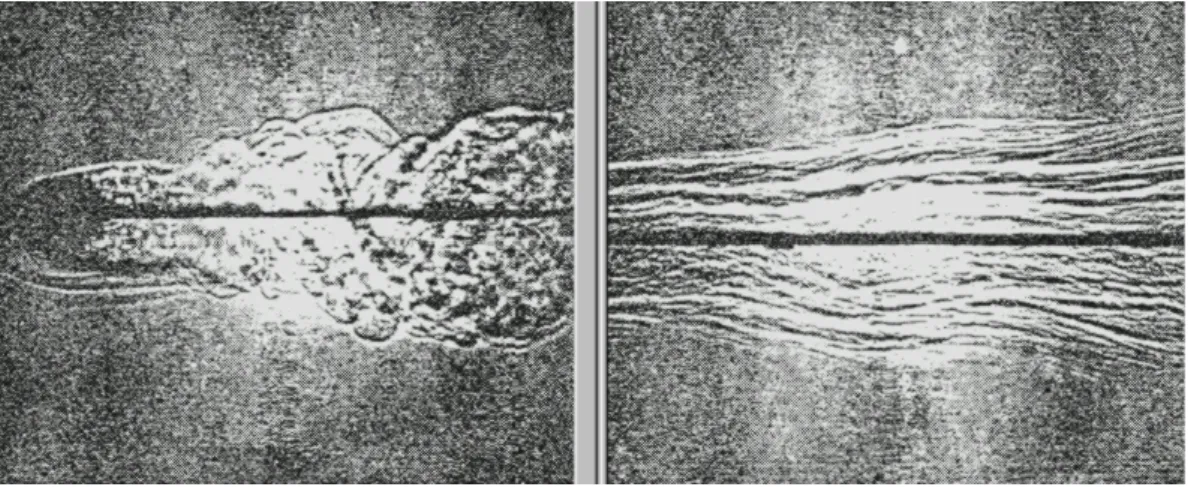
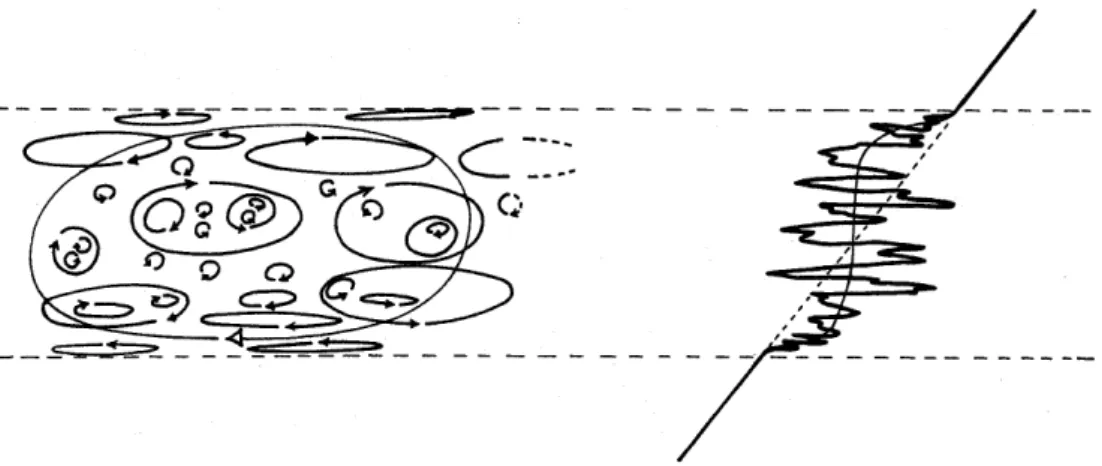
To demonstrate the issue at hand here, we show Fig. 7. This figure (adapted from Pao, 1968) shows flow around an object in salt-stratified water, at points close to the object as well as further downstream, and the point to be emphasized here is the way in which the turbulence tends to “striate” and stratify as it dies out. The initial active turbulence is clearly isotropic at the smaller scales, while the turbulence which
Fig. 4. Another FMCW radar image of low level turbulence, in this case, showing frontal turbulence with no sign of K-H billows (again
adapted from Eaton et al., 1995). The entire picture covers a period of one hour in duration, and covers the height range from a 40 metre altitude to 1.8 km altitude.
Fig. 5. Results of the application of deconvolution procedures to achieve sub-pulse-length resolution with a VHF radar. Cat’s-eye structures
are evident.
persists further downstream (which may be either steady-state or decaying) is more anisotropic. Therefore, we ask the question: to what level do we expect atmospheric turbulence to be isotropic? Do the “eddies” shown in Fig. 6 form, and if so, do they exhibit any form of anisotropy, i.e. do they tend to be elongated horizontally relative to their vertical extent? This is an area where radar studies have made substantial contributions.
To understand the contributions of radars in this field, it is necessary to show how “eddy anisotropy” is parameter-ized; this is illustrated in Fig. 8a. As seen in Fig. 6, velocity trajectories are often elliptical in shape, but individual refrac-tive index “entities” (radio-scatterers) are not always so orga-nized. Even an initially “organized” shape is quickly torn in various directions by the underlying velocity field, so that in-dividual refractive index “entities” within a turbulent region often have stretched and distorted string-like shapes just as one can see different “shapes” and structures within an ordi-nary water vapour cloud. Hocking and Hamza (1997) have discussed this process in some detail. However, despite the fact that individual entities may be distorted in shape, the spa-tial correlation function of the refractive index fluctuations
does have a broadly elliptical shape with a smoothly varying cross section, where the cross sectional profile is often as-sumed to be Gaussian. In determining the general properties of radar backscatter, it is often this correlation function which is most important (e.g. see Doviak and Zrnic, 1984). Thus, we often represent atmospheric radio-wave scatterers as if they were ellipsoids, since the spatial correlation function of a field of ellipsoidal scatterers with Gaussian cross section is also an ellipsoidal function with Gaussian cross section. Thus, we can represent the refractive index fluctuations in a turbulent field as if it were comprised of such structures, as shown in Fig. 8a (also see de Wolfe, 1983).
The eddies which are most effective at producing radar backscatter are those with vertical dimensions of the order of 0.1 to 0.5 radar wavelengths (which contain significant Fourier components at the Bragg scale). Larger and smaller structures are very inefficient scatterers. Hence, studies of the degree of anisotropy of backscatter allow us to investi-gate the structure of the turbulence at scales which are below the radar wavelength, and comparable with the Bragg scales (e.g. see Hocking 1987a). When we recognize that such anisotropy exists, then it also becomes clear that a
mono-W. K. Hocking and J. R¨ottger: Structure of turbulence in the middle and lower atmosphere 939
Fig. 6. Streak photography images of small-scale turbulence (in this case, the graphs are for two-dimensional turbulence). The graphs refer
to different conditions of stability; from Hopfinger (1987), who adapted it from Maxworthy et al. (1985).
static radar will produce backscattered power that varies as a function of the beam bore direction.
When the radar beam is pointed vertically, backscattered power will be at a maximum, whilst backscattered power de-creases with increasing zenith angles as the beam is pointed further and further off vertical. This is very common for radars operating at wavelengths of larger than a few me-tres with antenna beams pointing at or close to the verti-cal. Such aspect sensitivity has so far not been detected with radars working at wavelengths of less than about one me-tre. For scatterers of the type described, the power falls off proportionally to exp(−sin2θ/sin2θs), where θ is the angle
of tilt of the beam from vertical, and θs is referred to as the
“aspect-sensitivity” parameter. Smaller values of θs refer to
more anisotropic scatterers, when the ratio L/ h (Fig. 8a) is largest. By measuring the power received as a function of angle, it is possible to determine this parameter. Other meth-ods may also be used which involve comparison of signal characteristics recorded with radar beams pointed at differ-ent zenithal angles. An example of such measuremdiffer-ents is shown in Fig. 8b, in this case for a 2 MHz radar. More ex-tensive discussions of the conversions between L/ h and θs
can be found in Hocking (1987a), Lesicar et al. (1994) and Hocking and Hamza (1997), among others.
A word of warning must be noted here, however. Not all atmospheric radio scatterers take the form of turbulent enti-ties. There are also other, highly structured so-called “spec-ular reflectors” in the atmosphere, which produce “mirror-like” partial reflections. In calculating θs, it is necessary to
be certain that such specular reflectors do not coexist near the turbulence, thereby contributing a non-turbulent component to the radar signal. The cause of these thin sheets or lami-nae is still uncertain, although various suggestions have been made (e.g. Hocking et al. 1991). R¨ottger (1980b) and oth-ers have suggested that it would be useful to compare such radar observations with observations of similar structures in the ocean. For an improved understanding of these
atmo-spheric structures, high-resolution radar observations, com-bined with high-resolution in situ measurements are required (e.g. Luce et al., 1995). These special reflectors were first considered as early as almost forty years ago (Beckman and Spizzichino, 1963; Atlas, 1964). Their existence and the fact that the reflection is from a rough or corrugated surface must be recognized. Further discussions about them can be found in Gage (1990), R¨ottger and Larsen (1990), Hocking et al. (1991), and Hocking (1996), among others. How these corrugated sheets and laminae are generated and how they are related to turbulence remains a challenging question to be solved. We will come back to a consideration of these questions shortly.
It has also been found that these scatterers have an azi-muthal asymmetry, and this is also an area of some interest. For example, Hocking (1987b) showed an azimuthal varia-tion of the so-called “Rice parameter” which may indicate preferential stretching of the scatterers according to the wind direction, and Tsuda et al. (1997) also found anisotropy in the backscattered power as a function of azimuth. Neverthe-less, considerable extra work is required in this area, but the point remains that radars have a lot to offer in this regard.
Thus, with due care, radars can be used to measure the de-gree of anisotropy in a turbulent regime. This is an important parameter which cannot be otherwise easily accessed. It also needs to be recognized that the aspect-sensitivity parameter is generally scale-dependent, as described by Hocking and Hamza (1997). Multiple frequency radar studies can help examine this scale dependence.
There is one further feature which needs to be recognized in regard to the turbulence anisotropy, and this is the fact that the degree of anisotropy has long been recognized to be a function of position within the turbulent layer. Several au-thors have recognized this (e.g. Peltier et al., 1978; R¨ottger et al., 1981; Hocking, 1985; Woodman and Chu, 1989; Hock-ing, 1991). Figure 9 shows one such illustration of the ex-pected variation of anisotropy across the layer, with more
Fig. 7. Photographic images of turbulence generated by a flow around an object (Pao, 1968). The left-hand panel refers to the flow close to
the object, and is clearly fairly isotropic at the smaller scales. The right panel shows the flow further downstream, as the turbulence dies out, and stratification is clearly evident.
anisotropic scatterers towards the edges. Other authors have presented similar diagrams (e.g. R¨ottger 1981; Lesicar and Hocking, 1992; Lesicar et al., 1994). Some of these delibera-tions have their origin in initial proposals by Bolgiano (1968) about the structure of the atmospheric turbulence (and espe-cially with regard to the edges of the layers). We note that the recent modelling work using super computers (Fritts et al., 1994; Werne and Fritts, 1999; Gibson-Wilde et al., 2000) just confirm these principles which had been developed and have emerged from radar observations over the past decades. Figure 10 shows the expected structure across a turbulent layer in even greater detail. This graph, adapted from Hock-ing (1991), combines data from modelHock-ing studies (Klaassen and Peltier, 1985a, b), in situ observations (Dalaudier and Sidi, 1987), and knowledge about aspect sensitivity deduced from radar observations.The right-hand profile (solid line) shows the expected mean temperature profile across a typical turbulent layer, as determined by modeling studies (Klaassen and Peltier, 1985a, b). Note, in particular, the relatively sharp edges of the layer, and the near-adiabatic conditions in the middle of the layer. The consequences of this structure are to produce more anisotropic scatterers or specular reflection at the edges, where the background temperature is horizon-tally stratified but highly fluctuating as a function of height (therefore containing large gradients), and to produce more isotropic scatterers towards the centre, where the temperature profile is closer to adiabatic. This is illustrated by the cen-tral part of the figure, which shows anisotropy at the edges and more isotropy towards the centre. The graph on the left shows the wind and temperature fluctuations measured by a balloon passing through such a turbulent layer. Note that the wind fluctuations are similar throughout the layer, but the temperature fluctuations are much larger at the edges, and smaller in the adiabatic portion. The fact that the tempera-ture fluctuations are small near the centre of the layer arise because the background temperature gradient is close to adi-abatic. This has important implications for radar scatter as
well. We will first discuss why an adiabatic mean temper-ature gradient produces small tempertemper-ature fluctuations, and then consider the implications for radar backscatter.
Consider a parcel of air embedded in the atmospheric background, and assume that the parcel and the background are identical in density, temperature, humidity and so forth. Now assume that the parcel is displaced vertically by the turbulence. It undergoes adiabatic changes in temperature and density. At the same time, the temperature of the back-ground air also changes as the height of the parcel changes, but in a manner different to that of the displaced parcel. The change in the background with increasing height depends on the mean background temperature gradient (which need not be adiabatic). The temperature fluctuations measured by a probe will depend on the difference between the tempera-ture of the displaced parcel and the immediate environment. If the mean background temperature gradient is adiabatic, there will be no difference between the temperature of the parcel and that of the background, resulting in zero (or at least small) temperature fluctuations.
Now recall that the refractive index of the air depends upon the temperature, humidity and/or electron density. Just as the temperature fluctuations observed by a probe depend on the difference in temperature between the temperatures of a displaced parcel and its surrounding medium, similarly the radar backscattered signal strength depends on the difference in the refractive index between the displaced parcel of air and the refractive index of the surrounding background air at the same height (e.g. see Hocking 1985 and references therein). If the atmosphere is dry and electron-free (as in the upper tro-posphere and stratosphere), then the refractive index depends only on the temperature, and so there will be no associated refractive index fluctuations in the case that the mean tem-perature gradient is adiabatic. Hence, the turbulent layer will be “invisible” to the radar. If a layer exists like the one in Fig. 10, then only the edges of the layer will actually be seen by a radar, giving rise to an apparent “dual layer”. Thus, one
W. K. Hocking and J. R¨ottger: Structure of turbulence in the middle and lower atmosphere 941
Fig. 8. (a) Illustration of the representation of atmospheric scatterers within a patch of turbulence. (b) Aspect sensitivity parameter θsas a
function of the month of the year for a 2MHz radar detecting scatter from an 82 km altitude in the mesosphere (from Lesicar and Hocking, 1992).
needs to take care with the interpretation that the strongest scattering layers are the layers of strongest turbulence. In-deed, sometimes the more intense turbulence layers can be the least easily seen with radar. This fact was also recently raised by Gibson-Wilde et al. (2000) using computer simu-lations, although unfortunately, these authors did not draw a parallel between their observations and the extensive ref-erences and types of discussions in the literature considered here.
5 Specular Reflections
While we have concentrated so far on the consideration of turbulence as the primary scatter mechanism, we also have commented on the importance of specular partial reflection. This review would not be complete without at least some dis-cussion about these reflectors. Observations of strongly as-pect sensitive reflections have been reported many times in the literature, (e.g. R¨ottger and Liu, 1978; Gage et al., 1978; Hocking, 1979; Fukao et al., 1979; Tsuda et al., 1986; Hock-ing et al., 1990, 1991; Hooper and Thomas, 1995), to name but a few. Observations of very slow fading times have also been associated with specular reflections.
These studies have been the subject of some controversy. At the one extreme, there have been proposals that specular reflectors are artifacts of the analysis, and all scatter is, in reality, turbulent. Proponents of this approach claim that all anisotropy is due purely to turbulent anisotropy. They cite the fact that in order for specular reflectors to occur, verti-cal steps in the refractive index of less than a quarter of the radar wavelength are required (e.g. see Hocking and R¨ottger, 1997), which must be horizontally extended over typically a Fresnel zone in size, and they consider this to be unrealistic. At the other extreme, there have been proposals which claim that almost all scatter is, in fact, a reflection from specular reflectors, and that variations in the parameter θs arise
sim-ply due to the fact that the specular reflectors have varying degrees of tilt. A superposition of specular reflectors with various tilt angles will produce a corrugated surface.
Pos-sible mechanisms to explain these specular reflectors have been given by various authors. Bolgiano (1968) considered that they might be sharp edges to turbulent layers, Van Zandt and Vincent (1983) suggested the possibility that they were short wavelength gravity waves, Hocking et al. (1991), (with an errata in Hocking, 1996) considered the importance of so-called viscosity waves, and Klostermeyer (1992) discussed the possibility that gravity- wave breakdown does not lead to chaotic motion, but leads rather to small-scale organized mo-tions via parametric instability. In this last model, the motion remains organized down to very small scales, but the super-position of the many different small-scale waves produced in this way gave the appearance of a “turbulent” region.
Experimentally, there have been a wide variety of in-terpretations of radar backscatter characteristics. Tsuda et al. (1997) attribute their observed azimuthal anisotropy en-tirely to “the characteristics of specular reflection rather than the effects of localized turbulent scattering”. Cho and R¨ottger (1997) discussed whether that polar mesospheric summer echoes contain substantial contributions from spec-ular reflections. Other observers have attributed all their ob-servations to turbulent scatter. In an attempt to delimit tur-bulent and specular reflections, Hocking and Hamza (1997) developed a formalism which related the extreme values of θs to geophysical parameters like the Richardson number. It
was possible to place lower limits on the expected values for θs under the assumption that the scatter was due to
turbu-lence. Any smaller values must have been the result of spec-ular reflection. Unfortunately, the process does not work in reverse. In principle, specular reflectors can have any value of θs; larger values are permitted simply by allowing a greater
variance in the degree of tilting or surface roughness. Hence, it must be kept in mind when considering the points raised in this paper that there is a possibility that tur-bulent scatter may not be the dominant scatter mechanism for VHF, HF and MF radars. Our own opinion is that both types of scatter exist, and care must be taken to determine which applies. Hocking (1987a) has shown examples of the simul-taneous occurrence of specular reflectors and turbulent scat-ter at MF, so it is our belief that the mechanisms of
backscat-Fig. 9. Illustration from Woodman and Chu (1989) showing a proposal for the structure of radio-wave scatterers within a turbulent layer.
More anisotropic scatterers are expected near the top and bottom of the layer. Several other similar proposals appear in various papers in the literature (see text for details).
Fig. 10. Expected behaviour of velocity, temperature, and refractive index inhomogeneities within a turbulent layer. In the left-hand two
graphs, the smoother lines represent the mean wind and temperature profiles (labelled (2)), while the more rapidly varying lines passing up through the centre (labelled (1)) represent fluctuations of the appropriate parameter about the mean. In the right-hand graph, the broken line represents an intitial temperature profile and the solid one represents the profile after the turbulence is established (from modeling studies). Note that the vertical scalings are slightly different in the left- and right-hand profiles, since each comes from a different source. We have adjusted the scalings so that the temperature profiles look similar. In between these graphs we show the shapes of “average” eddies as a function of position within the layer, demonstrating greater anisotropy at the top and bottom of the layer. See text for other details.
ter are neither exclusively turbulent, nor exclusively specular. The comments we have made within this article refer only to the cases in which turbulent backscatter is the dominant mechanism responsible for the returned signal.
6 Conclusions
By utilizing radar data, in situ data, and early modeling stud-ies, it has been possible to deduce significant information about the large- and medium-scale structure, and the internal structure of turbulent layers in the atmosphere. Radars are especially useful for displaying the large-scale morphology of turbulence, and by using sophisticated processing tech-niques, they can also be useful in describing the medium-and small-scale structures. They are especially powerful for studying the anisotropy and morphology at different scales of
turbulent atmospheric regions. This paper has concentrated especially on the contribution which radars have made to these determinations and how they can continue to contribute further. The combination of in situ and modeling techniques will certainly supplement these investigations.
Acknowledgements. Topical Editor J.-P. Duvel thanks T. E. Van Zandt and another Referee for their help in evaluating this paper.
References
Atlas, D., Advances in Radar Meteorology, in Adv. Geophys.,10, eds. Landsberg and Miegham, Academic Press, 317–478, 1964. Beckman, P. and Spizzichino, A., The scattering of electromagnetic
waves from rough surfaces, Pergamon Press, Oxford, pp. 503, 1963.
W. K. Hocking and J. R¨ottger: Structure of turbulence in the middle and lower atmosphere 943
between 80 and 120 km, from “Aurora and Airglow”, ed. B. M. McCorrmac, p. 159, Reinhold Publ. Co., 1967.
Bolgiano, R., The general theory of turbulence. Turbulence in the atmosphere, in Wind and Turbulence in Stratosphere, Meso-sphere and IonoMeso-sphere, ed. K. Rawer, North Holland Publ., Am-sterdam, 371–400, 1968.
Bondarev, V. D., Lebedinets, V. N., Prorok, V. P., and Sarkisyan, A. M., Investigation of a fine layered wind field structure in the atratosphere by the artificial luminous cloud method, Adv. Space Res., 12(10), 161–163, 1992.
Chilson, P.B. and Schmidt, G., Implementation of frequency do-main interferometry at the SOUSY VHF radar: first results, Ra-dio Sci., 31, 263–272, 1996.
Cho, J. Y. N., Jurgens, R. F., and Slade, M. A., High-resolution stratospheric dynamics measurements with the NASA/JPL Gold-stone solar system radar, Geophys. Res. Letts., 23, 1909–1912, 1996.
Cho, J. Y. N. and R¨ottger, J., An updated review of polar meso-sphere summer echoes: Observation, theory, and their relation-ship to noctilucent clouds and subvisible aerosols, J. Geophys. Res., 102, 2001–2020, 1997.
Czechowsky, P., Ruester, R., and Schmidt, G., Variations of meso-spheric structure in different seasons, Geophys. Res. Letts., 6, 459–462, 1979.
Dalaudier F. and Sidi, C., Evidence and interpretation of a spectral gap in the turbulent atmospheric temperature spectra, J. Atmos. Sci., 44, 3121–3126, 1987.
Desaubies, Y. and Smith, W. K., Statistics of Richardson number and instability in oceanic internal waves, J. Phys. Oceanography, 12, 1245–1259, 1982.
Dewan, E. M., Turbulent vertical transport due to thin intermittent mixing layers in the stratosphere and other stable fluids, Science, 211, 1041–1042, 1981.
Doviak, R. J. and Zrnic, D. S., Reflection and scatter formula for anisotropically turbulent air, Radio Sci., 19, 325–336, 1984. Eaton, F. D., McLaughlin, S. A., and Hines, J. R., A new
frequency-modulated continuous wave radar for studying planetary bound-ary layer morphology, Radio Sci., 30, 75–88, 1995.
Fairall, C. W., White, A. B., and Thomson, D. W., A stochastic model of gravity-wave-induced clear-air turbulence, J. Atmos. Sci., 48, 1771–1790, 1991.
Fritts, D. C., Isler, J. R., and Andreassen, O., Gravity wave breaking in two and three dimensions, 2, Three dimensional evolution and instability structure, J. Geophys. Res., 99, 8109–8123, 1994. Fukao, S., Sato, T., Kato, S., Harper, R. M., Woodman, R. F., and
Gordon, W. E., Mesospheric winds and waves over Jicamarca on 23–24 May 1974, J. Geophys. Res., 84, 4379–4386, 1979. Gage, K. S. and Green, J. L., Evidence for specular reflection from
monostatic VHF radar observations of the stratosphere, Radio Sci., 13, 991–1001, 1978.
Gage, K. S., Radar observations of the free atmosphere: Structure and dynamics, in Radar in Meteorology; Battan Memorial and 40t hAnniversary Radar Meteorology Conference, edited by D. Atlas, pp 534–565, Amer. Meteorol. Soc., Boston, Mass., 1990. Gibson-Wilde, D., Werne, J., Fritts, D., and Hill, R., Direct
numer-ical simulation of VHF radar measurements of turbulence in the mesosphere, Radio Sci., 35, 783–798, 2000.
Gossard, E. E., Richter, J. H., and Atlas, D., Internal waves in the at-mosphere from high-resolution radar measurements, J. Geophys. Res., 75, 3523–3536, 1970.
Gossard, E. E., Chadwick, R. B., Moran, K. P., Strauch, R. G., Mor-rison, G. E., and Campbell, W. C., Observation of winds in the
clear air using an FM-CW Doppler radar, Radio Sci., 13, 285– 289, 1978.
Hines, C. O., The saturation of gravity waves in the middle atmo-sphere. Part I: Critique of linear instability theory, J. Atmos. Sci., 48, 1348–1359, 1991a.
Hines, C. O., The saturation of gravity waves in the middle atmo-sphere. Part II: Development of Doppler-spread theory, J. Atmos. Sci., 48, 1360–1379, 1991b.
Hines, C. O., The saturation of gravity waves in the middle atmo-sphere. Part III: Formation of the Turbopause and the turbulence layers beneath it, J. Atmos. Sci., 48, 1380–1385, 1991c. Hocking, W. K., Angular and temporal characteristics of partial
re-flections from the D-region of the ionosphere, J. Geophys. Res., 64, 845–851, 1979.
Hocking, W. K. and R¨ottger, J., Pulse length dependence of radar signal strengths for Fresnel backscatter, Radio Sci., 18, 1312– 1324, 1983.
Hocking, W. K., Measurement of turbulent energy dissipation rates in the middle atmosphere by radar techniques: a review, Radio Sci., 20, 1403–1422, 1985.
Hocking, W. K., Radar studies of small scale structure in the up-per middle atmosphere and lower ionosphere, Adv. Space Res., 7(10), 327–338, 1987a.
Hocking, W. K., Reduction of the effects of non-stationarity in stud-ies of amplitude statistics of radio wave backscatter, J. Atmos. Terr. Phys., 49, 1119–1131, 1987b.
Hocking W. K., Fukao, S., Tsuda, T., Yamamoto, M., Sato, T., and Kato, S., Aspect sensitivity of stratospheric VHF radiowave scat-terers, particularly above 15 km altitude, Radio Sci., 25, 613– 627, 1990.
Hocking, W. K., The effects of middle atmosphere turbulence on coupling between atmospheric regions, J. Geomag. Geoelectr., 43, Suppl., 621–636, 1991.
Hocking, W. K., Fukao, S., Yamamoto, M., Tsuda, T., and Kato, S., Viscosity waves and thermal-conduction waves as a cause of “specular” reflectors in radar studies of the atmosphere, Radio Sci., 26, 1281–1303, 1991.
Hocking, W. K., Some new perspectives on viscosity and thermal conduction waves as a cause of “specular” reflectors in radar studies of the atmosphere, STEP Handbook, Proceedings of the Seventh Workshop on Technical and Scientific Aspects of MST Radar, Hilton Head Island S. C., USA, 7–11 November 1995, ed. B. Edwards, 82–85, 1996.
Hocking, W. K., Recent advances in radar instrumentation and tech-niques for studies of the mesosphere, stratosphere, and tropo-sphere, Radio Sci., 2241–2270, 1997.
Hocking, W. K. and Mu, K. L., Upper and Middle Tropospheric Ki-neticEnergy Dissipation Rates from Measurements of C2n– Re-view of Theories, in situ Investigations, and experimental Studies using the Buckland Park Atmospheric Radar in Australia, J. At-mos. Terr. Phys, 59, 1779–1803, 1997.
Hocking, W. K. and Hamza, A. M., A Quantitative measure of the degree of anisotropy of turbulence in terms of atmospheric pa-rameters, with particular relevance to radar studies, J. Atmos. Solar Terr. Phys., 59, 1011–1020, 1997.
Hocking, W. K. and R¨ottger, J., Studies of polar mesosphere sum-mer echoes over EISCAT using calibrated signal strengths and statistical parameters, Radio Sci., 32, 1425–1444, 1997. Hocking, W. K., The dynamical parameters of turbulence theory as
they apply to middle atmosphere studies, Earth Planets Space, 51, 525–541, 1999.
the troposphere and stratosphere from comparisons of powers in off-vertical beams, J. Atmos. Terr. Phys., 57, 655–663, 1995. Hopfinger, E. J., Turbulence in stratified fluids: a review, J.
Geo-phys. Res., 92, 5287–5303, 1987.
Klaassen, G. P. and Peltier, W. R., The onset of turbulence in finite-amplitude Kelvin-Helmholtz billows, J. Fluid Mech., 155, 1–35, 1985a.
Klaassen, G. P. and Peltier, W. R., Evolution of finite amplitude Kelvin-Helmholtz billows in two spatial dimensions, J. Atmos. Sci., 42, 1321–1339, 1985b.
Klostermeyer, J., The formation of layered structures by paramet-ric instabilityof finite-amplitude gravity waves, Adv. Space Res., 12(10), 203–205, 1992.
Kudeki, E. and Stitt, G. R., Frequency domain interferometry: a high resolution radar technique for studies of atmospheric turbu-lence, Geophys. Res. Lett., 14, 198–201, 1987.
Larsen, M. F. and R¨ottger, J., VHF and UHF Doppler radars as tools for synoptic research, Bull. Amer. Meteorol. Soc., 63, 996–1008, 1982.
Lesicar, D. and Hocking, W. K., Studies of seasonal behaviour of the shape of mesospheric scatterers using a 1.98 MHz radar, J. Atmos. Terr. Phys., 54, 295–309, 1992.
Lesicar, D., Hocking, W. K., and Vincent, R. A., Comparative stud-ies of scatterers observed by MF radars in the Southern Hemi-sphere mesoHemi-sphere, J. Atmos. Terr. Phys., 56, 581–591, 1994. Luce, H., Crochet, M., Delaudier, F., and Sidi, C., Interpretation
of VHF ST radar vertical echoes from in situ temperature sheet observations, Radio Sci., 30, 1002–1025, 1995.
Luce, H., Yamamoto, M., Fukao, S., Helal, D., and Crochet, M., A frequency domain interferometric imaging (FII) technique based on high resolution methods, Ninth International Workshop on Technical and Scientific Aspects of MST Radar - MST9 com-bined with COST-76 Final Profiler Workshop, Toulouse, France, 13–18 March 2000.
Maxworthy, T., Caperan, Ph., and Spedding, G. R., Two-dimensional turbulence and vortex dynamics in a stratified fluid, Third International Symposium on Density-Stratified Flows, Caltech, Pasadena, USA, 1985.
Palmer, R. D., Chilson, P. B., Muschinski, A., Schmidt, G., Yu, T.-Y., and Steinhagen, H., Range imaging using frequency diver-sity: theory and application, Ninth International Workshop on Technical and Scientific Aspects of MST Radar - MST9 com-bined with COST-76 Final Profiler Workshop, Toulouse, France, 13–18 March 2000.
Pan, C.-J. and R¨ottger, J., Structures of polar mesosphere summer echoes observed with the EISCAT VHF radar in the interferom-eter mode, in Proceedings of the 7t hWorkshop on Technical and Scientific Aspects of MST Radar, edited by B. Edwards, pp. 252– 255, STEP Hnadbook, Natl. Oceanic and Atmos. Admin., Boul-der, Colo., 1996.
Pao, Y.-H., Document D1–82–0959, Boeing Scientific Laborato-ries, 1968.
Peltier, W. R., Halle, J., and Clarke, T. L., The evolution of finite-amplitude Kelvin-Helmholtz billows, Geophys. Astrophys. Fluid Dyn., 10, 53–87, 1978.
Reid, I. M., Ruester, R., and Schmidt, G., VHF radar observations of Cat’s-eye-like structures at mesospheric heights, Nature, 327, 43–45, 1987.
R¨ottger, J. and Liu, C. H., Partial reflection and scattering of VHF radar signals from the clear atmosphere, Geophys. Res. Lett., 5, 357–360, 1978.
R¨ottger, J. and Schmidt, G., High-resolution VHF radar soundings of the troposphere and stratosphere, IEEE Trans. Geosci. Elec-tron., GE–17, 182–189, 1979.
R¨ottger, J., Reflection and scattering of VHF radar signals from atmospheric refractivity structures, Radio Sci., 15, 259–276, 1980a.
R¨ottger, J., Structure and dynamics of the stratosphere and meso-sphere revealed by VHF radar investigations, Pure Appl. Geo-phys., 118, 494–527, 1980b.
R¨ottger, J., The dynamics of stratospheric and mesospheric fine structure investigated with an MST VHF radar, Middle Atmo-sphere Program Handbook, ed. S. K. Avery, SCOSTEP Secre-tariat, University of Illionois, Vol. 2, pp. 341–350, 1981. R¨ottger, J., Chzechowsky, P., and Schmidt, G., First low-power
VHF radar observations of tropospheric and mesospheric winds and turbulence at the Arecibo Observatory, J. Atmos. Terr. Phys., 43, 789–800, 1981.
R¨ottger, J. and Larsen, M. F., UHF/VHF radar techniques for at-mospheric research and wind profiler applications, in Radar in Meteorology; Battan Memorial and 40th Anniversary Radar Me-teorology Conference, edited by D. Atlas, pp 235–281, Amer. Meteorol. Soc., Boston, Mass., 1990.
R¨ottger, J., Luce, H., Yamamoto, M., Fukao, S., Liu, C. H., Pan, C. J., Su, S. Y., and Wu, C. H., Combined high-time reso-lution SDI-FDI experiments with VHF radars, Ninth Interna-tional Workshop on Technical and Scientific Aspects of MST Radar - MST9 combined with COST-76 Final Profiler Workshop, Toulouse, France, 13–18 March 2000.
Sahr, J. D. and Fejer, B. G., Auroral electrojet plasmairregulararity theory and experiment: A critical review of present understand-ing and future directions, J. Geophys. Res., 101, 26893–26909, 1996.
Smyth, W. D. and Peltier, W. R., The transition between Kelvin-Helmholtz and Holmboe instability: an investigation of the over-reflection hypothesis, J. Atmos. Sci., 46, 3698, 1989.
Tsuda T., Sato, T., Hirose, K., Fukao, S., and Kato, S., MU radar observations of the aspect sensitivity of backscattered VHF echo power in the troposphere and lower stratosphere, Radio Sci., 21, 971–980, 1986.
Tsuda, T., Gordon, W. E., and Saito, H., Azimuth angle variations of specular reflection echoes in the lower atmosphere observed with the MU radar, J. Atmos. Solar-Terr. Phys., 59, 777–784, 1997. Van Zandt, T. E., A universal spectrum of buoyancy waves in the
atmosphere, Geophys. Res. Lett., 9, 575–578, 1982.
Van Zandt, T. E. and Vincent, R. A., Is VHF Fresnel reflectivity due to low frequency buoyancy waves?, Handbook for MAP, vol. 9, pp 78–80, SCOSTEP secretariat, University of Illinois, Urbana, 1983.
Werne, J. and Fritts, D. C., Stratifed shear turbulence: Evolution and statistics, Geophys. Res. Lett., 26, 439–442, 1999.
de Wolfe, D. A., A random-morion model of fluctuations in a nearly transparent medium, Radio Sci., 18, 128–142, 1983.
Woodman, R. F., High-altitude-resolution stratospheric measure-ments with the Arecibo 2380-MHz radar, Radio Sci., 15, 423– 430, 1980.
Woodman, R. F. and Rastogi, P. K., Evaluation of effective eddy diffusive coefficients using radar observations of turbulence in the stratosphere, Geophys. Res. Lett., 11, 243–246, 1984. Woodman, R. F. and Chu, Y.-H., Aspect sensitivity measurements
of VHF backscatter made with the Chung-Li radar: plausible mechanisms, Radio Sci., 24, 113–125, 1989.