Droplet Impingement and Wetting Hysteresis
on Textured Hydrophobic Surfaces
The MIT Faculty has made this article openly available.
Please share
how this access benefits you. Your story matters.
Citation
Varanasi, Kripa K., Adam Paxson, Katherine Smyth, Hyuk-min Kwon,
and Tao Deng. “Droplet Impingement and Wetting Hysteresis on
Textured Hydrophobic Surfaces.” 2010 14th International Heat
Transfer Conference, Volume 3 (2010). © 2010 ASME International
As Published
http://dx.doi.org/10.1115/IHTC14-22722
Publisher
ASME International
Version
Final published version
Citable link
http://hdl.handle.net/1721.1/109225
Terms of Use
Article is made available in accordance with the publisher's
policy and may be subject to US copyright law. Please refer to the
publisher's site for terms of use.
DROPLET IMPINGEMENT AND WETTING HYSTERESIS ON TEXTURED
HYDROPHOBIC SURFACES
Kripa K. Varanasi∗, Adam Paxson, Katherine Smyth, Hyuk-min Kwon,
Massachusetts Institute of Technology Cambridge, MA, USA
Tao Deng
GE Global Research Center Niskayuna, NY, USA
∗ Corresponding authors: Prof. Kripa K. Varanasi (varanasi@mit.edu)
ABSTRACT
We study the wetting energetics and wetting hysteresis of sessile and impacting water droplets on superhydrophobic surfaces as a function of surface texture and surface energy. Detailed experiments tracking contact line motion simultaneously with contact angle provides new insights on the wetting hysteresis, stick-slip behavior and dependence on contact line velocity. For sessile drops, we find three wetting regimes on these surfaces: equilibrium Cassie at small feature spacing, equilibrium Wenzel at large feature spacing, and an intermediate state at medium feature spacing. We observe minimum wetting hysteresis not on surfaces that exhibit Cassie wetting but rather on surfaces in the intermediate regime. We argue that droplets on these surfaces are metastable Cassie droplets whose internal Laplace pressure is insufficient to overcome the energy barrier required to homogeneously wet the surface. These metastable Cassie droplets show superior roll-off properties because the effective length of the contact line that is pinned to the surface is reduced. We develop a model that can predict the transition between the metastable Cassie and Wenzel regimes by comparing the Laplace pressure of the drop to the capillary pressure associated with the wetting-energy barrier of the textured surface. In the case of impacting droplets the water hammer and Bernoulli pressures must be compared with the capillary pressure. Experiments with impacting droplets show very good agreement with this simple pressure-balance model.
1. INTRODUCTION
Recent interest in the wetting properties of superhydrophobic surfaces has been intense. Fundamental understanding of liquid-solid wetting interactions is key to designing effective
surfaces for applications such as self-cleaning, where it is desirable for impinging water droplets to roll off without wetting the surface, removing dust and debris in the process and thereby eliminating the need for active cleaning1. As illustrated in Figure 1, one metric of performance is roll-off angle, the angle of surface inclination at which a deposited water droplet begins to roll off.
Figure 1: Schematic illustrations of contact (left) and roll-off
(right) angles of droplets on a solid surface.
Many surfaces, both natural and synthetic, exhibit favorable roll-off and self-cleaning properties. Naturally occurring surfaces with self-cleaning properties include the leaves of lotus plants (Nelumbo nucifera), which have micro- and nanoscale asperities composed of waxy, hydrophobic material 1-2. Researchers have fabricated textured, hydrophobic surfaces
through a range of methods to attain low roll-off angles. Methods include electrodeposition3, nanotube growth4, lithography5, and wet etching6. Textured, hydrophobic surfaces
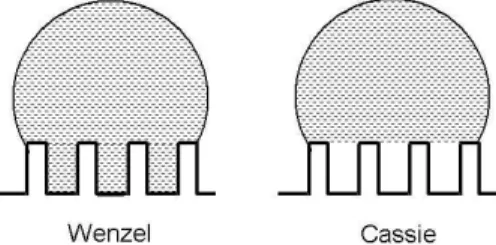
induce roll-off by minimizing solid contact with water droplets. The corresponding equilibrium wetting state on textured surfaces where air is trapped beneath the water droplet is known as the Cassie state7, while the equilibrium state in which
water homogeneously contacts all available solid surface area is known as the Wenzel state8, as shown in Figure 2. Models Proceedings of the 14th International Heat Transfer Conference IHTC14 August 8-13, 2010, Washington, DC, USA
based on minimization of total interfacial energy predict wetting state and enable targeted design of surfaces to ensure Cassie wetting. Moreover, reports suggest designing for equilibrium Cassie wetting as a strategy to design robust surfaces that minimize contact angle hysteresis9-11. However, surfaces outside this equilibrium Cassie design space often yield more favorable roll-off behavior.
Figure 2: Illustrations of the Wenzel (left) and Cassie (right) wetting states.
We study droplet roll-off on superhydrophobic arrays of lithographically fabricated square posts. To determine wetting state, we measure static contact angles and compare the results to minimum energy predictions for droplets in Cassie and Wenzel states. Based on these comparisons, we observe three wetting regimes as the distance between posts is increased: equilibrium Cassie at small post spacing, equilibrium Wenzel at large post spacing, and an intermediate state at medium spacing. As expected, Wenzel droplets on surfaces with large spacing do not roll off. However, we observe minimum roll-off angles not on surfaces that exhibit equilibrium Cassie wetting, but rather on surfaces in the intermediate range. We argue that droplets on these surfaces are metastable Cassie droplets whose internal Laplace pressure is insufficient to overcome the energy barrier required to homogeneously wet the textures12. We further argue that these metastable droplets are characterized by lower contact line pinning when compared to equilibrium Cassie or Wenzel droplets and therefore exhibit lower contact angle hysteresis (CAH) and optimum roll-off properties. We propose a simple pressure balance model and show that transition from the metastable Cassie to equilibrium Wenzel regimes occurs when the Laplace pressure exceeds the capillary pressure associated with the wetting energy barrier, enabling the droplet to force itself between the texture asperities. While some metastable wetting states may be overcome by impact velocity and other sources of significant input pressure10,12-13, it
is possible to design metastably wetting surfaces with substantial resistance to wetting pressures that characterize specific applications. These applications would thus benefit from enhanced performance enabled by metastable wetting.14
2. EXPERIMENTAL METHODS
Silicon surfaces of periodic square post arrays with 15µm and 3µm width and 25µm and 10µm height respectively are prepared via photolithography and then coated with a layer of
hydrophobic molecules to impart superhydrophobicity. To attain posts with high aspect ratios, we employ a deep reactive ion etching technique using the Bosch process. To minimize scalloping on the sidewalls, we develop recipes optimizing gas flows and time ratios between gas etch and sidewall passivation.
Four inch p-type wafers from Wafernet, Inc. were processed with standard photolithography for patterns of 10µm by 10µm posts with varying post spacing using Shipley 1813 as the photoresist. Photoresist was spin coated onto the wafer at 4000 rpm for 40s creating an approximately 1.3µm thick layer. Three dimensional post geometries were etched into the surface with CF4 plasma RIE with an etch depth of 10µm into the
silicon substrate. The remaining photoresist was stripped and the surface cleaned with piranha solution (5:1 mixture of 98% H2SO4 and 30% H2O2) at 120ºC creating micro-post arrays with
10µm post height.
After cleaning, substrates of all post geometries are coated by placing them in an airtight vessel with about 50µL of fluorosilane (tridecafluoro-1,1,2,2-tetrahydrooctyl-trichlorosilane, Gelest), evacuating for several minutes to purge ambient air, and then allowing the remaining fluorosilane to equilibrate with the surface for at least two hours.
Contact angle measurements on the 15µm and 3µm wide post surfaces are conducted with the sessile droplet technique using a VCA Optima device. One-microliter droplets of deionized water are deposited onto the surface of interest, photographed, and then analyzed by curve fitting to determine the static contact angle. Occasionally, surfaces were so hydrophobic that droplets did not detach from the dispensing syringe even after being pushed into the surface. In these instances, the syringe is tapped gently while the droplet is in contact with the surface. Roll-off angles are measured using the tilt stage accessory to the VCA Optima device. After dispensing the 1µL droplet, the
stage is tilted about two degrees per second to a maximum of 88° while the VCA data acquisition software captured four images per second. Analysis of the video yields the frame at which the droplets roll off, and hence the roll-off angle. For experiments that require both contact and roll-off angle measurements, we use the first image from roll-off videos to determine contact angle. The data points for contact angle and roll-off angle are obtained from six measurements per silicon wafer on two different wafers with identical texture.
For the surfaces with 10µm post width, contact angle measurements were taken using a ramé-hart Model 500 Advanced Goniometer with DROPimage Advance v2.4 software, and a ramé-hart automated dispensing system was used to deposit and add and withdraw volume from droplets. A 30 gauge stainless steel needle and a 31 gauge superhydrophobic needle were used to dispense drops. The goniometer was placed on a Newport CM-225 Ultra-clean vibration damping system with four isolators to reduce the
effects of ambient vibration on contact angle measurement, and a transparent Lexan shade was fabricated and placed over the stage to reduce the effects of air flow. Contact angle measurements were reproducible to approximately ±2 degrees. Roll off and advancing and receding contact angle are measured using the ramé-hart tilting base attachment to the goniometer. After dispensing a 6µL water droplet, the stage is tilted at a rate of 0.1 and 0.2 degrees per second and measurements were taken at a rate of four images per second. The tilt angle and left and right contact angles measured at the frame immediately preceding the incipient motion of the water droplet are considered the roll off and receding and advancing contact angles respectively. A minimum of four and maximum of six trials were completed for each post spacing, and results were averaged based on the number of experiments.
3. RESULTS AND DISCUSSION 3.1 Sessile Droplets
To determine the design space of surface texturing for optimum droplet roll-off applications, we measure roll-off angles on a series of post arrays where the post spacing (denoted by b in Figure 3) is systematically varied. To determine the droplet wetting state, we measure contact angle and compare results to predicted Cassie and Wenzel angles. As expected, we find that droplets in the equilibrium Wenzel state exhibit poor roll-off behavior, clinging to the surface even when tilted vertically. Surprisingly, droplets in the equilibrium Cassie state did not yield the lowest roll-off angles. We find instead that the optimal region is within the equilibrium Wenzel wetting regime, but dewetting pressures originating from surface energy are sufficient to oppose droplet Laplace pressure and prevent liquid infiltration between the posts.
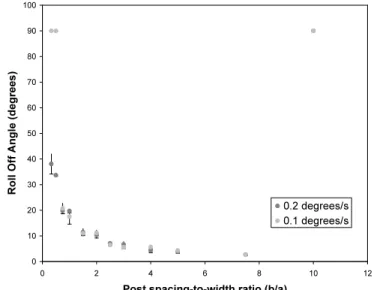
For arrays of posts that are 15µm wide and 25µm high, an
optimal post spacing region exists for droplet roll-off. Measurements are plotted in Figure 4 as a function of post spacing-to-width ratio b/a. For b/a ratio smaller than 1, 1µL droplets do not roll off, as indicated by values of 90°. When the b/a ratio is about 1.5, droplets begin to roll off, reaching minimum roll-off angles of about 17° at a b/a ratio of 5. However, for b/a ratio greater than about 6, droplets do not roll off.
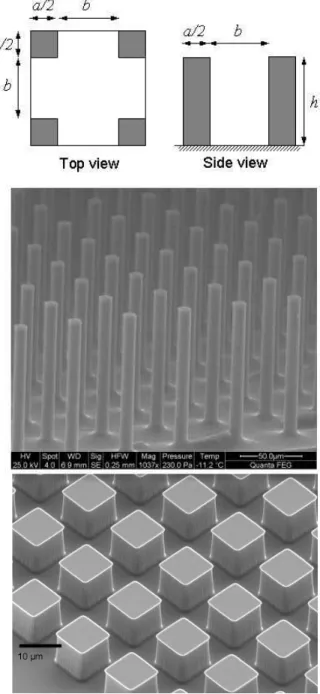
Figure 3: Schematic and SEM images of a representative post arrays. Top and side views of a unit cell illustrate definitions of post width a, spacing b, and height h. Top SEM image is of posts of 15µm width and 25 µm height. Bottom SEM image is of posts of 10µm width and 10 µm height.
To gain insight into droplet wetting state, we first calculate equilibrium contact angles according to the Wenzel and Cassie models. From interfacial energy considerations, it can be shown that the equilibrium contact angle in the Wenzel state is given by
where is the ratio of the total liquid-solid contact area to the surface area projected onto the horizontal plane, and is the equilibrium contact angle on a smooth surface of the same material. In our experiments, we measure = 120°. For an array of square posts is given by the following expression:
(2) where is the aspect ratio of the posts. In the Cassie state, where water droplets contact both solid and air, the equilibrium contact angle is given by
(3) where and are the area fractions of solid-liquid and liquid-air contact, respectively. For an array of square posts and are given by
(4)
Figure 4: Dependence of roll-off angle of 1µL water droplets
on the b/a ratio of square posts that are 15µm wide and 25µm high.
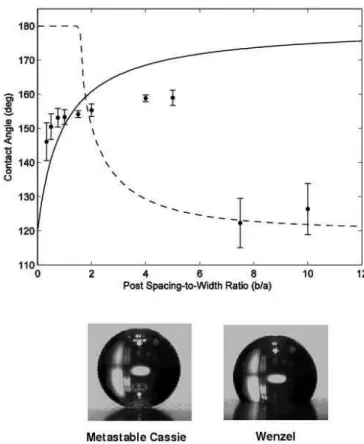
We then measure the contact angle of droplets on each texture and compare results with theory. Predictions and measurements for arrays of posts are plotted as a function of post spacing-to-width ratio b/a in Figure 5. Predicted contact angles for equilibrium Wenzel wetting (dashed line) fall from 180° at b/a of about 1.5 to about 122° at b/a of 10 while equilibrium Cassie angles (solid line) rise from about 135° to 175° for b/a ratios of 0.33 and 10, respectively. Because Cassie and Wenzel curves cross at b/a of about 1.8, energy minimization should favor Cassie wetting for b/a smaller than 1.8 and Wenzel wetting for b/a greater than 1.8.9 Indeed, measured contact angles (solid circles) are consistent with Cassie wetting for b/a ratios that are less than about 2 and with
Wenzel wetting for b/a ratios that are greater than 6. However, in the intermediate spacing regime, measured angles do not agree with either equilibrium wetting state. Droplets in this intermediate state exhibit optimum roll-off behavior and permit direct light transmission between droplet and surface (left image) as opposed to Wenzel droplets (right image), evidence that this intermediate state is Cassie-like.
Figure 5: Dependence of static contact angle of 1µL water
droplets on the b/a ratio of square posts that are 15µm wide and 25µm high. Solid and dotted lines denote values predicted for
Cassie and Wenzel wetting states, respectively, while solid circles represent measurements.
Persistence of Cassie-like droplets in the equilibrium Wenzel regime indicates that there is an energy barrier9-11,4,15 that
maintains the droplet in a metastable state and prevents water from infiltrating into the texture. Hydrophobic materials will resist wetting because there is an associated energy cost. As the air-water interface penetrates deeper into the structures and the water wets a greater solid surface area, the total interfacial energy increases. An effective force required to wet these surfaces can be calculated by differentiating the energy with respect to the penetration depth. Normalizing by the air-water interfacial area yields the required pressure to force water into the texture, or capillary pressure PC. For a square array of
square posts of width a and edge-to-edge spacing b, the capillary pressure is given by
(5) where γLV is the air-water surface energy. Hydrophobic
materials have values of θ0 that exceed 90°, resulting in
positive values of PC corresponding to pressures that resist
water penetration. Conversely, textures of hydrophilic materials (θ0 < 90°) have negative PC values, consistent with
the tendency of hydrophilic capillaries to draw water in. For water and air, γLV = 0.072 J/m2. Because our model surfaces are
periodic with well-defined posts, given the intrinsic surface energy of a smooth surface of the same composition, we can then calculate capillary pressures exactly for each texture.
Figure 6: Calculated dependence of capillary and Laplace
pressures for 1µL water droplets as function of post spacing-to-width ratio. Laplace pressure (solid line) surpasses capillary pressure for 15µm-wide posts (dashed line) at b/a ratio of 5.5. For comparable spacing-to-width ratio, capillary pressure for 3µm-wide posts (dotted line) always exceeds Laplace pressure.
Wetting state is determined not only by the energy level of each state, but also the accessibility of each state. Because our droplets are placed on top of the textures and thus begin in a Cassie-like state, the energy landscape between this initial state and the lowest energy state will determine whether droplets can minimize total interfacial energy. The slope of the energy barrier is proportional to the capillary pressure, which will resist wetting and thus impede Cassie-to-Wenzel transitions. Calculated pressures for posts that are 15µm in width are
plotted in Figure 6 as a function of the ratio between post spacing and post width (dashed line). Capillary pressure decreases as the post spacing increases because there are fewer posts to wet per unit area. In the absence of external impulses, Laplace pressure
(6) where R is the droplet radius, is the driving force that facilitates wetting transitions. As shown in Figure 6, at a critical spacing-to-width ratio of about 5.5, the dashed line representing the capillary pressure for 15µm posts intersects the solid line representing the Laplace pressure. At larger values of post spacing, we expect Laplace pressure to overcome capillary pressure and allow droplets to transition to their equilibrium Wenzel state. This prediction is in agreement with the contact angle measurements of Figure 5 in which contact angles transition to predicted Wenzel values beyond the critical post spacing. The above prediction is further validated by the roll-off angle measurements of Figure 4 in which droplet roll-roll-off angles decrease with spacing and reach minimum values on surfaces with spacing ratios that are slightly narrower than the critical spacing ratio. This is because droplets on these surfaces exist in Cassie state (ranging from equilibrium to metastable states) and therefore experience continuous reduction in contact-line pinning as the spacing ratio is increased. However, beyond the critical spacing, droplets do not roll-off as they transition into the Wenzel state and experience substantial increase in contact-line pinning. Therefore, this simple pressure balance model can predict whether surfaces will enable metastable wetting and optimal roll-off performance or equilibrium Wenzel wetting and poor roll-off characteristics. Because pressures that force fluid into textures are not limited to Laplace pressures, it is desirable to design textures with higher capillary pressures to resist homogeneous wetting. For example, moving droplets exert dynamic pressures that can far exceed Laplace pressures. As given in (5), simply scaling down the feature size increases capillary pressure. For an array of square posts capillary pressure does not depend on feature height. However, shrinking in the lateral dimensions increases the capillary pressure because the differential vertical surface area of posts increases. For example, shrinking a post array by a factor of two is equivalent to cutting each post into four smaller posts, effectively doubling the differential vertical surface area. Calculations for capillary pressure of arrays of posts that are 3µm in width are plotted in Figure 6 (dotted line). Indeed, for a given post spacing-to-width ratio, pressures for the arrays of 3µm posts are larger than those of the 15µm posts.
An estimate for the critical spacing ratio at which the transition from Cassie to Wenzel state would occur can be obtained by equating the capillary and Laplace pressures given by (5) and (6), respectively, and solving for the critical spacing ratio
as
(7) Using the above equation, we predict the Cassie-to-Wenzel transition of a 1µL droplet on a superhydrophobic surface with
square array of 3µm posts to occur at a spacing ratio of about 13.4. A plot of the critical spacing ratio versus the feature size
(Figure 7) shows that the design constraints on the spacing can be relaxed by designing for smaller feature sizes and vice versa. To further validate our pressure balance model in predicting wetting behavior, we repeat contact and roll-off angle measurements for similar arrays of posts that are now 3µm in
width and 10µm in height and a final array with posts 10µm in width and 10µm in height. In Figure 8, we plot measured
contact angles (solid circles) and predictions for Cassie (solid line) and Wenzel (dashed line) wetting as a function of post
Figure 7: Calculated critical post spacing-to-width ratio (b/a)c
versus post width a. As the post width is reduced the requirements on critical spacing can be relaxed and vice versa.
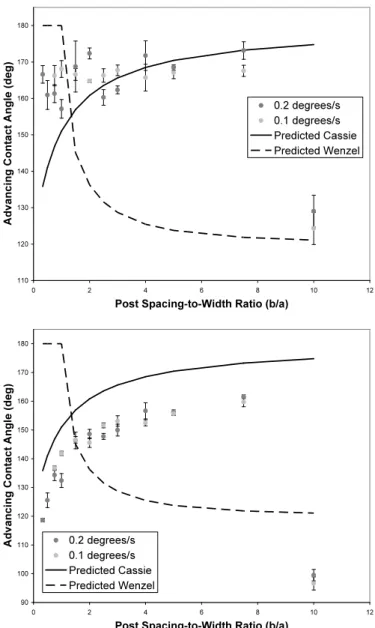
Figure 8: Top: Dependence of static contact angle of 1µL water
droplets on the b/a ratio of square posts that are 3µm wide and 10µm high. At small ratios, contact angles (solid circles) are in rough agreement with predicted values for Cassie wetting (solid line). At larger ratios, contact angles deviate from predicted Cassie values but still do not agree with predicted Wenzel values (dashed line). Dependence of advancing (middle) and receding (bottom) contact angle of 6µL water droplets on the
b/a ratio of square posts that are 10µm wide and 10µm high.
spacing-to-width ratio. For the arrays with square posts that are 3µm wide and 10µm high, at a b/a ratio of about 2.8,
theoretical Cassie and Wenzel curves cross, indicating equilibrium Cassie wetting for b/a less than 2.8 and equilibrium Wenzel wetting for b/a values greater than 2.8. However, measured contact angles increase with spacing-to-width ratio. This trend is consistent with predictions for Cassie wetting, but opposite to that of Wenzel wetting. Unlike the system with
15µm-wide posts, measured contact angles do not drop to
Wenzel values at high spacing-to-width ratios. Moreover, as shown in Figure 9, roll-off angles continue to decrease as post spacing increases and reach values as low as 4° for b/a of 10. This suggests that droplets on surfaces outside the equilibrium Cassie regime (b/a > 2.8) do not transition into the Wenzel state but rather exist in the metastable Cassie state, and therefore exhibit continual reduction in contact-line pinning and decreasing roll-off angles as the spacing ratio is increased. These observations are consistent with our prediction from (7) that for 3µm posts equilibrium Wenzel wetting will not be attained for spacing ratios that are less than 13.4. Therefore, as the spacing-to-width ratio increases, the Cassie contact between droplet and solid decreases resulting in continually increasing contact angle and decreasing roll-off angle.
Similar trends in roll off and contact angle are present in the 10µm wide and 10µm high post arrays. In this case, the Cassie and Wenzel curves intersect at 1.5, and the advancing contact angle and receding contact angle can characterize the static contact angle. The receding contact angle appears to more closely follow the trend of the Cassie predicted curve for b/a<1.5, and it is likely that an equilibrium value between advancing and receding at b/a<1.5 will fall along the Cassie predicted curve. As b/a grows larger, the advancing angle no longer exceeds the predicted Cassie contact angle and the receding contact angle lies further from the predicted curve suggesting that equilibrium contact angle values are present below the predicted Cassie curve in the metastable Cassie state. The drop finally transitions to Wenzel wetting experimentally at b/a=10. Droplet roll off angle therefore steadily decreases until the drop no longer rolls off at b/a = 10 as shown in Figure 9. New insights on the stick-slip behavior and dependence of wetting hysteresis on contact line velocity are provided in Appendix.
Figure 9: Top: Dependence of roll-off angle of 1µL water
droplets on the b/a ratio of square posts that are 3µm wide and 10µm high. Roll-off angles (solid circles) decrease
monotonically as the b/a ratio increases, further evidence that the droplets to not transition to the Wenzel state, even at the maximum tested ratio. Bottom: Dependence of roll-off angle of 6µL water droplets on the b/a ratio of square posts that are
10µm wide and 10µm high.
3.2 Impacting Droplets
To design superhydrophobic surfaces for application onto products such as windshields or aircraft engines, one must consider the effect of impinging water droplets. These droplets can travel at elevated velocities and exert high pressures onto surfaces upon impact. To ensure that superhydrophobic surfaces maintain functionality in specific applications, it is crucial to prevent water infiltration into textures. This requires the texture-dependent capillary pressure to exceed the droplet impact pressures. At the instant of impact a shock wave is set up in the droplet, giving rise to the so-called water hammer pressure16
(8) where is the density of the liquid, C is the speed of sound in the liquid, and V is the velocity of the droplet. After the instant of impact the wetting pressures drop to the familiar Bernoulli pressure given by
(9) This sequence of events is schematically shown in Figure 10.
Figure 10: Sequence of events during droplet impact
The water hammer pressure is significantly higher than the Bernoulli pressure. For example, for a droplet impinging on a surface at 3m/s the water hammer pressure is around 0.9Mpa when compared to a Bernoulli pressure of about 4.5 kPa. To facilitate complete droplet recoil and prevent droplet infiltration the surface texture of the superhydrophobic surface should be designed such that the capillary pressure PC exceeds both the
water hammer and Bernoulli pressures. When the capillary pressure is smaller than Bernoulli and water hammer pressures the droplet infiltrates the texture and remains pinned to the surface. However when the capillary pressure is greater than Bernoulli pressure but lower than the water hammer pressure partial pinning of the droplet should occur. These conditions are summarized in the following equations
(10) To validate our model, we conduct several droplet impact experiments with droplets impinging a surface with a velocity V~3m/s and capture the impact phenomenon on a high-speed camera. The texture parameters such as feature size, spacing, and aspect ratio are systematically varied. Here, we present results of droplet impact on four different surfaces to validate
our pressure balance model (10). These surfaces are: 15 micron posts with edge-to-edge spacing of 150 microns, 15 microns posts with edge-to-edge spacing of 5 microns, nano-porous surface with average pore size of ~38 nm and pore-to-pore spacing of ~10 nm, and a hierarchical surface with nanodendrites (~100nm) on microposts (3microns). The capillary pressures for these surfaces can be calculated to be 80 Pa, 12 kPa, and 3.8 MPa, and 0.92 MPa respectively. The photographs of the impact event are shown in Figure 11 along with the SEM images of the different surfaces. These results are in excellent agreement with our predictions.
Figure 11: Dynamic interactions of 1mm diameter droplets with a variety of surfaces captured using a high-speed camera20 (a)
Microtextured surface consisting of 15um posts spaced apart by 150um – droplet does not recoil (b) Partial recoil on microtextured surface consisting of 15um posts spaced apart by 5um (c) Hierarchical texture comprising of 3um posts with 100nm dendritic structures causes complete recoil and shedding (c) Metaloxide nanoporous surface with ~38 nm pores results in complete drop recoil and shedding.
CONCLUSIONS
We demonstrate that metastable Cassie droplets have superior roll-off properties when compared to equilibrium Cassie and Wenzel droplets. By systematically increasing the spacing between posts, we show that droplet wetting regime transitions from equilibrium Cassie to metastable Cassie and finally to equilibrium Wenzel regime. We propose a simple pressure balance model that predicts the transition from metastable Cassie to equilibrium Wenzel wetting. Measurements on textured hydrophobic surfaces with varying post spacing and size show good agreement with the model. In many cases, the metastable regime occupies a significant region of design space and we show that this additional design space can be utilized. One can thus exploit metastable wetting not only to improve roll-off behavior, but also to relax design constraints on specific physical systems. Our work indicates that the design of superhydrophobic surfaces for optimum roll-off properties is characterized by a trade-off between the need for high capillary pressures to maintain droplet metastability (denser texture) versus the requirement for low contact line pinning to minimize contact angle hysteresis (sparser texture). We demonstrate that this trade-off can be circumvented by the use of smaller feature sizes. Our analysis and experiments show that similar textures with smaller feature length scales offer more capillary pressure to resist wetting, consistent with the analysis of Liu et.al17. This further extends the metastable regime and provides an additional barrier against droplets that wet with greater pressures, such as falling raindrops and water droplets impacting moving surfaces. Smaller textures also offer a geometric advantage, as they restrict the size of droplets that can fit in between the textures. For example, droplets encountered during flight in aircraft engine applications can move as fast as 60m/s relative to the aircraft and are often smaller than 20µm in diameter. In this important application,
wetting dynamics and freezing kinetics are also of concern. Nevertheless, our work validates a simple picture based on pressure balance that provides a framework for the predictive design of surfaces with optimal water-repellant and droplet shedding properties for many applications (such as dropwise condensation18, deicing19, etc.).
APPENDIX
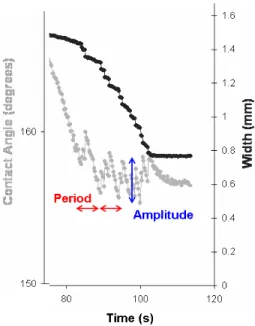
Qualitatively, the contact angle vs. time plot is best described as a sawtooth-like function where each “tooth” is a period and the height of the tooth is the amplitude (Figure A1). As post spacing increases, the stick-slip amplitude of the contact angle increases, and the amplitude of the stick-slip is likely unrelated to contact line velocity since doubling the volume addition and subtraction rate had little or no effect on the amplitude. Similar to amplitude, the stick-slip period of the contact angle increases linearly; however, contact line velocity appears to be directly
related to period. As contact line velocity increases, the period of the stick slip behavior also increases.
Figure A1. Sample receding stick-slip behavior of contact
angle and width as a function of time. Plot from 50µm post spacing trial with volume addition and subtraction rate set at 0.417µL/s.
ACKNOWLEDGEMENTS
We thank Dr. Margaret Blohm and the Nanotechnology Program at GE Global Research Center for support.
REFERENCES
1. Barthlott, W.; Neinhuis, C. Planta 1997, 202, 1 2. Bhushan, B.; Jung, Y.C. Nanotechnology 2006, 17,
2758.
3. Shirtcliffe, N.J.; McHale, G; Newton, M.I.; Perry, C.C.
Langmuir 2005, 21, 937.
4. Lau, K.K.S.; Bico, J; Teo, K.B.K.; Chhowalla, M.; Amaratunga, G.A.J.; Milne, W.I.; McKinley, G.H.; Gleason, K.K. Nano Lett. 2003 3, 1701.
5. Oner, D; McCarthy, T.J. Langmuir 2000 16, 7777. 6. Guo, Z; Zhou, F; Hao, J; Liu, W. J. Am. Chem. Soc.
2005 127, 15670.
7. Cassie, A.B.D.; Baxter, S. Trans. Faraday Soc. 1944 40, 546.
8. Wenzel, R.N. Ind. Eng. Chem. 1936 28, 988. 9. Patankar, N.A. Langmuir 2003 19, 1249.
10. He, B.; Patankar, N.A.; Lee, J. Langmuir 2003 19, 4999 (2003).
11. Tuteja et.al., MRS Bulletin, 2008, 33, 752. 12. Lafuma, A.; Quéré, D. Nature Mater. 2003 2, 457. 13. Reyssat, M; Pépin, A.; Marty, F; Chen, Y.; Quéré, D.
14. Marmur, A. Langmuir 2004 20, 3517.
15. L Barbieri, E Wagner, and P Hoffmann, Langmuir
2007, 23, 1723.
16. O. G. Engel, J. Res. Natl. Bur. Stand. 1955, 54, 281 17. B Liu and F F Lange, J. Colloid Interface Sci. 298,
899 (2006).
18. Varanasi, K.K.; Bhate, N. et.al., US Patent Application
2006 Application Number: 20070028588
19. Hsu, M.F.; Varanasi, K.K., et.al., US Patent
Application 2005 Application Number: 20070031639
20. T. Deng, K.K. Varanasi, et.al., Applied Physics Letters,