HAL Id: hal-00304203
https://hal.archives-ouvertes.fr/hal-00304203
Submitted on 28 May 2008HAL is a multi-disciplinary open access
archive for the deposit and dissemination of sci-entific research documents, whether they are pub-lished or not. The documents may come from teaching and research institutions in France or abroad, or from public or private research centers.
L’archive ouverte pluridisciplinaire HAL, est destinée au dépôt et à la diffusion de documents scientifiques de niveau recherche, publiés ou non, émanant des établissements d’enseignement et de recherche français ou étrangers, des laboratoires publics ou privés.
Measurement of black carbon at Syowa station,
Antarctica: seasonal variation, transport processes and
pathways
K. Hara, K. Osada, M. Yabuki, M. Hayashi, T. Yamanouchi, M. Shiobara, M.
Wada
To cite this version:
K. Hara, K. Osada, M. Yabuki, M. Hayashi, T. Yamanouchi, et al.. Measurement of black carbon at Syowa station, Antarctica: seasonal variation, transport processes and pathways. Atmospheric Chemistry and Physics Discussions, European Geosciences Union, 2008, 8 (3), pp.9883-9929. �hal-00304203�
ACPD
8, 9883–9929, 2008 Black carbon at Syowa station, Antarctica K. Hara et al. Title Page Abstract Introduction Conclusions References Tables Figures ◭ ◮ ◭ ◮ Back CloseFull Screen / Esc
Printer-friendly Version Interactive Discussion
Atmos. Chem. Phys. Discuss., 8, 9883–9929, 2008 www.atmos-chem-phys-discuss.net/8/9883/2008/ © Author(s) 2008. This work is distributed under the Creative Commons Attribution 3.0 License.
Atmospheric Chemistry and Physics Discussions
Measurement of black carbon at Syowa
station, Antarctica: seasonal variation,
transport processes and pathways
K. Hara1,2, K. Osada3, M. Yabuki1, M. Hayashi2, T. Yamanouchi1, M. Shiobara1, and M. Wada1
1
National Institute of Polar Research, Japan
2
Department of Earth System Science, Faculty of Science, Fukuoka University, Japan
3
Environmental Science, Graduate School, Nagoya University, Japan
Received: 4 March 2008 – Accepted: 21 April 2008 – Published: 28 May 2008 Correspondence to: K. Hara (harakei@fukuoka-u.ac.jp)
ACPD
8, 9883–9929, 2008 Black carbon at Syowa station, Antarctica K. Hara et al. Title Page Abstract Introduction Conclusions References Tables Figures ◭ ◮ ◭ ◮ Back CloseFull Screen / Esc
Printer-friendly Version Interactive Discussion
Abstract
Measurement of black carbon (BC) was carried out at Syowa station Antarctica (69◦S, 39◦E) from February 2004 until January 2007. The BC concentration at Syowa ranged from below detection to 176 ng m−3 during the measurements. Higher BC concentra-tions were observed mostly under strong wind (blizzard) condiconcentra-tions due to the approach
5
of a cyclone and blocking event. The BC-rich air masses traveled from the lower tro-posphere of the Atlantic and Indian Oceans to Syowa (Antarctic coast). During the summer (November–February), the BC concentration showed a diurnal variation to-gether with surface wind speed and increased in the katabatic wind from the Antarctic continent. Considering the low BC source strength in the Antarctic continent, the higher
10
BC concentration in the continental air (katabatic wind) might be caused by long range transport of BC via the free troposphere from mid- and low- latitudes. The seasonal variation of BC at Syowa had a maximum in August, while at the other coastal sta-tions (Halley, Neumayer, and Ferraz) and the continental station (Amundsen-Scott), the maximum occurred in October. This difference may result from different transport
15
pathways and scavenging of BC by precipitation during the transport from the source regions. During the austral summer, long-range transport of BC via the free tropo-sphere is likely to make an important contribution to the ambient BC concentration. The BC transport flux indicated that BC injection into the Antarctic region strongly de-pended on the frequency of storm (blizzard) conditions. The seasonal variation of BC
20
transport flux increased by 290 mg m−2 month−1 in winter–spring when blizzards fre-quently occurred, whereas the flux decreased to lower than 50 mg m−2month−1in the summer with infrequent blizzards.
1 Introduction
Black carbon (BC) is one of the most important aerosol constituents in the Earth’s
atmo-25
ACPD
8, 9883–9929, 2008 Black carbon at Syowa station, Antarctica K. Hara et al. Title Page Abstract Introduction Conclusions References Tables Figures ◭ ◮ ◭ ◮ Back CloseFull Screen / Esc
Printer-friendly Version Interactive Discussion
and biomass burning. The roles of BC in the atmosphere have been growing inter-est from the viewpoint of radiation budget and aerosol direct effect on climate change because of the absorbing properties of BC (Hansen et al., 2005; IPCC, 2007). In ad-dition to its absorbing properties in atmosphere, BC can have an important influence on surface albedo after deposition onto snow surfaces (Hansen and Nazarenko, 2004;
5
Hansen et al., 2005; IPCC, 2007). BC deposition onto a snow surface can lead to albedo change especially in the infrared band and then result in snow melting and an increase in warming sensitivity (Aoki et al., 1998). Furthermore, ice core records in Greenland suggested that BC in surface snow results in climate forcing during the 20th century after industrialization (McConnell et al., 2007a). In order to obtain knowledge
10
about spatial distribution of BC and the climate impact by atmospheric aerosol parti-cles in the Arctic, many aerosol observations (e.g., Hara et al., 2003; Yamanouchi et al., 2005) and model simulations (Rinke et al., 2004) have been made in the Arctic regions, which are significantly influenced by anthropogenic species from industrial regions in the mid-latitudes and Arctic circle. These investigations indicated the possibility that
15
BC can play an important role in climate change in the Arctic regions.
Compared to the Arctic, Antarctica is isolated from human activities on the other continents. This isolated situation causes a lower number density of aerosol particles in the Antarctic atmosphere relative to the other regions (e.g., Ito, 1989). According to Bodhaine (1995), BC concentration and aerosol number concentration have been too
20
low to have significant direct effect on climate change in the Antarctic regions. Though the concentrations of some long-lived atmospheric substances such as CO2and CH4 increased gradually even in Antarctica (Aoki et al., 1992; Aoki and Nakazawa, 1997), it has been believed that atmospheric aerosols and gaseous species with relatively shorter lifetimes have been insignificantly influenced in the Antarctic atmosphere by
25
human activity in the southern hemisphere. Some metallic elements (e.g., Pb) derived from human activity in the southern hemisphere, however, were identified even in snow samples and ice cores of the Antarctic regions (Planchon et al., 2002a, 2002b; Valle-longa et al., 2002). With developing human activity and industrialization in the southern
ACPD
8, 9883–9929, 2008 Black carbon at Syowa station, Antarctica K. Hara et al. Title Page Abstract Introduction Conclusions References Tables Figures ◭ ◮ ◭ ◮ Back CloseFull Screen / Esc
Printer-friendly Version Interactive Discussion
hemisphere in the future, more anthropogenic species may be transported to Antarctic regions. For a better understanding of the anthropogenic impact and transport pro-cesses from low- and mid- latitudes into the Antarctic regions in present and future, more extensive BC measurement is required.
BC measurements in Antarctic regions were carried out at Amundsen-Scott
5
station (inland, 90◦S) (Hansen, 1988; Bodhaine, 1995), Halley station (coastal, 75◦35′S 26◦34′W) (Wolff and Cachier, 1998), Neumayer station (coastal, 70◦39′S 08◦15′W) (R. Weller, personal communication: Web address, http://web.awi.de/GPH/ AirChemistryObservatory/results.html), and Ferraz station (coastal, 62◦05′S 58◦20′W) (Pereira et al., 2006). For example, the two-hour interval BC concentration at
Hal-10
ley ranged from below detection limit to about 20 ng m−3 (Wolff and Cachier, 1998), whereas it ranged from 0.02 to 50 ng m−3in daily mean at Amundsen-Scott (Hansen, 1988; Bodhaine, 1995). In spite of the isolation of Antarctic regions from strong BC sources, previous BC measurements exhibited clear annual cycles of BC there.
Because of the isolation from large combustion sources, BC sources in the Antarctic
15
Circle are limited only to (1) human activity at each station (mainly located in the coastal area), (2) very small traffic activity for research traverses using snow vehicles, and (3) airplane and vessel operation mainly during the summer. Although BC emission from the stations can have a significant influence on atmospheric measurements on a very local scale (around the station) depending on wind conditions as shown by Warren
20
and Clarke (1990) and Hansen et al. (2001), BC emission from human activity at each station is likely to be negligible or very low in BC source strength in the Antarctic regions with huge area. Without strong anthropogenic sources in the Antarctic regions, BC must be transported from out of Antarctic Circle to maintain the observed ambient BC concentration in the Antarctic atmosphere. In other words, it is expected that BC can
25
be used as tracer of long range transport of aerosols to Antarctic regions.
Likewise, CO2 and mineral particles have been also identified as good indicators of long-range transport from mid-latitudes (e.g., Murayama et al., 1995; Basile et al., 1997; Delmonte et al., 2004; Revel-Rolland et al., 2006). Occasionally, moisture
(wa-ACPD
8, 9883–9929, 2008 Black carbon at Syowa station, Antarctica K. Hara et al. Title Page Abstract Introduction Conclusions References Tables Figures ◭ ◮ ◭ ◮ Back CloseFull Screen / Esc
Printer-friendly Version Interactive Discussion
ter vapor) and isotopic ratio (e.g., δ18O) were also used as tracers associated with precipitation events (Reijmer et al., 2002; van den Lipzig and van den Broeke, 2002; Kavanaugh and Cuffey, 2003; Massom et al., 2004). Long-term CO2 measurements at the surface and in the upper atmosphere at Syowa suggested that CO2–rich air masses were transported via upper troposphere from low latitudes and northern
hemi-5
sphere (Murayama et al., 1995; Aoki and Nakazawa, 1997). Because the lifetime of CO2 is considerably longer in the troposphere relative to aerosol particles (easily removed by precipitation and dry deposition), we must register the different lifetime and efficient scavenging of aerosol constituents during the long-range transport to dis-cuss the transport processes of aerosols into Antarctic regions. The seasonal
varia-10
tion of mineral components (e.g., aluminum) had a maximum in the summer at Neu-mayer (Wagenbach, 1996). Ice core studies suggested that plausible source areas of mineral particles in Antarctic snow/ice were mainly Patagonian regions (Basile et al., 1997; Delmonte et al., 2004) and, somewhat Australia (Revel-Rolland et al., 2006). These investigations, however, were based on stable isotope signatures (87Sr/86Sr and
15
143
Nd/144Nd) of material particles in ice core samples, so that it is difficult to discuss the seasonal variation of mineral particles and the transport processes from the source regions. In contrast to mineral particles, continuous BC measurements can be made with higher time-resolution even in Antarctica. After BC emission from the combustion processes, removal processes of BC are only precipitation and dry deposition, and BC
20
cannot disappear by chemical reaction during the transport. Thus, it is expected that BC will be very suitable for aerosol tracer from low- and mid-latitudes to Antarctica.
Seasonal variations of BC concentration at Amundsen-Scott showed a maximum in summer and a minimum in winter (Hansen, 1988; Bodhaine, 1995), similar to Halley (Wolff and Cachier, 1998) and Ferraz (Pereira et al., 2006), while at Neumayer the
25
maximum was seen in spring (October) (R. Weller, private communication). Although previous aerosol measurements in Antarctic regions revealed BC transport by storm from mid-latitudes (Murphey and Hogan, 1992; Perreira et al., 2004; Perreira et al., 2006), the transport processes of BC into the Antarctic region are not well understood.
ACPD
8, 9883–9929, 2008 Black carbon at Syowa station, Antarctica K. Hara et al. Title Page Abstract Introduction Conclusions References Tables Figures ◭ ◮ ◭ ◮ Back CloseFull Screen / Esc
Printer-friendly Version Interactive Discussion
With the exception of BC measurements at Amundsen-Scott, BC measurements were carried out only in the western Antarctic coast around the Weddell Sea and Antarctic Peninsula. In order to understand the seasonal variation, spatial distribution in the Antarctic atmosphere and transport processes of aerosol constituents into Antarctica, BC measurements are needed in the eastern Antarctic area located in Indian and
5
Pacific Ocean sector.
For the better understanding of seasonal variations of atmospheric substances, transport flux is often a useful index. From the viewpoint of precipitation and water cycles in the Antarctica, the transport flux of moisture (water vapor) has been investi-gated using a meteorological data set (Slonaker and van Woert, 1999; van Lipzig and
10
van den Broeke, 2002; Ohshima and Yamazaki, 2004). The most dominant source of moisture (water vapor) is the ocean surface, so that the flux of moisture can be applied to discuss the transport of marine origin species such as sea-salt particles. It is, how-ever, difficult to discuss the transport of continental and anthropogenic species such as BC and mineral particles. Although transport flux and deposition flux of dust were
15
estimated from ice core analysis (e.g., R ¨othlisberger et al., 2002; McConnell et al., 2007b), the time resolution was too low to obtain knowledge of the seasonal variation. Because BC is emitted dominantly from other continents such as South America and Africa by biomass burning and human activity, the transport flux ought to be able to be used as the index of aerosol transport from the other continents into Antarctica.
20
The present study aims to obtain new and more knowledge about (1) seasonal varia-tion of BC concentravaria-tion at Syowa located in the eastern Antarctic coast, (2) BC trans-port processes into Antarctic regions, (3) differences of BC concentration range and the seasonal variation in each station, and (4) transport flux of BC into Syowa (East Antarctic coast).
ACPD
8, 9883–9929, 2008 Black carbon at Syowa station, Antarctica K. Hara et al. Title Page Abstract Introduction Conclusions References Tables Figures ◭ ◮ ◭ ◮ Back CloseFull Screen / Esc
Printer-friendly Version Interactive Discussion
2 Measurements
2.1 Aerosol measurements at Syowa station
The four-year aerosol measurement program was conducted at Syowa station, Antarc-tica (69◦00′S, 39◦00′E) as part of the Japanese Antarctic Research Expedition (JARE) from February 2003 (JARE44) until the end of January 2007 (JARE47). Continuous BC
5
measurement was carried out at Syowa station on east Ongul Island from 11 Febru-ary 2004 till 12 JanuFebru-ary 2007 (JARE 45∼47). East Ongul Island is located in Lutzow Holm bay and lies ca. 4 km away from the Prince Olav coast (Antarctic continent) as shown in Fig. 1. All instruments for aerosol measurements were installed in the new “clean air observatory” built in January 2004, in order to prevent local contamination
10
from the main area of the station having a diesel power station and fuel heating. The new observatory is built on the windward side of the prevailing wind on the island and ca. 400 m away from the main area. Details of the new observatory (e.g., design and size etc.) were described by Osada et al., (2006).
Figure 2 shows the design of the air intake and tubing in the atmospheric observatory
15
at Syowa station. The air intake was fixed at the top of the air-sampling tower 5 m above ground level on the windward side of the observatory. Sampled air was introduced to the inside of the observatory using stainless tubing with an inner diameter of 100 mmφ and air fan (MB10V-B, Oriental Motor). The flow speed in the tube was adjusted to 2∼3 m s−1. Simultaneous aerosol measurements using optical particle counters in the
20
air intake at the top of the tower and the inside of the observatory showed that particle loss in the inlet pipe was 6, 7, 12 and 13% in the size range of >0.3, >0.5, >1.0, and >2.0 µm, respectively (Osada et al., 2006). Sampled air was distributed to each instru-ment such as particle absorption photometer (PSAP) or aethalometer using conductive tube and stainless tubes from the inlet tube.
25
For BC measurement, PSAP (Radiance Research) was used in JARE45 (Febru-ary 2004∼Janu(Febru-ary 2005) and multi-wavelength (7 wavelength) aethalometer (AE31, Magee Science) in JARE46 and 47 (February 2005∼12 January 2007). Flow rates
ACPD
8, 9883–9929, 2008 Black carbon at Syowa station, Antarctica K. Hara et al. Title Page Abstract Introduction Conclusions References Tables Figures ◭ ◮ ◭ ◮ Back CloseFull Screen / Esc
Printer-friendly Version Interactive Discussion
were about 1.5 L min−1for PSAP and about 9 L min−1for the aethalometer. The prin-ciple of BC measurement is the same in both instruments. The wavelength of the light source is 565 nm in PSAP, and 370, 470, 520, 590, 660, 880, and 950 nm in the aethalometer, respectively. In addition, a Pallflex filter and quartz filter were used as substrates for aerosol collection in PSAP and aethalometer, respectively. In both
5
of these the amount of optically absorbing particles such as BC and minerals is mea-sured. Although mineral particles are optically absorbing species, the absorption cross-section is smaller by a factor of 100∼1000 than that of BC (Hansen, 2003). Because mineral particles as well as BC are transported from outside Antarctica, the concentra-tion of mineral particles cannot increase by 100–1000 times higher than that of BC.
In-10
deed, the concentration of mineral particles was in a similar range to BC at Amundsen-Scott and Neumayer (Wagenbach, 1996). Therefore, PSAP and aethalometer are able to measure BC concentrations with insignificant influence by mineral particles in the present study. Raw BC data was recorded every minute in PSAP and every 15 min in the aethalometer.
15
Simultaneously, condensation nuclei (CN) >10 nm in diameter were measured in 1 min resolution using a CPC-3010 (TSI) with a flow rate of 1 L min−1. Regular me-teorological data were obtained from the Japan Meme-teorological Agency at the meteo-rological observatory (ca. 500 m away from the atmospheric observatory in the main area of Syowa station). Wind data, used in the present study, was measured using
20
an anemometer (FF-11, MES-39207), fixed on the top of the tower 10.1 m above the ground.
3 Filtering of local-contaminated data
Raw output data from PSAP and aethalometer were absorption coefficient (unit, m−1) and mass concentration (unit, ng m−3), respectively. In order to convert the raw PSAP
25
ACPD
8, 9883–9929, 2008 Black carbon at Syowa station, Antarctica K. Hara et al. Title Page Abstract Introduction Conclusions References Tables Figures ◭ ◮ ◭ ◮ Back CloseFull Screen / Esc
Printer-friendly Version Interactive Discussion
(Hansen, 2003)
(σab)PSAP= 10.78 × (BC)Aethalometer, (1)
where (σab)PSAP and (BC)Aethalometer are the mean absorption coefficient (Mm −1
) mea-sured by PSAP and mass concentration (µg m−3) measured by the aethalometer, re-spectively. The hourly-mean BC concentration was calculated from raw BC data
(1-5
min. interval data of PSAP data and 15-min. interval data of aethalometer). Some hourly-BC data showed negative values (14% in PSAP and 3% in aethalometer). All negative values of the hourly-mean data were removed before the data processing and discussion.
Although the observatory was located on the windward side of the prevailing wind,
10
local contamination occurred under the conditions of (1) wind blowing from the main area of Syowa station, (2) weaker winds (≤1 m sec−1) and (3) whenever snow vehi-cles passed through the windward side of the observatory. Figure 3 presents typ-ical example of local contamination caused by wind-blowing from the main area of Syowa station. When a wind flowed from the direction (0∼80◦) of the prevailing wind
15
with non-contamination sources, variations of BC and CN were very slight. However, the concentrations of BC and CN increased drastically in the case of wind direction 190∼320◦ approximately, which correspond to the direction of the main area with the diesel power station. This wind sector can be identified as a “dirty air sector” at the observatory. Since the CN concentration is also very sensitive to local contamination,
20
wind data and CN data were used to detect local contamination. In the present study, we defined wind direction of 330◦∼0◦∼180◦as “the clean air sector” and 180◦∼330◦the dirty air (locally-contaminable) sector”. All BC data in the case of wind blowing from the dirty air sector or with wind speed <2 m s−1 were removed from the analysis. In addition, BC data was also filtered when the standard deviation of 10-minute-mean CN
25
concentration was >10% and the wind speed <15 m s−1, in order to remove the local contamination from the moving contamination sources (e.g., snow vehicles). When the wind speed exceeded 15 m s−1, it flowed from the direction of the prevailing wind (clean
ACPD
8, 9883–9929, 2008 Black carbon at Syowa station, Antarctica K. Hara et al. Title Page Abstract Introduction Conclusions References Tables Figures ◭ ◮ ◭ ◮ Back CloseFull Screen / Esc
Printer-friendly Version Interactive Discussion
air sector), as shown in Fig. 4, and drifting snow was often observed. The drifting snow caused a larger standard deviation of 10-minute-mean CN concentration in spite of wind blowing from the clean air sector. Moreover, snow vehicles were not operated in the windward side (sea-ice area) under the conditions of strong wind and low visibility because of a safety guideline of the JARE. For these reasons, we retained the BC data
5
as “non-contaminated data” in the case of wind speeds >15 m s−1. Since wavelength of the light source in PSAP is 565 nm, we used the BC data of the wavelength of 520 and 590 nm in the aethalometer. Multi-wave BC data (wavelength dependence of absorp-tion properties) will be discussed together with aerosol optical properties, elsewhere.
4 Results and discussion
10
4.1 Transport processes and pathway of BC at Syowa station
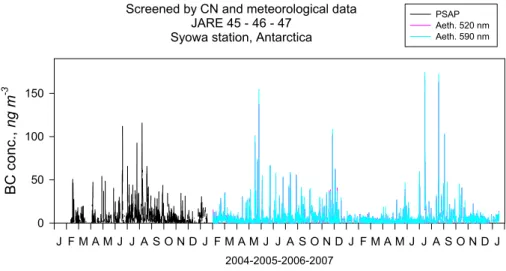
The variation of the hourly-mean BC concentration during JARE 45–47 (2004–2007) at Syowa is shown in Fig. 5. Hourly mean BC concentrations at Syowa ranged from below detection limit (BDL) to 176 ng m−3during our measurements. Many spike peaks were observed even in the filtered BC data. The BC peaks were frequently obtained
15
in winter/spring, with relatively fewer appearing in the austral summer. BC concentra-tions in the peaks increased drastically by several tens – hundred times higher than the background BC concentration (BDL ∼3 ng m−3). The many spike peaks of BC concen-tration were also observed at Halley (Wolff and Cachier, 1988) and Amundsen-Scott (Bodhaine, 1995). Higher BC concentrations were observed under the strong wind
20
(mainly blizzard) conditions at Syowa. In the present study, we classified BC transport processes into transport by (1) cyclone, (2) blocking event, and (3) katabatic wind. We attempt to compare and discuss the details of BC transport processes and pathway in the following section.
ACPD
8, 9883–9929, 2008 Black carbon at Syowa station, Antarctica K. Hara et al. Title Page Abstract Introduction Conclusions References Tables Figures ◭ ◮ ◭ ◮ Back CloseFull Screen / Esc
Printer-friendly Version Interactive Discussion
4.1.1 BC injection into Syowa station by cyclone
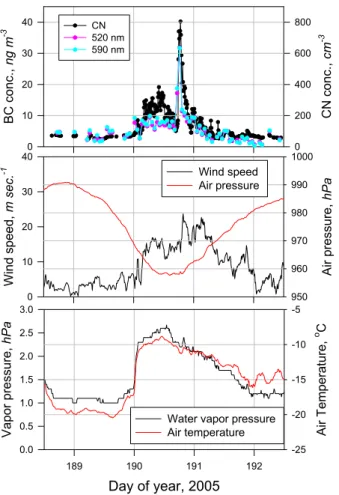
Figure 6 indicates short-term variations of meteorological data and the concentrations of BC and CN in BC peak event at Syowa. The BC concentration increased sharply from the background level (about 3 ng m−3) to 32 ng m−3 in coincidence with strong winds and a decrease of air pressure. The CN concentration also increased from
5
ca. 80 cm−3 to 800 cm−3 during higher BC concentration episodes. In addition, wa-ter vapor pressure and air temperature also increased in the higher BC concentration phases. This coincidence indicates that BC was enhanced in the warm and humid air mass, which may be attributed to meridional transport from the mid-latitudes by the ap-proach of a cyclone. As shown in Fig. 7, a cyclone apap-proached gradually off shore from
10
Syowa (ca. 30◦E) from 10◦W for 5 days. A five-day backward trajectory suggested air mass loading high BC concentration came from the southern Atlantic Ocean and off-shore South American continent in the case of BC peaks of 10–11 July 2005. Similar to this BC peak event, as shown in Fig. 6, most (>90%) of BC peak events at Syowa were observed in strong wind (blizzard conditions) due to the approach of the cyclone.
15
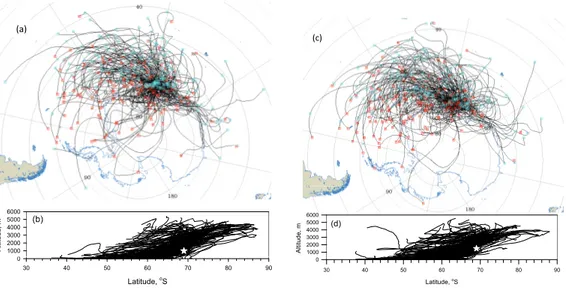
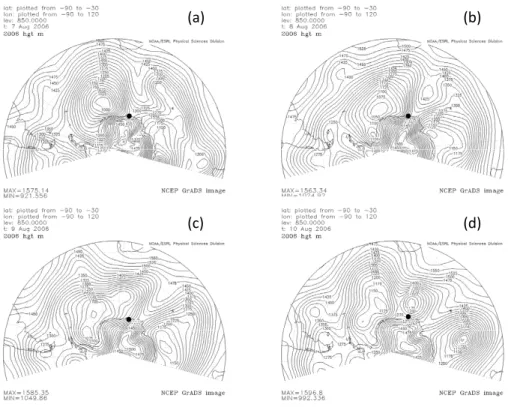
In order to discuss the transport pathway of the air mass transporting the higher BC concentration into Syowa by cyclone, we attempt to compare the pathway and ge-ographical distributions of the lowest latitudinal points during the five day backward trajectory from 1000 and 1500 m a.s.l. over Syowa, as shown in Fig. 8. The back-ward trajectory of vertical motion mode was calculated by the HYSPLIT model
us-20
ing a reanalysis meteorological dataset (Draxler and Rolph, 2003). In most cases, the cyclone approached eastward to off Syowa, as indicated in Fig. 7, while some cyclones moved westward. The lowest latitudinal points in the trajectory from 1000 and 1500 m a.s.l. were distributed mainly in the zone of 50∼60◦S and 30◦W∼50◦E (southern Atlantic Ocean∼Indian Ocean), whereas some points were located in more
25
easterly than 90◦E owing to the westward approach of the cyclone. During our mea-surements, the latitudes of the lowest latitudinal points in each trajectory were located in 37∼38◦S, offshore the southern African continent. The zone overlaps with the storm
ACPD
8, 9883–9929, 2008 Black carbon at Syowa station, Antarctica K. Hara et al. Title Page Abstract Introduction Conclusions References Tables Figures ◭ ◮ ◭ ◮ Back CloseFull Screen / Esc
Printer-friendly Version Interactive Discussion
track of the Southern Ocean. Furthermore, the BC-rich air masses were transported from mid-latitudes to Syowa via the lower troposphere, as shown in Figure 8c and d, though CO2 measurements indicated long range transport of CO2 through the upper troposphere from low latitudes (Murayama et al., 1995; Aoki and Nakazawa, 1997). Consequently, most of the air masses carrying BC appear to come from the Atlantic
5
and Indian Oceans via the lower troposphere arriving on the eastward (occasionally westward) approach of a cyclone. In addition to BC injection via the lower troposphere, the approach of cyclones also enhanced the number density of aerosol particles in the free troposphere over the Antarctic coast (Yamanouchi et al., 1999). Furthermore, long-range transport of sea-salt particles into the inland area by cyclone was observed
10
at the Dome Fuji station (Hara et al., 2004). Therefore, BC can be transported not only to Syowa but also to the inland area under storm conditions caused by approach of a cyclone.
If the suggested transport pathways from the Atlantic and Indian Ocean are essen-tially correct, the BC variation at Syowa should be associated with the BC
concen-15
tration in the marine boundary layer and the lower free troposphere over the Atlantic and Indian Ocean. Previous ship-borne BC measurements indicated BC concentra-tions in the range of <10 ng m−3 in January–April over the southern Indian Ocean (<56◦S) (Moorthy et al., 2005), and 20∼80 ng m−3 in October∼December over the Indian Ocean∼Southern Ocean (Sakerin et al., 2007). Ranges of <10∼160 ng m−3 in
20
October∼November and <10∼120 ng m−3in February∼March were observed over the southern Atlantic Ocean (close to the Southern American continent) – Southern Ocean (Evangelista et al., 2007). These ranges of BC concentrations were coincident with BC concentration in each month at Syowa except higher BC concentration in the marine boundary layer close to Southern American continent. Furthermore, the seasonal
vari-25
ation of BC concentration at Syowa was similar to that at Amsterdam Island (Cachier et al., 1996; Wolff and Cachier, 1998), as described in 4.2. Cahier et al., (1996) suggested that the BC concentration at Amsterdam Island was related to biomass burning in the southern hemisphere. According to satellite (MODIS) measurements of biomass
burn-ACPD
8, 9883–9929, 2008 Black carbon at Syowa station, Antarctica K. Hara et al. Title Page Abstract Introduction Conclusions References Tables Figures ◭ ◮ ◭ ◮ Back CloseFull Screen / Esc
Printer-friendly Version Interactive Discussion
ing in the southern hemisphere, constituents from biomass burning on the African and South American continents are mainly dispersed into the Atlantic and Indian Ocean (Edwards et al., 2006a, 2006b). Therefore, the higher BC concentration at the Syowa station might be attributed to long-range transport from mid-latitudes of the Atlantic and Indian Ocean, where many atmospheric components were enhanced due to the
5
outflow of the plume caused by biomass burning in the dry seasons. The details of the seasonal variation will be discussed in Sect. 4.2.
4.1.2 BC injection by blocking event
In addition to BC injection into Antarctic regions by cyclone, a few cases of BC peak events were also identified in blocking events during our ca. 3 year measurement
cam-10
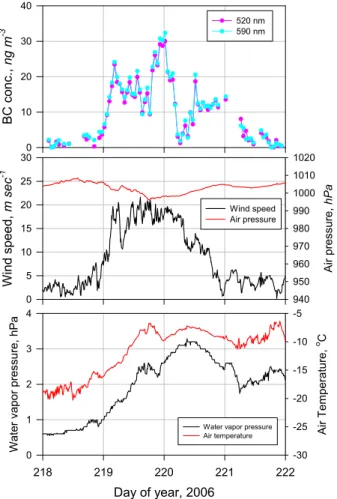
paign. A typical case of BC transport by a blocking event on 8–10 August 2006 is shown in Fig. 9. Since the BC concentration increased in strong winds associated with increase of water vapor pressure and air temperature, the air mass might have been supposed to come from mid-latitudes, similar to long-range transport of BC due to cy-clone. The air pressure, however, did not drop significantly, only decreasing from 1010
15
to 1005 hPa.
As indicated in Fig. 10, a cyclone was located around 67◦S 10◦W on 8–9 August, whereas another large anticyclone approached southwardly to around 53◦S 45◦E. As a result, a very large gradient of air pressure was distributed around Syowa. Also, the southward approach of the anticyclone led to direct poleward air flow from the Indian
20
Ocean between cyclone and anticyclone. Indeed, the backward trajectory showed the direct transport from Indian∼Atlantic Ocean over the previous five days. Thus, the increase of BC concentration occurred also under the strong wind conditions due to a blocking event caused by the southward approach of the anticyclone. When an anticyclone approaches to the higher latitude, an air mass with higher BC concentration
25
in the mid-latitude can be transported deeply into the continental area, as suggested from the blocking events of the anticyclone (Hirasawa et al., 2000; Hara et al., 2004; Suzuki et al., 2004; Massom et al., 2004). Hence, the poleward air flow due to a
ACPD
8, 9883–9929, 2008 Black carbon at Syowa station, Antarctica K. Hara et al. Title Page Abstract Introduction Conclusions References Tables Figures ◭ ◮ ◭ ◮ Back CloseFull Screen / Esc
Printer-friendly Version Interactive Discussion
blocking event resulting from the southward movement of anticyclone might result in efficient injection of atmospheric constituents such as BC into the Antarctic regions.
4.1.3 Small scale increases of BC concentration at Syowa under the strong winds
As mentioned above, BC concentrations increased under strong wind conditions, while smaller increases of BC concentration were occasionally identified at Syowa
5
even under strong wind conditions, as shown in Fig. 11. During the strong wind on DOY=158.0–159.0 (8–9 June) of 2005, the BC concentration increased slightly by ca. 3 ng m−3 corresponding to higher temperature and water vapor pressure. The in-crease of air temperature and water vapor pressure is likely to be related to mixing of warm and humid air mass as well as to BC transport by cyclone and blocking event
10
(4.1.1. and 4.1.2.). The backward trajectory, however, in the case of the slight increase of BC concentration indicates that the air mass was transported from coastal Antarctic regions or inland area during the prior five days, so that the long range transport of BC from mid-latitudes to Antarctic regions may be predated by five days. In contrast, preferential CO2 transport in the upper troposphere from low- and mid- latitudes into
15
the Antarctic region and then vertical mixing was indicated from long-term CO2 mea-surements at Syowa and by airplane meamea-surements (Murayama et al., 1995; Aoki and Nakazawa, 1997). The BC concentration, however, did not increase significantly in the continental and coastal air masses in this case as shown in Fig. 11. Thus, BC trans-port in the upper troposphere during the winter – spring may have only an insignificant
20
contribution to BC peak events at Syowa. This difference may be related to difference of lifetime between aerosol particles (e.g., BC) and CO2. Aerosol particles (including those of BC) will most probably be scavenged from the atmosphere by precipitation during transport. Therefore, the lower than expected BC increase in the strong winds might be caused by scavenging onto snow surfaces by precipitation during the
trans-25
ACPD
8, 9883–9929, 2008 Black carbon at Syowa station, Antarctica K. Hara et al. Title Page Abstract Introduction Conclusions References Tables Figures ◭ ◮ ◭ ◮ Back CloseFull Screen / Esc
Printer-friendly Version Interactive Discussion
4.1.4 BC transport by katabatic wind
Figure 12 indicates short term variations of BC concentration and surface wind speed at Syowa. Usually at Syowa, compared to the other seasons the weather is more stable from November to the end of January owing to low frequency of blizzard con-ditions (Sato and Hirasawa, 2007). During this period, the surface wind speed at
5
Syowa often showed a diurnal variation with a maximum at night and a minimum in afternoon∼evening. Likewise, the BC concentration was higher at nighttime, when the diurnal variation of surface wind speed was clearly observed (arrows in Fig. 12). A stronger wind in the nighttime blew from the direction of the prevailing wind without lo-cal BC sources due to katabatic wind from the continent, so that the lolo-cal BC sources
10
cannot account for the higher BC nighttime concentration. According to Sato and Hira-sawa (2007), the diurnal variation of the surface wind speed at Syowa is caused by the diurnal variation of katabatic wind.
In the Antarctic Plateau and interior, loss of radiation energy causes a strong tem-perature inversion near the surface. The surface inversion layer implies a horizontal
15
gradient of density of air mass along the slope of the continent. Thus, this gradient in-duces strong air flow, referred to as “katabatic wind”, from the interior (Plateau) toward the coastal area as shown by Parish and Bromwich (1987) and Parish (1988). Tra-jectory analysis indicated that transport from the continent by katabatic wind was an important flow pattern in the summer (November–February) at Syowa (Suzuki et al.,
20
2004; Suzuki, personal communication). Considering that katabatic wind blew from the inland area to the coastal area, the diurnal variation indicated that BC was enhanced in the katabatic wind, in other words, in the continental air mass.
Plausible BC sources on the Antarctic continent in the summer are human ac-tivity only in the inland research station (e.g., Amundsen-Scott, Dome Fuji and
25
Kohnen) and traverses using snow vehicles. The closest operating inland station from Syowa is the Dome Fuji station (77.19◦S 39.42◦E, 3810 m a.s.l.), which, during our measurements (JARE45 – 47: 2004–2007), was operated only in the
summer-ACPD
8, 9883–9929, 2008 Black carbon at Syowa station, Antarctica K. Hara et al. Title Page Abstract Introduction Conclusions References Tables Figures ◭ ◮ ◭ ◮ Back CloseFull Screen / Esc
Printer-friendly Version Interactive Discussion
time (November∼January) for deep-ice coring operations. Dome Fuji is located about 1000 km away from Syowa and has only small-scale human activity. Thus, human ac-tivity at Dome Fuji will likely be too far and too small to make any noticeable influence on the diurnal variation of BC concentration at Syowa even if the air mass containing atmospheric constituents from the diesel power generator there was directly
trans-5
ported toward Syowa. Nevertheless, the BC concentration in katabatic winds at Syowa increased occasionally by >10 ng m−3 (as shown in Fig. 12). This range of BC con-centrations was in good agreement with the range of BC concon-centrations observed at Amundsen-Scott during the summer (Bodhaine, 1995). Therefore, the higher BC con-centration in katabatic wind may correspond to the background BC concon-centration in the
10
Antarctic continental atmosphere.
The diurnal variation suggests that BC concentrations in the coastal area of east Antarctic region (e.g., Syowa) are lower than those in the continental atmosphere (Amundsen-Scott) (Bodhaine, 1995), although the BC concentrations at Halley (Wolff and Cachier, 1998), Neumayer (R. Weller, personal communication) and Ferraz
15
(Pereira et al., 2006) were higher than at Syowa. This spatial variation of BC is im-portant in understanding the BC transport processes into Antarctic regions during the summer. BC transport via the lower troposphere cannot account for the higher BC concentration in continental air than that in the coastal area (e.g., Syowa). A plausi-ble explanation for BC enhancement in the continental atmosphere may be long-range
20
transport via the free troposphere from low and mid- latitudes into Antarctic regions rather than lower troposphere in the eastern Antarctic region. Although direct evidence of BC has not been obtained in the Antarctic free troposphere, mineral particles and sea-salt particles from the mid-latitudes were identified in the aerosol samples col-lected in 4500 and 6000 m asl over Syowa during the summer (Hara et al., 2006).
Fur-25
thermore, a higher Rn concentration in the free troposphere relative to the boundary layer was also obtained in the coastal Antarctic area over Dumont d’Urville (66.40◦S, 140.01◦E) (Polian et al., 1986). Also, CO2 was transported through the upper tropo-sphere from low- and mid- latitudes into Antarctica in the summer (Murayama et al.,
ACPD
8, 9883–9929, 2008 Black carbon at Syowa station, Antarctica K. Hara et al. Title Page Abstract Introduction Conclusions References Tables Figures ◭ ◮ ◭ ◮ Back CloseFull Screen / Esc
Printer-friendly Version Interactive Discussion
1995; Aoki and Nakazawa, 1997). Although long-range transport via the lower tropo-sphere by frequent storm conditions lead to many BC peaks during the winter – spring as mentioned above, these previous investigations suggest favorable BC transport via the free troposphere toward the Antarctic region during the summer. Thus, BC is likely to be transported to the coastal area by vertical mixing and a katabatic wind from the
5
continent with a diurnal variation.
4.2 Seasonal variations of BC at Syowa station
Figure 13 shows the monthly-mean BC concentrations at Syowa during JARE45-47 (February 2004–January 2007). The three year averaged data exhibits clear sea-sonal variations with a maximum (9 ng m−3) in winter/spring and a minimum (2 ng m−3)
10
in summer∼early autumn. Furthermore, the variability of the BC concentration was larger in the winter∼spring (May∼October) and smaller in the summer∼autumn (November∼April). The seasonal feature of the variability and BC concentration may be associated with the frequency of blizzard conditions, as higher BC concentrations were observed in blizzards. On one occasion a maximum in July∼August was obtained in
15
2004, whereas BC variations had double maxima in May and July∼September in 2005 and 2006. In contrast to the seasonal variation at Syowa, BC concentrations showed maxima or higher concentrations in the summer (November–February) at Amundsen-Scott (Bodhaine, 1995), Halley (Wolff and Cachier, 1998), Neumayer (R. Weller, private communication), and Ferraz (Pereirra et al., 2006), whereas BC variations at
Amster-20
dam Island (37◦S 77◦E) were very similar to those at Syowa (Cachier et al., 1996). It is expected that this difference is related to the spatial distribution of BC in the MBL of mid-latitudes and transport pathways into the Antarctic coast. We will discuss the seasonal variation of BC at Syowa and differences between Syowa and other stations in the next section.
ACPD
8, 9883–9929, 2008 Black carbon at Syowa station, Antarctica K. Hara et al. Title Page Abstract Introduction Conclusions References Tables Figures ◭ ◮ ◭ ◮ Back CloseFull Screen / Esc
Printer-friendly Version Interactive Discussion
4.2.1 Seasonal variation of BC at Syowa and the similarity in Amsterdam Island
The similar variation in Amsterdam Island strongly suggests that Syowa and Ams-terdam Island were under the same influence from the same BC sources, because air mass carrying high BC concentrations at Syowa came from the Indian and Atlantic Oceans. Continuous CO measurement at Syowa demonstrated a maximum in August–
5
September (Morimoto et al., 2002). According to the measurements of BC (Cachier et al., 1996) and trace gases (Gros et al., 1998, 1999) at the Amsterdam Island site, the maximum of BC and trace gases (e.g. CO) in August–September could be attributed to biomass burning mainly in southern Africa and Madagascar. Satellite observation indicate that CO and aerosol particles spread from Southern Africa and south America
10
to the Atlantic and Indian Ocean during the winter/spring (higher in August–October) (Edwards et al., 2006a,b). As shown in Fig. 14, mean monthly wind field strongly sug-gests westerly winds can lead to favorable long-range transport of air mass from the Atlantic and Indian Ocean into the Southern Ocean where the lowest latitudinal points in the backward trajectory from Syowa were distributed. Thus, the maximum of BC
15
concentration in August at Syowa might be influenced significantly by biomass burning in southern Africa and South America.
In addition to a maximum in August at Syowa (Fig. 13), higher BC concentrations were often observed from the end of April due to the frequent BC injection shown in Fig. 4. For BC injection to Syowa (Antarctic coasts), BC must be dispersed in the MBL
20
of the mid-latitudes. African biomass burning started approximately in May and the fire spots spread across southern Africa by September (Edwards et al., 2006a; refer-ences therein), while higher concentrations of CO and aerosols from biomass burning in the monthly mean data were not obtained in the winter in Amsterdam Island (Ed-wards et al., 2006a), Crozet Island (46◦S, 51◦E) (Gros et al., 1999), and R ´eunion
25
Island (21.5◦S, 55.5◦E) (Bhugwant et al., 2001) in the Indian Ocean due to higher precipitation in May–June. Aerosol optical depth measurements in South Africa and Inhaca Island (26◦02′S, 32◦54′E), Mozambique indicated high levels of aerosol optical
ACPD
8, 9883–9929, 2008 Black carbon at Syowa station, Antarctica K. Hara et al. Title Page Abstract Introduction Conclusions References Tables Figures ◭ ◮ ◭ ◮ Back CloseFull Screen / Esc
Printer-friendly Version Interactive Discussion
depth were often observed in August, though their maximum was observed in Septem-ber (Queface et al., 2003). If outflow of the plume from fire spots on the continent and an eastward approach of a cyclone occurred simultaneously, BC might be injected rapidly into coastal Antarctic area (e.g., Syowa). Indeed, tracer transport simulations suggest that air masses in the mid-latitudes approach the Antarctic regions for several
5
days (Krinner and Genthon, 2003). Hence, BC derived from biomass burning mainly in Southern Africa and South America appears to be transported to Syowa even in the winter (May–August).
4.2.2 Difference of BC variation between Syowa and the other Antarctic stations
Different seasonal variations of BC were obtained in the spring (August–October) and
10
summer (November–February) between Syowa and the other Antarctic stations (Bod-haine, 1995, Wolff and Cachier, 1998, R. Weller, private communication, Pereirra et al., 2006). A spring BC maximum was observed in August at Syowa similar to Ams-terdam Island, whereas in the other Antarctic stations it occurred in October. Although the summer maximum of BC was clearly observed at Halley (Wolff and Cachier, 1998),
15
Ferraz (Pereirra et al., 2006), and Amundsen-Scott (Bodhaine, 1995), the summer maximum was not so clear at Syowa and only a slight increase of BC concentration (ca. 5 ng m−3) was obtained. This different seasonal variation of BC may reflect on differences in (1) spatial distribution of BC, (2) transport pathway of BC-rich air mass, and (3) contribution of each BC source region.
20
The BC concentration in the spring maximum at Syowa was >10 ng m−3in 3-year av-erage data (Fig. 13) and occasionally 100 ng m−3in hourly average data (Fig. 4). This BC level at Syowa was very high relative to level of BC concentration in August–October at Halley (Wolff and Cachier, 1998) and Neumayer (R. Weller, personal communica-tion), and remarkably similar to the BC concentration at Ferraz (Pereirra et al., 2006).
25
According to Edwards et al. (2006a), regional aerosol life time of 3.0±0.8 days was es-timated in the Indian Ocean using the distribution of aerosol optical depth obtained by MODIS. This estimation suggests that the concentrations of aerosol constituents such
ACPD
8, 9883–9929, 2008 Black carbon at Syowa station, Antarctica K. Hara et al. Title Page Abstract Introduction Conclusions References Tables Figures ◭ ◮ ◭ ◮ Back CloseFull Screen / Esc
Printer-friendly Version Interactive Discussion
as BC from biomass burning depend on the duration of transport and the distance from the source regions. Indeed, the seasonal variation of elemental carbon, which is also emitted from incomplete combustion processes, had its maximum not in August but in October in Cape Grim (40.7◦S, 144.7◦E) (Heintzenberg and Bigg, 1990). Consider-ing the BC maximum in August at Syowa and absence of the August maximum in the
5
western Antarctic coasts (Halley, Neumayer and Ferraz), it might be associated with the outflow from biomass burning in the Southern Africa rather than South America by the westward air flow shown in Fig. 14. Outflow of the air mass transporting the higher BC concentration from southern Africa cannot be a significant influence on the BC vari-ation in the western Antarctic regions (Halley, Neumayer and Ferraz), because of the
10
westward air flow around Antarctica (Fig. 14) and efficient scavenging by precipitation during the long-range transport.
On the other hand, BC maxima in October were observed at the coastal stations (Halley, Neumayer and Ferraz) and inland station (Amundsen-Scott). However, it is difficult to identify the BC maximum (or increase) in October at Syowa because of
15
the presence of the large BC maximum in August. The BC concentration in October (ca. 6 ng m−3in monthly average) at Syowa was similar to the range (<2∼9.6 ng m−3) in October at the western Antarctic coasts (Wolff and Cachier, 1998; Perrira et al., 2006; R. Weller, personal communication). In order to understand and identify the BC maximum in October, we need to discuss them together with variations of other aerosol
20
constituents (e.g., organics, NO−3, and non-sea-salt K+) derived from the combustion sources (e.g., biomass burning) in the future.
Obvious BC maxima in the summer were observed at Halley (Wolff and Cachier, 1998), Ferraz (Perrira et al., 2006), and Amundsen-Scott (Bodhaine, 1995), while only a slightly higher BC concentration was obtained at Syowa. This difference might reflect
25
the lower frequency of blizzard conditions at Syowa and large horizontal difference of BC concentration in the Atlantic (∼120 ng m−3) (Erangelis et al., 2007) and Indian Ocean (<10 ng m−3) during the summer (Moorthy et al., 2005).
ACPD
8, 9883–9929, 2008 Black carbon at Syowa station, Antarctica K. Hara et al. Title Page Abstract Introduction Conclusions References Tables Figures ◭ ◮ ◭ ◮ Back CloseFull Screen / Esc
Printer-friendly Version Interactive Discussion
4.2.3 Seasonal variation of the background BC concentration at Syowa
Considering that the storms (blizzards) and katabatic wind lead to significant BC in-crease at Syowa (as shown in Figs. 6 and 9), the BC concentration excluding the BC peaks under the strong wind conditions should correspond to the background BC concentration at Syowa. The background concentration in each month was estimated
5
from the mean BC concentration minus the BC peaks due to blizzard conditions and the katabatic wind in the summer. The background BC concentration at Syowa (as shown in Fig. 13d) has a minimum (or lower) in the winter (April–June), higher in the spring (August–October) and maximum in the summer (November–February), similar to the seasonal variation at Amundsen-Scott (Bodhaine, 1995) and Halley (Wolff and
10
Cachier, 1998). This coincidence suggests the role of the same BC transport pro-cesses in both the eastern and western Antarctica. Because of the low frequency of blizzards and the diurnal variation of BC at Syowa during the summer, long-range transport via free troposphere might play an important role in the higher background BC concentration in the summer, in addition to BC injection by long range transport via
15
lower troposphere in the western Antarctic area. Bearing in mind that biomass burning occurs between May and October in Africa and South America (Edwards e al., 2006a and references therein; Ito et al., 2007), BC in the free troposphere during the sum-mer might be transported from other regions such as low-latitude areas and Australia where biomass burning is observed even in the austral summer. In order to obtain
20
more certainty about the contribution of each BC source area and seasonal variation of BC in Antarctica, more field observations and comparison with model calculations will be needed in the future.
4.3 Transport flux of BC into Syowa station
BC was transported from the mid- and low- latitudes via the lower troposphere and
25
free troposphere as described above. Since the BC peak events were observed only during long range transport under storm conditions in the winter–spring and via the
ACPD
8, 9883–9929, 2008 Black carbon at Syowa station, Antarctica K. Hara et al. Title Page Abstract Introduction Conclusions References Tables Figures ◭ ◮ ◭ ◮ Back CloseFull Screen / Esc
Printer-friendly Version Interactive Discussion
free troposphere in the summer, we assumed that the variation of BC concentration can be classified into the BC peaks and the background BC level (non-BC peak) in the present study. In order to discuss the amount of the transported BC to Syowa by storm (blizzard) conditions, katabatic wind (via free troposphere) and its seasonal variation, the BC transport flux ((BC)transportflux) was estimated in each month using the following
5
equation, [BC]transport flux =
X
([BC]excess×[Wind speed]).
Here, (BC)excessmeans the difference between the ambient BC concentration and the background BC concentration in Fig. 13d. Hourly averaged BC and wind speed data were used for the estimation. The wind direction for wind speeds larger than 10 m sec−1
10
ranged mostly in the prevailing wind sector of 0∼90◦E because of katabatic wind and topographic effect by coastal line of Lutzow Holm bay. Thus, the BC transport flux in the present study includes transport processes via (1) the lower troposphere under the strong wind conditions caused by the approach of cyclones and blocking events, and (2) the free troposphere and katabatic wind. Both transport pathways, however, cannot
15
be specifically assigned in our estimation.
Figure 15 shows the seasonal variation of the BC transport flux toward Syowa. Unfortunately, data loss occurred twice for several days∼one week in August and October 2006 due to mechanical problems. Fortunately, the data loss did not oc-cur under the strong wind conditions due to approach of cyclone and anticyclone,
20
so that BC transport flux in August and October of 2006 might be underestimated very slightly by the data loss. The annual BC transport flux was estimated to be as follows; 1.09 g m−2yr−1 in 2004 (JARE45), 0.99 g m−2yr−1 (wavelength 520 nm) and 1.03 g m−2yr−1 (wavelength 590 nm) in 2005 (JARE46), and 0.68 g m−2yr−1 (wave-length 520 nm) and 0.72 g m−2yr−1(wavelength 590 nm) in 2006 (JARE47).
25
BC transport flux in the winter increased up to one order larger (∼276 mg m−2 month−1) than that (<50 mg m−2 month−1) in the summer. This seasonal variation was closely related to the variation of BC concentration in the atmosphere and the
fre-ACPD
8, 9883–9929, 2008 Black carbon at Syowa station, Antarctica K. Hara et al. Title Page Abstract Introduction Conclusions References Tables Figures ◭ ◮ ◭ ◮ Back CloseFull Screen / Esc
Printer-friendly Version Interactive Discussion
quency of blizzard events. The moisture transport flux was also higher in winter than summer (Ohshima and Yamazaki, 2004). Although the higher transport fluxes were often observed in the winter/spring, seasonal variation of the flux was different in each year. In order to compare the difference of seasonal variation of BC transport flux in each year, we estimated the duration of winds stronger than 20 m sec−1in each month
5
(Fig. 15a).
In 2004 (JARE 45), the highest BC flux (168 mg m−2month−1) was observed in June 2004 corresponding to the longest duration (ca. 94 h) of strong wind (>20 m s−1). In contrast, the duration of the strong wind (>20 m s−1) was less than 15 h in July and August, 2004. Nevertheless, the flux increased by 141 and 147 mg m−2 month−1 in
10
July and August, respectively. Since the BC concentration increased up to 92.6 ng m−3 in July and 130.8 ng m−3 in August 2004 under the strong wind (blizzard) conditions (see Fig. 5), this high BC concentration appears to cause the higher BC transport flux even in July and August 2004 with shorter time length and strong winds (20 m s−1). In other words, very BC-rich air mass reached Syowa from the mid-latitudes in July and
15
August, 2004 (JARE45). Details of long-range transport of very BC-rich air mass to Syowa will be discussed elsewhere.
In 2005 (JARE46), the seasonal variation of the BC transport flux was coincident with the variation in the duration of strong winds (>20 m s−1). Also, higher BC concen-trations were often observed under storm (blizzard) conditions during the winter/spring,
20
as shown in Fig. 5. Accordingly, the frequent increase of BC concentration and strong winds may lead to higher BC transport flux in the winter of 2005 (JARE46).
In contrast, BC transport flux dropped to 60 mg m−2month−1in June 2006 (JARE47), when the duration of strong winds (>20 m sec−1) was less than 15 h, similar to that in July and August 2004. Although strong wind events (>10 m s−1) were observed
25
several times in June 2006, the BC peak event was obtained only in 26–28 June 2006 (see Fig. 5) when the BC concentration increased up to 57.7 ng m−3. According to 5 day backward trajectory from 1000 and 1500 m a.s.l. over Syowa, in June 2006 air masses without significant increase of BC concentration had been transported from
ACPD
8, 9883–9929, 2008 Black carbon at Syowa station, Antarctica K. Hara et al. Title Page Abstract Introduction Conclusions References Tables Figures ◭ ◮ ◭ ◮ Back CloseFull Screen / Esc
Printer-friendly Version Interactive Discussion
the Antarctic coastal or continental area for the previous 5 days. Apparently, the lower BC flux in June 2006 may have been caused by reduction of the poleward transport from mid-latitudes. Therefore, the BC transport flux may be associated with frequent blizzard and BC injection events from mid-latitudes into Antarctic coasts in the winter– spring.
5
In contrast to the winter–spring, the frequency of blizzard events was lower in the summer at Syowa as shown in Fig. 15 and Sato and Hirasawa (2007). As mentioned in Sect. 4.1.4., BC was transported from the inland area to Syowa through katabatic wind and free troposphere during the summer. Hence, the BC transport flux in the summer is likely to correspond to the upper limit of BC transport via the free troposphere.
There-10
fore, the contribution of BC transport via the free troposphere might become relatively important to the ambient BC concentration at Syowa during the summer, despite that BC transport flux via the free troposphere makes only a minor contribution to the annual BC transport flux. It should be noted, however, that scavenging of BC by precipitation by, for example, snow and diamond dust during the transport can result in a decrease
15
of the ambient BC concentration and under-estimation of the upper limit of transport flux via the free troposphere. In order to obtain the BC transport flux into Antarctica via katabatic wind and free troposphere, BC measurements at a continental (inland) station and in the free troposphere will be required in the future. Considering that BC is dominantly derived from combustion processes on other continents, its transport flux
20
can be applied to understand long-range transport of aerosol particles (e.g., mineral and anthropogenic species) derived from these sources.
5 Conclusions
BC measurements were made at Syowa station, East Antarctica from February 2004 (JARE45) until January 2007 (JARE47). The concentrations at Syowa ranged in BDL
25
–170 ng m−3 in hourly-mean. Higher BC concentrations were obtained during storm (blizzard) conditions resulting mainly from the approach of cyclones and occasional
ACPD
8, 9883–9929, 2008 Black carbon at Syowa station, Antarctica K. Hara et al. Title Page Abstract Introduction Conclusions References Tables Figures ◭ ◮ ◭ ◮ Back CloseFull Screen / Esc
Printer-friendly Version Interactive Discussion
blocking events. BC-rich air masses may be predominantly transported from the boundary layer of the Atlantic and Indian Oceans to Syowa (coastal Antarctic region) via the lower troposphere in the winter/spring. In contrast, BC concentrations during the summer (November–February) showed a diurnal variation with high BC concentration at nighttime linked to surface wind speed. This diurnal variation of surface wind may
5
be attributed to the diurnal variation of a katabatic wind with a maximum at nighttime and a minimum in daytime, as suggested by Sato and Hirasawa (2007). Considering that the BC concentration in the katabatic wind corresponded to that in the Antarctic continental atmosphere without significant BC sources (Bodhaine, 1995), BC might be transported from the mid-latitudes into Antarctic regions via the free troposphere.
10
The seasonal variation of BC at Syowa showed a maximum in August, while at Hal-ley (Wolff and Cachier, 1998), Ferraz (Pereira et al., 2006), Neumayer (R. Weller, per-sonal communication) and Amundsen-Scott (Bodhaine, 1995), the maximum was in October. The seasonal variation of BC at Syowa was similar to that in Amsterdam Is-land (Cachier et al., 1995). Measurements of trace gases (Gros et al., 1998, 1999) and
15
aerosols (Cachier et al., 1995) suggested a large contribution of biomass burning in the African continent to BC variation in Amsterdam Island. Considering BC-rich air mass at Syowa originating from Indian and Atlantic Ocean, BC at Syowa might be derived from biomass burning in South America and Southern Africa. Furthermore, scavenging of aerosol particles leads to a shorter life time of BC and the spatial gradient of BC
con-20
centration, so that the BC maximum in August at Syowa might result from an outflow of BC-rich air mass from biomass burning in Southern Africa. Because of the large BC maximum in August at Syowa it is difficult to identify the BC maximum there in Oc-tober, though the BC concentration in October corresponded to the BC concentration in October in the other Antarctic stations. The higher BC concentration in the winter
25
(May∼August) might be also associated with biomass burning in the mid-latitudes. The BC transport flux was estimated from BC concentration and surface wind data at Syowa. Seasonal variations in the transport flux indicated that BC transport via lower troposphere showed a maximum (∼276 mg m−3month−1) during the winter–spring and
ACPD
8, 9883–9929, 2008 Black carbon at Syowa station, Antarctica K. Hara et al. Title Page Abstract Introduction Conclusions References Tables Figures ◭ ◮ ◭ ◮ Back CloseFull Screen / Esc
Printer-friendly Version Interactive Discussion
a minimum (<50 mg m−3 month−1) in the summer. Seasonal variation of the BC trans-port flux suggests that the blizzard events can make a significant contribution to pole-ward long-range transport of aerosol particles from the mid- latitudes to both coastal and continental regions in Antarctica during the winter–spring. Because of infrequent blizzards during the summer (November–February), the flux may correspond to the
5
upper limit of the transport flux via the free troposphere and katabatic winds. In spite of the minor contribution to annual transport flux, long-range transport via the free tro-posphere and katabatic winds might become important during the summer, at least, in the east of Antarctica. This obvious change of dominant transport processes will be im-portant in discussions of the variations of atmospheric constituents and interpretation
10
of ice core records.
Acknowledgements. We thank the members of 45, 46 and 47th Japanese Antarctic Research Expedition for help of aerosol measurements at Syowa. This study was supported by “Ob-servation project of global atmospheric change in the Antarctic” for JARE 43–47. This work was also supported by Grant-in Aid (No. 16253001, PI: T. Yamanouchi, and No. 15310012,
15
PI: K. Osada) from the Ministry of Education, Culture, Sports, Science and Technology of Japan. The authors gratefully acknowledge the NOAA Air Resources Laboratory (ARL) for the provision of the HYSPLIT transport and dispersion model and/or READY website (http://www.arl.noaa.gov/ready.html) used in this publication.
References
20
Aoki, S., Nakazawa, T., Murayama, S., and Kawaguchi, S.: Measurements of atmospheric methane at the Japanese Antarctic station, Syowa, Tellus, 44B, 273–281, 1992.
Aoki, S. and Nakazawa, T.: Continuous measurement of atmospheric CO2 concentration at
Syowa station (in Japanese), Antarctic Record, 41, 161–176, 1997.
Aoki, T., Fukabori, M., Tachibana, Y., Zaizen, Y., Nishio, F., and Oishi, T.: Spectral albedo
25
observation on the snow field at Barrow, Alaska, Polar Meteorol. Glaciol., 12, 1–9, 1998. Basile, I., Grousset, F. E., Revel, M., Petit, J. R., Biscaye, P. E., and Barkov, N.: Patagonian
ACPD
8, 9883–9929, 2008 Black carbon at Syowa station, Antarctica K. Hara et al. Title Page Abstract Introduction Conclusions References Tables Figures ◭ ◮ ◭ ◮ Back CloseFull Screen / Esc
Printer-friendly Version Interactive Discussion
origin of glacial dust deposited in the east Antarctica (Vostok and Dome C) during glacial stages 2, 4, and 6, Earth Planet. Sci. Lett., 146, 573–589, 1997.
Bhugwant, C., Rivi `ere, E., Keckhut, P., and Leveau, J.: Variability of carbonaceous aerosols, ozone, and radon at Piton Textor, a mountain site on R ´eunion island (south-western Indian Ocean), Tellus, 53B, 546–563, 2001.
5
Bodhaine, B. A.: Aerosol absorption measurements at Barrow, Mauna Loa and the South Pole, J. Geophys. Res., 100, 8967–8975, 1995.
Cachier, H., Liousse, C., Pertuisot, M., Gaudichet, A., Echalar, F. and Lacaux, J.: African fire emissions and atmospheric influence, in “Biomass burning and global change volume 1, edited by: J. S. Levine” 428–440, 1996.
10
Delmonte, B., Petit, J. R., Andersen, K. K., Basile-Doelsch, I., Maggi, V., and Lipenkov, V. Y.: Dust size evidence for opposite regional atmospheric circulation changes over east Antarc-tica during the last climate transition, Clim. Dynam., 23, 427–438, 2004.
Draxler, R. R. and Rolph, G. D.: HYSPLIT (HYbrid Single-Particle Lagrangian Integrated
Trajec-tory) Model access via NOAA ARL READY Website (http://www.arl.noaa.gov/ready/hysplit4.
15
html), NOAA Air Resources Laboratory, Silver Spring, MD, 2003
Edwards D. P., Emmons, L. K., Gille, J. C., Chu, A., Atti ´e, J.-L., Giglio, L., Wood, S. W., Haywood, J., Deeter, M. N., Massie, S. T., Ziskin, D. C., and Drummond, J. R.: Satellite-observed pollution from Southern Hemisphere biomass burning, J. Geophys. Res., 111, D14312, doi:10.1029/2005JD006655, 2006a.
20
Edwards D. P., P ´etron, G., Novelli, P. C., Emmons, L. K., Gille, J. C., and Drum-mond J. R.: Southern Hemisphere carbon monoxide interannual variability observed by Terra/Measurement of Pollution in the Troposphere (MOPITT), J. Geophys. Res., 111, D16303, doi:10.1029/2006JD007079, 2006b.
Evangelista, H., Maldonado, J., Godoi, R. H. M., Pereira, E. B., Koch, D., Tanizaki-Fonseca, K.,
25
Van Grieken, R., Sampaio, M., Setzer, A., Alencarand, A., and Gonc¸alves, S. C.: Sources and Transport of Urban and Biomass Burning Aerosol black carbon at the South–West At-lantic Coast, J. Atmos. Chem., 56, 225–238, 2007.
Gros. V., Poisson, N., Martin, D., Kanakidou, M., and Bonsang, B.: Observations and modeling of the seasonal variation of surface ozone at Amsterdam Island: 1994–1996, J. Geophys.
30
Res., 103, 28 103–28 109, 1998.
Gros. V., Bonsang, B., Martin, D., Novelli, P. C., and Kazan, V.: Carbon monoxide short term measurements at Amsterdam Island: estimations of biomass burning rates, Chemosphere:
ACPD
8, 9883–9929, 2008 Black carbon at Syowa station, Antarctica K. Hara et al. Title Page Abstract Introduction Conclusions References Tables Figures ◭ ◮ ◭ ◮ Back CloseFull Screen / Esc
Printer-friendly Version Interactive Discussion
Global Change Sci., 1, 163–172, 1999.
Hansen, A. D. A., Bodhaine, B. A., Dutton, E. G., and Schnell, R. C.: Aerosol black carbon measurements at the South Pole: Initial results, 1986–1987, Geophys. Res. Lett., 15, 1193– 1196, 1988.
Hansen, A. D. A., Lowenthal, D. H., Chow, J. C., and Watson, J. G.: Black carbon aerosol at
5
McMurdo station, Antarctica, J. Air and Waste Manage. Assoc., 51, 593–600, 2001.
Hansen, A. D. A.: the aethalometer, Magee Scientific (http://www.mageesci.com), 2003.
Hansen, J. and Nazarenko, L.: Soot climate forcing via snow and ice albedos, Proc. Natl. Acad. Sci., 101, 423–428, 2004.
Hansen, J., Sato, M., Ruedy, R., Nazarenko, L., Lacis, A., Schmidt, G. A., Russell, G., Aleinov,
10
I., Bauer, M., Bauer, S., Bell, N., Cairns, B., Canuto, V., Chandler, M., Cheng, Y., Del Genio, A., Faluvegi, G., Fleming, E., Friend, A., Hall, T., Jackman, C., Kelley, M., Kiang, N., Koch, D., Lean, J., Lerner, J., Lo, K., Menon, S., Miller, R., Minnis, P., Novakov, T., Oinas, V., Perlwitz, J., Perlwitz, J., Rind, D., Romanou, A., Shindell, D., Stone, P., Sun, S., Tausnev, N., Thresher, D., Wielicki, B., Wong, T., Yao, M., and Zhang, S.: Efficiency of climate forcing, J. Geophys.
15
Res., 110, D18104, doi:10.1029/2005JD005776, 2005.
Hara, K., Yamagata, S., Yamanocuhi, T., Sato, K., Herber, A., Iwasaka, Y., Nagatani, M., and Nakada, H.: Mixing states of individual aerosol particles in spring Arctic troposphere dur-ing ASTAR 2000 campaign, J. Geophys. Res., 108(D7), 4209, doi:10.1029/2002JD002513, 2003.
20
Hara, K., Osada, K., Kido, M., Hayashi, M., Matsunaga, K., Iwasaka, Y., Yamanouchi, T., Hashida, G., and Fukatsu, T.: Chemistry of sea-salt particles and inorganic halogen species in the Antarctic regions: Compositional differences between coastal and inland stations, J. Geophys. Res., 109, D20208, doi:10.1029/2004JD004713, 2004.
Hara, K., Iwasaka, Y., Wada, M., Ihara, T., Shiba, H., Osada, K., and Yamanouchi, T.: Aerosol
25
constituents and their spatial distribution in the free troposphere of coastal Antarctic regions, J. Geophys. Res., 111, D15216, doi:10.1029/2005JD006591, 2006.
Heintzenberg, H.: Tropospheric transport of trace substances in the southern hemisphere, Tellus, 42B, 355–363, 1990.
Hirasawa, N., Nakamura, H.- and Yamanouchi, T.: Abrupt changes in meteorological conditions
30
observed at an inland Antarctic station in association with wintertime blocking, Geophys. Res. Lett., 27, 1911–1914, 2000.