HAL Id: insu-01018956
https://hal-insu.archives-ouvertes.fr/insu-01018956
Submitted on 7 Jul 2014HAL is a multi-disciplinary open access
archive for the deposit and dissemination of sci-entific research documents, whether they are pub-lished or not. The documents may come from teaching and research institutions in France or abroad, or from public or private research centers.
L’archive ouverte pluridisciplinaire HAL, est destinée au dépôt et à la diffusion de documents scientifiques de niveau recherche, publiés ou non, émanant des établissements d’enseignement et de recherche français ou étrangers, des laboratoires publics ou privés.
Time scales of regional circulation of saline fluids in
continental aquifers (Armorican massif, Western France)
Antoine Armandine Les Landes, Luc Aquilina, Philippe Davy, Virginie
Vergnaud, Christian Le Carlier de Veslud
To cite this version:
Antoine Armandine Les Landes, Luc Aquilina, Philippe Davy, Virginie Vergnaud, Christian Le Carlier de Veslud. Time scales of regional circulation of saline fluids in continental aquifers (Armorican massif, Western France). Hydrology and Earth System Sciences Discussions, European Geosciences Union, 2014, 11 (6), pp.6599-6635. �10.5194/hessd-11-6599-2014�. �insu-01018956�
HESSD
11, 6599–6635, 2014 Time scales of regional circulation of saline fluids A. Armandine Les Landes et al. Title Page Abstract Introduction Conclusions References Tables Figures ◭ ◮ ◭ ◮ Back CloseFull Screen / Esc
Printer-friendly Version Interactive Discussion Discussion P a per | Discus sion P a per | Discussion P a per | Discussion P a per |
Hydrol. Earth Syst. Sci. Discuss., 11, 6599–6635, 2014 www.hydrol-earth-syst-sci-discuss.net/11/6599/2014/ doi:10.5194/hessd-11-6599-2014
© Author(s) 2014. CC Attribution 3.0 License.
This discussion paper is/has been under review for the journal Hydrology and Earth System Sciences (HESS). Please refer to the corresponding final paper in HESS if available.
Time scales of regional circulation of
saline fluids in continental aquifers
(Armorican massif, Western France)
A. Armandine Les Landes, L. Aquilina, P. Davy, V. Vergnaud, and C. le Carlier
Geosciences Rennes (CNRS – UMR 6118), University of Rennes 1, Bâtiment 14B, Campus Beaulieu, 263 Avenue du Général Leclerc, 35042 Rennes, France
Received: 20 April 2014 – Accepted: 13 June 2014 – Published: 23 June 2014 Correspondence to: A. Armandine Les Landes
(antoine.armandineleslandes@univ-rennes1.fr)
HESSD
11, 6599–6635, 2014 Time scales of regional circulation of saline fluids A. Armandine Les Landes et al. Title Page Abstract Introduction Conclusions References Tables Figures ◭ ◮ ◭ ◮ Back CloseFull Screen / Esc
Printer-friendly Version Interactive Discussion Discussion P a per | Discus sion P a per | Discussion P a per | Discussion P a per | Abstract
In recent decades, saline fluids have been sampled worldwide at great depths in con-tinental basements. Although some of them have been attributed to marine trans-gressions the mechanisms allowing their circulation is not understood. In this paper, we describe the horizontal and vertical distribution of moderately saline fluids (60 to
5
1400 mg L−1) sampled at depths ranging from 41 to 200 m in aquifers at the regional scale of the Armorican Massif (northwestern France). The horizontal and vertical dis-tributions of high chloride concentrations are in good agreement with both the altitudi-nal and vertical limits and succession of the three major transgressions between the Mio-Pliocene and Pleistocene ages. The mean chloride concentration for each
trans-10
gression area is exponentially related to the time spanned until present. It defines the potential laws of leaching of marine waters by fresh meteoric waters. The results of the Armorican aquifers provide the first observed constraints for the time scales of sea-water circulation in the continental basement and the subsequent leaching by fresh meteoric waters. The general trend of increasing chloride concentration with depth and
15
the time frame for the flushing process provide useful information to develop conceptual models of the paleo-functionning of Armorican aquifers.
1 Introduction
In recent decades, saline fluids have been sampled at great depths (0.5–5 km) in con-tinental basements (Bucher and Stober, 2010; Frape et al., 2003). In several places,
20
these fluids have been considered as old seawater introduced in aquifers during ma-rine transgressions (Aquilina and Dreuzy, 2011; Beaucaire et al., 1999; Bottomley et al., 1994, 1999; Douglas et al., 2000; Greene et al., 2008; Louvat et al., 1999; Négrel and Casanova, 2005). Two alternative origins related either to glacial recharge of brines due to cryogenic mechanisms (Starinsky and Katz, 2003), or to anthropogenic sources
25
HESSD
11, 6599–6635, 2014 Time scales of regional circulation of saline fluids A. Armandine Les Landes et al. Title Page Abstract Introduction Conclusions References Tables Figures ◭ ◮ ◭ ◮ Back CloseFull Screen / Esc
Printer-friendly Version Interactive Discussion Discussion P a per | Discus sion P a per | Discussion P a per | Discussion P a per |
also been proposed. These three hypotheses have led to extremely different estimates of the saline fluid residence time (Devonian or Pleistocene for the Canadian brines, for example) and thus of the paleohydrogeology of the continental aquifers. Although thorough investigations have been carried out in several places, the origin and fate of the salinity are still issues. We have almost no field observations identifying the
po-5
tential mechanisms leading to marine fluid introduction and conservation in hard rock aquifers, as well as the influence of glacial recharge at various depths in these aquifers remain. Furthermore, the time-scales of these mechanisms are unknown.
In this study, we investigated the effects of marine transgressions in the spatial (both horizontal and vertical) distribution of chloride concentrations at a regional scale. Since
10
the transgression characteristics differ from one event to another, we expect to find higher concentrations in the areas flooded by the later. The decrease of chloride con-centrations with time potentially provides constraints for fluid circulation time-scales in the basement.
The study focuses on the Armorican basement (western France), where several
au-15
thors have reported evidence of saline fluids (Ayraud et al., 2008; Pauwels et al., 2010). Three main transgressions were recorded during Mio-Pliocene to Pleistocene times, the latest being the highest. This is a particularly favorable context since a large part of the area flooded by the oldest and highest transgression remains unaffected by later transgression events.
20
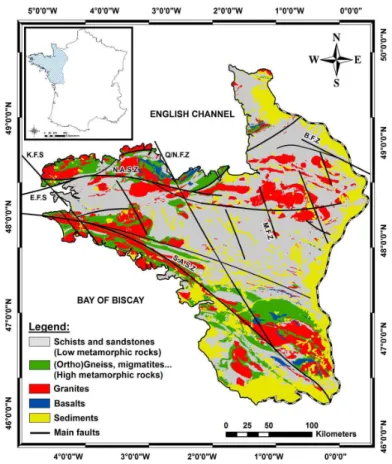
2 Geological background
The Armorican basement extends over an area of 68 500 km2in the northwestern part of France. The Armorican massif is a crystalline basement localized between the En-glish Channel and the Bay of Biscay. The northern part corresponds to the Cado-mian orogenic belt (Chantraine et al., 2001). The central and southern zones belong
25
to the European Variscan belt (Le Corre et al., 1991). The Armorican massif is a base-ment made of Upper Proterozoic to Paleozoic formations mainly composed of low and
HESSD
11, 6599–6635, 2014 Time scales of regional circulation of saline fluids A. Armandine Les Landes et al. Title Page Abstract Introduction Conclusions References Tables Figures ◭ ◮ ◭ ◮ Back CloseFull Screen / Esc
Printer-friendly Version Interactive Discussion Discussion P a per | Discus sion P a per | Discussion P a per | Discussion P a per |
high metamorphic rocks (schists, sandstones and gneisses. . . ), plutonic (granite) and volcanic (basalt) rocks deformed during the two orogenies (Cadomian and Variscan) (Fig. 1). These orogenies have initially developed the main tectonic structures of the Ar-morican massif: the North and the South ArAr-morican Shear Zones (NASZ and SASZ, re-spectively), and the Quessoy/Nort-sur-Erdre Fault (Bonnet et al., 2000) (Fig. 1). These
5
structures have been reactivated during Mesozoic and Cenozoic periods. Tertiary and quaternary geodynamic evolution of the Armorican massif are related to the collision between Europe and Africa (Brault, 2002; Gros and Limasset, 1984; Ziegler, 1990). This evolution mainly consists in three major steps (Thomas, 1999): (1) from the end of Cretaceous to the upper Eocene, the Armorican massif is subjected to a lithospheric
10
buckling due to the Pyrenean compression. (2) From the upper Eocene to Oligocene the buckling decreases and the geodynamic evolution is driven by a generalized exten-sion. (3) From the Mio-Pliocene to present days, the Armorican massif is uplifted due to a lithospheric buckling in relation with the Alpine compression. This compression is still active as observed through the Armorican massif seismic activity (Lenôtre et al.,
15
1999; Nicolas et al., 1990).
Local topography is controlled by rock lithologies and, on a larger scale, by tectonic faults (Northern and southern shear zones (Dugué, 2007; Gumiaux et al., 2004)). It is relatively moderate with three domains of higher elevation above 200 m and a maxi-mum elevation of 416 m in the east (Fig. 2).
20
3 Hydrogeological setting
The main groundwater flow in crystalline rock aquifers is considered to be localized in superficial formations resulting mainly from rock weathering, and below in fracture and major geologic discontinuities networks (Larsson, 1987; Stober and Bucher, 2007; Wyns et al., 2004). The compartmentalized structure includes various reservoir scales
25
and characteristic physical parameters (permeability, porosity. . . ) varying over several orders of magnitude (Clauser, 1992). At the scale of the Armorican massif a weathered
HESSD
11, 6599–6635, 2014 Time scales of regional circulation of saline fluids A. Armandine Les Landes et al. Title Page Abstract Introduction Conclusions References Tables Figures ◭ ◮ ◭ ◮ Back CloseFull Screen / Esc
Printer-friendly Version Interactive Discussion Discussion P a per | Discus sion P a per | Discussion P a per | Discussion P a per |
layer 20 to 30 m thick is present in many places, and likely ubiquitously (Brault, 2002; Dewandel et al., 2006). Roques (2013) has studied the influence of fault zones for sites characterized by high groundwater yields at the scale of the Armorican massif. At this scale, groundwater resources in the shallower part (< 20 m) are widespread but
lim-ited in term of productivity. Conversely, high groundwater productivities are associated
5
to fault zones below the weathered zone. Indeed, groundwater resources at signifi-cant depth have been found in the Armorican bedrock (Le Borgne et al., 2006; Leray et al., 2013; Roques et al., 2014) and it can be considered that the fractured system constitutes a water reservoir in the continental basement. Free groundwater circula-tion in crystalline environments has been reported from several studies (Banks et al.,
10
1996; Larsson, 1987). Several studies have shown that basement is generally charac-terized by an interconnected fracture system at several km depth (Aquilina and Dreuzy, 2011; Edmunds and Savage, 1991; Stober et al., 2002). Hydrodynamic properties of crystalline rock aquifers of the Armorican basement have been intensively investigated in several research sites (Ploemeur and St-Brice-en-Cogles sites, Fig. 2) (Le Borgne
15
et al., 2004, 2006; Dorn et al., 2012; Leray et al., 2013; Roques, 2013; Roques et al., 2014; Touchard, 1999) (Fig. 2). Moreover, previous studies in the Armorican basement have identified a compartmentalization of these crystalline rock aquifers from hydro-logical, geochemical, geological and geophysical data (Ayraud et al., 2008; Roques, 2013; Roques et al., 2014), and from regional-scale numerical modeling (Goderniaux
20
et al., 2013). Geochemical studies also showed specific chemical compositions of the water in the deep fractured aquifer, potentially including saline groundwaters (Aquilina et al., 2013; Ayraud et al., 2008; Pauwels et al., 2013).
4 Chloride database
The quantity supplied and the quality of the main groundwater resources in the
Ar-25
morican massif are monitored through a public well network (ADES: “banque nationale d’Accès aux Données sur les Eaux Souterraines”, National database for groundwater
HESSD
11, 6599–6635, 2014 Time scales of regional circulation of saline fluids A. Armandine Les Landes et al. Title Page Abstract Introduction Conclusions References Tables Figures ◭ ◮ ◭ ◮ Back CloseFull Screen / Esc
Printer-friendly Version Interactive Discussion Discussion P a per | Discus sion P a per | Discussion P a per | Discussion P a per |
resources, http://www.ades.eaufrance.fr/). For most of these wells hydrogeological in-formations (geographical location, altitude, depth, drilling log, borehole parameters, water inflow points, etc. . . ) are available through a second public database of drillings (BSS: “Base de données du Sous-Sol”, http://infoterre.brgm.fr/). The precise location of water inflows is not described for each well, and it has been considered that the
5
water inflow corresponds to the base of the well. This assumption is valid taking into account the drilling goal which is to stop the well drilling when a sufficient water inflow is found.
The network of wells investigated covers the whole Armorican basement and in-cludes more than 1800 drillings with an average depth of approximately 40 m. Chemical
10
records, such as chloride or nitrate concentrations, are available for each drilling. We first preprocessed the database of 1874 chloride measurements and removed wells that are potentially not representative of natural chloride concentrations. We removed wells close to a potential anthropic pollution source (industrial estate, garbage dump, mill pond. . . ), and wells with a large variability through time large (standard deviation
15
of chloride concentration higher than 30 %). We also did not consider the wells at a dis-tance less than one kilometer from the current coastline, whose concentration may be directly influenced by current saltwater intrusion. 716 of the 1874 wells have been excluded from the database, i.e. 38 % of the total. The vertical distribution of the chlo-ride concentrations for the remaining values was analyzed by intervals of 10 m from
20
an altitude of 350 m a.s.l. to −125 m. The average chloride concentration and the 90th percentile were calculated for each 10 m interval.
5 Marine transgression characteristics
Chlorides of marine origin that are not brought by rainfall (i.e. concentrations higher than 40 mg L−1) are likely related to marine transgressions that flooded the Armorican
25
massif from times to times. The likely scenario is that a fairly large amount of chlo-rides is injected during each transgression in submerged regions, and that the salt
HESSD
11, 6599–6635, 2014 Time scales of regional circulation of saline fluids A. Armandine Les Landes et al. Title Page Abstract Introduction Conclusions References Tables Figures ◭ ◮ ◭ ◮ Back CloseFull Screen / Esc
Printer-friendly Version Interactive Discussion Discussion P a per | Discus sion P a per | Discussion P a per | Discussion P a per |
concentration decreases from the end of the transgression event due to dilution or leaching by meteoric waters. If the leaching/dilution is efficient enough, for instance if the time lag between two successive transgressions is larger than the leaching time, the system is fully reset by the last event (i.e. the amount of chloride injected during the last event is much larger than the residual of formers). The objective of this part is
5
to characterize the last transgressions that have flooded the Armorican massif.
According to stratigraphic record studies in the Armorican Massif and, to the eustatic sea-level fluctuations (Hardenbol et al., 1998), three main transgressions can be iden-tified since the Mio-Pliocene. The oldest of Messinian age has been ideniden-tified in sev-eral places (Néraudeau et al., 2003; Van Vliet-Lanoe et al., 1998), and dated between
10
6 and 4.6 Myr by several methods (ESR: Electron Spin Resonance Spectroscopy on quartz,87Sr /86Sr on shells and bones in “Redonian” shelly sands or “Faluns” (Mercier et al., 2000; Néraudeau et al., 2002). These sediments would attest of the maximum transgression of the late Neogene in northwestern France (Néraudeau et al., 2010). This transgression corresponds to a high sea level of +90 m according to
Harden-15
bol et al. (1998). The second transgression is mostly characterized by the deposition of clays, which contains few bioclastic constituents (Morzadec-Kerfourn, 1997, 1977). The so-called Redon clays formation are dated as Pliocene: Piacenzian (Reuverian, ∼ 2.7 ± 0.3 Myr) from a pollen analysis (Morzadec-Kerfourn, 1982, 1997). The corre-sponding sea level is around +60 m according to the chart (Hardenbol et al., 1998).
20
The last known transgression in the area is characterized by clay deposits that cover the Redon clays (Morzadec-Kerfourn, 1997). According to pollen analysis of the Lan-rinou clay at Landerneau (Morzadec-Kerfourn, 1982, 1997), these sediments can be correlated with the lower Pleistocene around 1.6–2 Myr (Gelasian/Calabrian). The cor-responding event coincide with the high sea-level stand of +30 m (Hardenbol et al.,
25
1998).
Thus, at least three marine transgressions, with three different paleocoastlines, must be considered for the Armorican massif: the oldest, which is also the highest, is Mio-Pliocene: Messinian (∼ 5.3 ± 0.8 Myr) with sea level +90 m a.s.l., the second is
HESSD
11, 6599–6635, 2014 Time scales of regional circulation of saline fluids A. Armandine Les Landes et al. Title Page Abstract Introduction Conclusions References Tables Figures ◭ ◮ ◭ ◮ Back CloseFull Screen / Esc
Printer-friendly Version Interactive Discussion Discussion P a per | Discus sion P a per | Discussion P a per | Discussion P a per |
Pliocene: Reuverian (∼ 2.7 ± 0.3 Myr) with sea level +60 m a.s.l.; and the most recent is Pleistocene: Gelasian/Calabrian (∼ 1.8 ± 0.2 Myr) with sea level +30 m a.s.l.
Using local studies on the large-scale relief development and the paleotopographic evolution of the Armorican basement (Bonnet et al., 1998, 2000; Brault et al., 2004; Guillocheau et al., 2003; Lague et al., 2000; Lenôtre et al., 1999; Morzadec-Kerfourn,
5
1997; Van Vliet-Lanoe et al., 1998), a paleotopography was reconstructed for the whole area.
Globally, the topography evolution is the result of tectonic movements, climate and eustatic variations since the Mio-Pliocene. The modern topography is characterized by of incised valleys with an incision average depth of 60–100 m and significant
topo-10
graphic variations. The onset of the current incised and dense hydrological network is probably not older than 1 Ma (Bonnet et al., 1998, 2000; Lefebvre et al., 1994). This topography contrasts with the smooth planation surface of the Mio-Pliocene (Brault et al., 2004). The development of the Pleistocene topography of the Armorican massif is explained by vertical movements due to the N160 compression generated by the
15
Alpine collision (Bonnet et al., 1998; Müller et al., 1992; Nicolas et al., 1990). This differential tectonic uplift has been estimated from geomorphological studies (Bonnet et al., 1998, 2000; Lague et al., 2000). Incision is measured using a digital elevation model analysis. A distributed field of incised quantities is produced for each individual drainage basin (Jost, 2005). Moreover, relief induced by fluvial incision partly reflects
20
continental movements and can be used to estimate uplift. Indeed, considering that the drainage networks adjust to sea level, the induced incision has the same magnitude in different basins. Thus the difference of incision is used to estimate the relative amounts of differential uplift between basins. The estimation of differential uplift for each basin has been grouped by zone due to the regional organization. A differential tectonic
up-25
lift has been observed for the western part compared to the eastern part, along the Quessoy/Nort-sur-Erdre fault (Brault et al., 2004; Jost, 2005).
From these previous work, to reconstruct the paleotopography of the whole area, we first used a digital elevation model (DEM, 100 m resolution) given by the Institut
HESSD
11, 6599–6635, 2014 Time scales of regional circulation of saline fluids A. Armandine Les Landes et al. Title Page Abstract Introduction Conclusions References Tables Figures ◭ ◮ ◭ ◮ Back CloseFull Screen / Esc
Printer-friendly Version Interactive Discussion Discussion P a per | Discus sion P a per | Discussion P a per | Discussion P a per |
Géographique National (IGN) to generate several surfaces providing an estimation of the Pleistocene topography prior to erosion and valley incision (Bonnet et al., 1998, 2000). Within a rectangular 20 km large sliding window, either the highest point or the Q90 quantile was recorded. This process allows for the creation of a surface above the present-time topography connecting the highest points and filling the valleys. The
5
use of the Q90 quantile provides a smoother result than the maximum which may be too influenced by isolated peaks. The generated surface does not include the unknown amount of erosion of peaks and crests and thus should be considered as a minimum. Then, the uplift (Jost, 2005) was subtracted from the preprocessed topography. Last the paleocoastlines were reconstructed for the three transgressions by comparing the
10
reconstructed topography with the expected sea level derived from Hardenbol et al., (1998). The Messinian and Reuverian transgressions had covered a large part of the Armorican massif, except the highest elevations; the last Gelasian/Calabrian transgres-sion had flooded areas along the current coastline, and the lowest inland parts (Fig. 5).
6 Results
15
6.1 Origin of chlorides
Within the framework of this study, 12 sites (monitoring sites in Fig. 2) presenting mod-erately saline fluids were subjected to further geochemical and isotopic analysis (only Br concentrations are presented here). Salinities ranging from 60 to 1400 mg L−1were recovered at depths ranging from 41 m to 200 m, except for the Cinergy drilling project
20
where water was collected at a depth below 450 m in fractured schist, with a chloride concentration of 1240 mg L−1.
The chloride to bromide relationships is presented in Fig. 4 for the 12 sites inves-tigated geochemically. The chloride concentration is linearly correlated with bromide along the rainfall-seawater mixing line (Fig. 4). This strongly suggests that the saline
25
HESSD
11, 6599–6635, 2014 Time scales of regional circulation of saline fluids A. Armandine Les Landes et al. Title Page Abstract Introduction Conclusions References Tables Figures ◭ ◮ ◭ ◮ Back CloseFull Screen / Esc
Printer-friendly Version Interactive Discussion Discussion P a per | Discus sion P a per | Discussion P a per | Discussion P a per |
diluted by meteoric waters (Bottomley et al., 1994; Casanova et al., 2001; Frape et al., 1984; Fritz, 1997; Gascoyne and Kamineni, 1994; Nordstrom et al., 1989).
Chloride has three potential sources: (1) (paleo)seawater, (2) rainfall potentially con-centrated by evapotranspiration processes, and (3) anthropogenic sources (agricultural fertilizers such as KCl, pig slurry and cattle manure). If we exclude a 1 km band across
5
the coastline, the meteoric waters in Brittany have a maximum mean chloride con-centration of 10–18 mg L−1 with a relatively low variation range (Ayraud et al., 2008; Martin et al., 2004). Evapotranspiration in Brittany represents about 50–60 % of the total precipitation, and cannot provide chloride concentrations in recharge water higher than 40 mg L−1 (Ayraud et al., 2008). Agricultural pollutions may increase the
concen-10
trations to 50 mg L−1 in the most intensively farmed areas (Martin et al., 2004). Thus
these two processes cannot explain the very high concentrations observed. Further-more a negative correlation between nitrate and altitude has been observed. Above 100 m, the nitrate concentration is almost constant and below 100 m the nitrate con-centration decreases with depth. This negative correlation between nitrate and altitude
15
clearly as well as gas groundwater dating (Ayraud et al., 2008) indicates that below this depth the anthropogenic influence decreases. These results underline that the anthro-pogenic sources are more related to shallow aquifers, contrary to deep saline fluids.
Thus, chloride concentrations are clearly out of the potential range of modern waters even including anthropogenic sources. The correlation between bromide and chloride
20
(Fig. 4) supports a marine origin for these groundwater (Bottomley et al., 1994; Carpen-ter, 1978; Freeman, 2007). The simplest mechanism which explains the high chloride concentration observed is a marine component related to the last transgressions.
6.2 Spatial and vertical distributions of chloride
The chloride distribution is presented in Fig. 5 shows the altitudinal limits of the
25
last three major transgressions between the Mio-Pliocene and the Pleistocene (Messinian ∼ 5.3 Myr, Piacenzian ∼ 2.7 Myr and Gelasian-Calabrian ∼ 1.8 Myr). These limits correspond to 90, 60 and 30 m, respectively. This map shows relatively high
HESSD
11, 6599–6635, 2014 Time scales of regional circulation of saline fluids A. Armandine Les Landes et al. Title Page Abstract Introduction Conclusions References Tables Figures ◭ ◮ ◭ ◮ Back CloseFull Screen / Esc
Printer-friendly Version Interactive Discussion Discussion P a per | Discus sion P a per | Discussion P a per | Discussion P a per |
chloride concentrations (60 to 1400 mg L−1) around the current coastline and in a few large domains whose current topography is clearly above sea level. Only three zones present chloride concentrations below 40 mg L−1. These zones correspond to the three
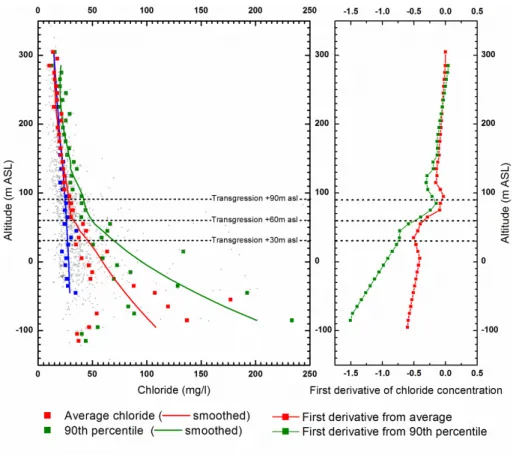
domains of higher elevation above 200 m and to the area above the higher Messinian paleocoastline altitude of +90 m a.s.l. Figure 6 shows the vertical distribution of
chlo-5
ride concentrations according to the altitude of the base of the well. Above 100 m, the chloride concentration is almost constant, increasing only slightly with depth, the values ranging from 10 to 40 mg L−1. Below 100 m, some drastic changes in the chloride-depth trends are observed. In the first derivative curves, the chloride increase leads to slope breaks around and below 100 m a.s.l. The main one is apparent at approximately 70 m,
10
with chloride concentrations up to 200 mg L−1observed below this depth. The chloride concentrations below 70 m increase strongly with depth (approximately 0.5 mg L−1m−1
for the average and more than 1 mg L−1m−1 for the 90th percentile). This trend con-trasts with the almost constant chloride concentrations in the areas not affected by past marine transgressions.
15
The distribution of chloride concentrations is in good agreement with the paleocoast-lines (Fig. 5). The increase of chloride concentration with depth (Fig. 6) also supports this correlation. The vertical distribution of chloride concentrations likely indicates that, during each of the last transgressions, seawater was introduced by gravity-driven flow at great depth in the basement, and has only partially been flushed by meteoric waters.
20
6.3 The chloride releasing rate
The three paleocoastlines of past marine transgressions can be used to define four spatially distinct domains in the Armorican massif: three of them correspond to places where either the Messinian, Reuverian and Gelasian/Calabrian transgressions is the
last marine event that covered them; the fourth is the domain that was not flooded
25
Fig. 5. The average chloride concentration for each area has been calculated and attributed to the age of the latest marine transgression. Figure 7 shows that the average
HESSD
11, 6599–6635, 2014 Time scales of regional circulation of saline fluids A. Armandine Les Landes et al. Title Page Abstract Introduction Conclusions References Tables Figures ◭ ◮ ◭ ◮ Back CloseFull Screen / Esc
Printer-friendly Version Interactive Discussion Discussion P a per | Discus sion P a per | Discussion P a per | Discussion P a per |
chloride concentration for each area is inversely related to the time elapsed since the last corresponding marine transgression.
This relationship shown in Fig. 7 can be fitted by a simple exponential function of the general form:
c = cinexp −
te
τ + co, (1)
5
wherec is the current chloride concentration, te is the age of the last transgression
event,τ a characteristic time scale, co a background concentration, and cin an
addi-tional concentration injected at the timet. Equation (1) is the solution of the differential equation: 10 dc dt = − (c − co) τ + cinδ(te), (2)
δ(t), the delta function, simulates quasi-instantaneous injection of chlorides at
trans-gression times. The background chloride concentrationco can be measured in places
not influenced by past marine transgression; it is estimated to 21.5 ± 0.3 mg L−1. The
15
regression fit leads to a time constantτ of 2.3 ± 0.1Myr, and an injected concentration
of 100 ± 14 mg L−1. This residence-time order of magnitude is consistent with the
res-idence time of several million years suggested by (Thury et al., 1994) for deep water as well as several studies supporting long residence times required by “fossil” seawa-ter (Stober and Bucher, 1999). It can be noticed that these studies of fluids containing
20
a paleoseawater end-member have chloride concentrations with an order of magnitude similar to those presented here.
HESSD
11, 6599–6635, 2014 Time scales of regional circulation of saline fluids A. Armandine Les Landes et al. Title Page Abstract Introduction Conclusions References Tables Figures ◭ ◮ ◭ ◮ Back CloseFull Screen / Esc
Printer-friendly Version Interactive Discussion Discussion P a per | Discus sion P a per | Discussion P a per | Discussion P a per | 7 Discussion
7.1 General trend of increasing salinities with depth
The main results of this paper present clear evidences on the origin and the age of saline fluids in the continental crust at the scale of the Armorican massif. We report the vertical distribution of chloride concentration which presents a concentration increase
5
with depth at the Armorican massif scale. Such a trend has already been observed in several places throughout the world in continental crust.
Highly saline brines have been found in various geological environments in the Cana-dian Shield (Frape et al., 1984; Fritz and Frape, 1982; Gascoyne and Kamineni, 1994), in the crystalline basement of Europe (Black Forest in Germany, Soultz-sous-forêt in
10
France) (Aquilina et al., 1997; Pauwels et al., 1993; Stober and Bucher, 1999), in the Fennoscandian shield (Fritz, 1997; Nordstrom et al., 1989) and in the England Carn-menellis Granite (Edmunds et al., 1985). Saline fluids sampled in these sites report a wide range of chloride concentrations. At the surface, chloride concentration ranges from around ten to hundred mg L−1, at much greater depth around 500 m concentration
15
values are between one hundred to thousands mg L−1 and below 1 km depth concen-trations range from hundreds to tens of thousands mg L−1.
For all these sites chloride concentration have been analyzed by intervals of depth where the average chloride concentration is calculated in order to define the concen-tration gradient until approximately 1 km of depth (Fig. 8). The Armorican data are also
20
plotted on this graph (Fig. 8). All the studies show a general increase of salinity with depth. In the first three hundred meters a high gradient of salinity is observed and between 350 and about 700 m, another gradient is observed. Below this depth, a stabi-lization seems to be observed although there are relatively few data (Fig. 8). However the main difference between all studies relies in chloride concentrations of
groundwa-25
ter samples at shallow depths. In fact, chloride concentration can vary by one order of magnitude, with concentrations around ten to hundred mg L−1, as for the Armorican basement and the Canadian Shields, respectively (Fig. 8).
HESSD
11, 6599–6635, 2014 Time scales of regional circulation of saline fluids A. Armandine Les Landes et al. Title Page Abstract Introduction Conclusions References Tables Figures ◭ ◮ ◭ ◮ Back CloseFull Screen / Esc
Printer-friendly Version Interactive Discussion Discussion P a per | Discus sion P a per | Discussion P a per | Discussion P a per |
All previous studies have been realized in the framework of nuclear repository, geothermal or scientific programs with the aim to investigated the deep continental crust at depth ranging from several hundred meters to several kilometers. In this study we made a synthesis of a large number of wells in a much shallower part of the crystalline basement (41 to 200 m). Despite the different purposes, we report
simi-5
larities, specifically the distribution of chloride with depth which suggests common hy-drogeological mechanisms. The salinity gradient from surface to greater depth and the smoothing of the evolution below a certain depth suggest two hydrodynamic be-haviors. Such information can be useful to develop conceptual models of basement aquifers functioning. In addition, in this study we provide a time frame constraint of
10
these processes in order to contribute to a better understanding.
7.2 Chloride releasing rate
Figure 7 shows that the relationship between concentration and transgression age can be fitted by a decreasing exponential function, whose parameters give three different characteristics: the background concentration co which can be independently
evalu-15
ated in places that have not been flooded by marine transgressions,cin the additional
concentration injected in the system during a transgression, andτ the “dilution” time
scale. Note that even if the choice of the exponential function is rather arbitrary consid-ering the small number of constraints, bothcin, the curve extrapolation for an event of
age 0, andτ, the time to achieve a significant decrease, are rather well determined.
20
According to the fitting values, the average chloride concentration likely increased by about 100 mg L−1 after each transgression. This is a rather low value compared to the seawater concentration of ∼ 19 g L−1, which indicates that the original seawater has replaced only part of the freshwater initially present. Note that this value corresponds to the increase of the average chloride concentration in the sampling zone that is mostly
25
below 100 m of the current topography. If there is a systematic increase of chloride concentration with depth, as observed in the upper section, the average will increase as well. A deeper sampling could then give higher cin values. The fit also indicates
HESSD
11, 6599–6635, 2014 Time scales of regional circulation of saline fluids A. Armandine Les Landes et al. Title Page Abstract Introduction Conclusions References Tables Figures ◭ ◮ ◭ ◮ Back CloseFull Screen / Esc
Printer-friendly Version Interactive Discussion Discussion P a per | Discus sion P a per | Discussion P a per | Discussion P a per |
that chloride flushing from the aquifers is a process requiring approximately 2.3 Myr to return to initial conditions. Despite uncertainties on paleocoastlines and the exponential function arbitrarily chosen, the essential point is the clear evidence of past marine transgression during the last millions years and thus leaching processes being active during a similar duration. We use these characteristic time of hydrodynamic processes
5
to constraint the conceptualization of basement aquifers functioning in the two next sections.
7.3 Conceptualization of Armorican aquifers paleohydrogeology
The Armorican massif presents clear evidences of a marine origin of the saline com-ponent in the fluids at the massif scale. The general trend of increasing chloride
con-10
centration with depth supports the seawater introduction by gravity-driven flow at depth in the basement during past marine transgressions followed by a flushing phase with freshwater. Moreover, the chloride releasing rate provides a time frame for the flushing process which has been estimated in the order (of magnitude) of a few million years. Such information can be used to develop conceptual models of the paleo-functioning of
15
Armorican aquifers. The objective of this section is thus to propose conceptual models that may account for the chloride increase with depth on one hand and for the chloride concentration increase fit with time presented above.
The crystalline basement of the Armorican massif presents aquifers with a high transmissivity associated to fault zones (Roques et al., 2014). Considering the
cur-20
rent topography of the Armorican massif including three domains of higher elevation above 200 m, the groundwater flow system is driven gravitationally which leads to both local and regional circulation loops (Toth, 1963). Considering the modern situation and constraints provided by the distribution of chloride discussed previously, two main pos-sibilities may explain the distribution of saline fluids in Armorican aquifers.
HESSD
11, 6599–6635, 2014 Time scales of regional circulation of saline fluids A. Armandine Les Landes et al. Title Page Abstract Introduction Conclusions References Tables Figures ◭ ◮ ◭ ◮ Back CloseFull Screen / Esc
Printer-friendly Version Interactive Discussion Discussion P a per | Discus sion P a per | Discussion P a per | Discussion P a per |
7.3.1 First conceptual model: perfectly mixed aquifer
First, the crystalline rock aquifers are considered as a perfectly mixed reactor where the time constant of millions of years is also the residence time of chlorides in the sys-tem. The chloride contained in the system is slowly flushed out by freshwater under the influence of topography-driven groundwater flow (Toth, 1963). This model requires that
5
chlorides are located in a compartment of the groundwater system whose recharge is far lower than the current recharge rate (around 200 mm yr−1) at the top boundary
of the system (see Appendix A). This does not necessarily means that this conceptual model is not consistent with data. On the contrary, it seems consistent with the flow par-titioning between local and regional flow systems initially presented (Toth, 1963) and
10
precised more recently (Cardenas, 2007; Goderniaux et al., 2013). The characteristics of the partitioning between shallow aquifers and deep aquifers have been studied using the topography of Brittany and assuming a constant permeability with depth (Goder-niaux et al., 2013). This study shows four interesting results about the partitioning be-tween shallow (short circulations related to first-order basins) and deep (more regional
15
circulations) aquifers: (i) the “deep” compartment can be quite shallow depending on local topography characteristics; (ii) the residence time of particles is well fitted by an exponential function, which means that the concentration flushing should behave sim-ilarly; (iii) the partitioning depends on the total recharge; (iv) the recharge flow in the deep aquifer is 2–5 times smaller than the total recharge. These recharge values are
20
not small enough to explain the 2.3 Myr residence time observed for chlorides, which could mean either that the first model is inconsistent with data, or that the assump-tion of Goderniaux et al. (2013) is unrealistic. A permeability decrease with depth, may observed in the continental crust with a likely factor of 100 within the first kilometer (Ingebritsen and Manning, 1999; Saar and Manga, 2004; Stober and Bucher, 2007).
25
Such decrease could account for a much smaller recharge of the deep groundwater system and thereby a flushing process less efficient. Through modeling is ongoing to further test this hypothesis.
HESSD
11, 6599–6635, 2014 Time scales of regional circulation of saline fluids A. Armandine Les Landes et al. Title Page Abstract Introduction Conclusions References Tables Figures ◭ ◮ ◭ ◮ Back CloseFull Screen / Esc
Printer-friendly Version Interactive Discussion Discussion P a per | Discus sion P a per | Discussion P a per | Discussion P a per |
7.3.2 Second conceptual model: deep reservoir
In the second case, the presumption is that chlorides could be localized in a deep reservoir i.e. in the deeper part of the aquifer. Then chlorides would be leached out from the aquifer system after diffusion from the deep reservoir towards the active part of the crystalline rock aquifers where leaching is efficient. Calculations for this
con-5
ceptual model (see Appendix 8), lead to a “salt” layer thickness of 40 m that does not seem unrealistic as regards the chloride evolution with depth observed. However this conceptual model would predict very high concentrations at depth that are not yet ob-served in the Armorican basement in the absence of very deep drillings. But, this could be in agreement with highly saline fluids sampled in various geological environments
10
at great depths worldwide (Fig. 8). As in the crystalline basement of the Black Forest where Stober and Bucher (1999) suggest that the deep salt water discharges is related to the upwelling of deep water which may bring up chloride from a deep reservoir. How-ever, it can certainly be affirmed that the salt contained in the deepest part is not solid due to the chloride to bromide relationships which excludes this possibility.
15
The next step of this study will be to test these two functioning hypothesis with nu-merical modeling in order to provide more realistic models. The objective is to provide some constraints on the saline fluid circulation at the regional scale as well as to un-derstand if the heterogeneity and hydrodynamic conditions may induce a wide range of leaching rates which could explain the large range of chloride concentrations observed.
20
8 Conclusions
Chloride concentrations in groundwater were investigated in the Armorican basement at shallow depth (from +350 to −150 m a.s.l.). The high concentrations observed in some places (from 60 to 1400 mg L−1) are shown to originate from marine transgres-sions. The distributions of high chloride concentrations are in good agreement with
25
HESSD
11, 6599–6635, 2014 Time scales of regional circulation of saline fluids A. Armandine Les Landes et al. Title Page Abstract Introduction Conclusions References Tables Figures ◭ ◮ ◭ ◮ Back CloseFull Screen / Esc
Printer-friendly Version Interactive Discussion Discussion P a per | Discus sion P a per | Discussion P a per | Discussion P a per |
between the Mio-Pliocene and Pleistocene ages. During each of the last transgres-sions, seawater was introduced by gravity-driven flow at great depth in the basement. This seawater end-member has only partially been flushed by meteoric waters (over 1 to 2 million yr) between successive marine transgressions, and since the last one. Con-sidering the paleocoastlines, three zones have been affected by the transgressions.
5
The average chloride concentration calculated for each area is inversely related to the time elapsed since last marine transgression. This relationship between concentra-tion and transgression age can be fitted by a decreasing exponential funcconcentra-tion which indicates that chloride flushing from the aquifers is a process requiring approximately 2 Myr. The fate of chloride is conceptualized using two main models: a dilution or
leach-10
ing of a deep reservoir. Both models provide information on the history of the saline fluids in fractured aquifers. The first model requires a drastic partitioning between shal-low and deep aquifers. In the second model, chlorides are supposed to be released by diffusion from a deep reservoir, leached by fresh groundwater flow and bringing up to the shallower aquifer. The model supposes a deep reservoir, which has not yet been
15
identified in the Armorican massif, but could exist. This study thus provides important constraints on the seawater circulation in hardrock aquifers at a continental-scale area.
Appendix A:
The objective of this section is to develop simple calculations that aim at figuring out the meaning of the data and fit presented before. We first assume that the average of
20
chloride concentrations measured is related to the average chloride concentration in the aquifer used in the model. Because of the increase of chloride concentration with depth and because of the limited sampling depth, it is unreasonable to pretend that the average of the measurements equals the chloride average concentration in the entire aquifer. Thus, we just guess that the chloride average in the entire aquifer evolves with
25
a similar time scale to the measured averages, which occur for instance if the depth dependency function is similar in different places. Regardless of the model, the general
HESSD
11, 6599–6635, 2014 Time scales of regional circulation of saline fluids A. Armandine Les Landes et al. Title Page Abstract Introduction Conclusions References Tables Figures ◭ ◮ ◭ ◮ Back CloseFull Screen / Esc
Printer-friendly Version Interactive Discussion Discussion P a per | Discus sion P a per | Discussion P a per | Discussion P a per |
evolution of the chloride concentration is given by a mass balance equation of the type: d(V c)
dt = −Qc+ Qin (A1)
whereV is the system volume, c the average chloride concentration in the system, Qc
the total flow at the system discharge boundary, andQin the total flow at the system
5
recharge boundary. The “system” can be the entire aquifer or any part of it.Qin
rep-resents a potential chloride inflow from the recharge boundary. If we assume a back-ground concentrationco,Qin can be written as:
Qin=
Z Z
Srr(s) · co
ds = co· Ar· r (A2)
10
where Sr is the system recharge boundary, r(s) the recharge at any point s of the
boundary,Ar the recharge boundary surface, andr the average recharge flow.
We then define two end-member models that may explain the chloride evolution in basement aquifers.
A1 The perfectly mixed aquifer
15
In the first model, the chloride contained in the deeper part of the aquifer is slowly flushed out from the system along the discharge at a rateQcsuch as:
Qc= Z Z
Sdq(s) · c(s) · ds
(A3)
where Sd is the system discharge boundary, q(s) the flow discharge at any point s
20
of the boundary, andc(s) the chloride concentration. In a perfectly-mixed reactor, the
total concentration at the boundary is equal to the concentrations average. Even if this approximation is certainly unlikely in highly heterogeneous aquifers, we assume that
HESSD
11, 6599–6635, 2014 Time scales of regional circulation of saline fluids A. Armandine Les Landes et al. Title Page Abstract Introduction Conclusions References Tables Figures ◭ ◮ ◭ ◮ Back CloseFull Screen / Esc
Printer-friendly Version Interactive Discussion Discussion P a per | Discus sion P a per | Discussion P a per | Discussion P a per |
theQc integral can be estimated from the averages of concentrations and discharge Qcdefined as:
Qc= O · Ad· q · c (A4)
where q and c are the discharge and concentration averages, respectively, and Ad
5
is the total surface of the system discharge boundary. O(1) is a constant equal to 1 in the perfectly-mixed approximation, and whose order of magnitude is about 1 if the approximation is not rigorously exact. The water mass-balance requires that the total discharge equals the total recharge:Adq = Arr. If we assume that the aquifer system is
a rectangular box fed from above with a recharge r, using a thicknessh =AVr, Eq. (A1)
10
writes as a first-order kinetic equation: dc
dt =
(co− O(1) · c)
τ (A5)
with the time constantτ equal to hr.
If we consider that r is of the same order as it is now in Brittany (about 200 mm yr−1),
15
given the time constantτ of 2.3 Myr, we predict an unrealistic aquifer depth h of about
500 km. Although the actual depth is not known, it is likely less than a few km and more likely about 1 km. This means that the dilution model is valid only if the recharge is at least 2 to 3 orders of magnitude less than the current rainfall.
A2 The deep reservoir diffusion model
20
In the second model, we assume that chlorides are leached out from the aquifer system by diffusion from a deep layer of thickness h′without any advection.Q
cis a bit different
from Eq. (A5) because diffusion occurs (i) on all the system boundaries, and (ii) at a rate equal to q(s) = D∂c(s)∂n , where n is the direction perpendicular to the system
boundary. It is not easy to estimate simply q(s). We assume that the concentration
25
HESSD
11, 6599–6635, 2014 Time scales of regional circulation of saline fluids A. Armandine Les Landes et al. Title Page Abstract Introduction Conclusions References Tables Figures ◭ ◮ ◭ ◮ Back CloseFull Screen / Esc
Printer-friendly Version Interactive Discussion Discussion P a per | Discus sion P a per | Discussion P a per | Discussion P a per |
h′, which is a reasonable assumption if the aquifer thickness is small compared to its
horizontal extentQcis defined as :
Qc= O′· A · D ·
(c − co)
h′ (A6)
withO′an “order-of-magnitude” constant similar toO. The influx Q
inis now nil and the
5
general equation writes as: dc dt = (co− c) τ′ (A7) withτ′ = O′−1·h ′2 D.
The molecular diffusion Dm of chloride in water is of the order of 2 × 10⁻⁹m 2
s−1 (Li
10
and Gregory, 1974; Wang et al., 1953). Considering a porosity of 1 %, the diffusion D of chloride is of the order of 2 × 10⁻¹¹m2s−1. A time constant of 2.3 Myr is thus consistent with a salt layer thickness of about 40 m.
References
Aquilina, L. and De Dreuzy, J.-R.: Relationship of present saline fluid with paleomigration of
15
basinal brines at the basement/sediment interface (Southeast basin – France), Appl. Geo-chemistry, 26, 1933–1945, doi:10.1016/j.apgeochem.2011.06.022, 2011.
Aquilina, L., Pauwels, H., Genter, A., and Fouillac, C.: Water-rock interaction processes in the Triassic sandstone and the granitic basement of the Rhine Graben: geochemi-cal investigation of a geothermal reservoir, Geochim. Cosmochim. Acta, 61, 4281–4295,
20
doi:10.1016/S0016-7037(97)00243-3, 1997.
Aquilina, L., Armandine Les Landes, A., Ayraud-Vergnaud, V., Labasque, T., Roques, C., Davy, P., Pauwels, H., and Petelet-Giraud, E.: Evidence for a saline component at shal-low depth in the crystalline armorican basement (W France), Procedia Earth Planet. Sci., 7, 19–22, doi:10.1016/j.proeps.2013.03.157, 2013.
HESSD
11, 6599–6635, 2014 Time scales of regional circulation of saline fluids A. Armandine Les Landes et al. Title Page Abstract Introduction Conclusions References Tables Figures ◭ ◮ ◭ ◮ Back CloseFull Screen / Esc
Printer-friendly Version Interactive Discussion Discussion P a per | Discus sion P a per | Discussion P a per | Discussion P a per |
Ayraud, V., Aquilina, L., Labasque, T., Pauwels, H., Molenat, J., Pierson-Wickmann, A.-C., Durand, V., Bour, O., Tarits, A.-C., Le Corre, P., Fourre, E., Merot, P., and Davy, P.: Compartmentalization of physical and chemical properties in hard-rock aquifers deduced from chemical and groundwater age analyses, Appl. Geochemistry, 23, 2686–2707, doi:10.1016/j.apgeochem.2008.06.001, 2008.
5
Banks, D., Odling, N., Skarphagen, H., and Rohr-Torp, E.: Permeability and stress in crystalline rocks, Terra Nova, 8, 223–235, 1996.
Beaucaire, C., Gassama, N., and Tresonne, N.: Saline groundwaters in the hercynian granites (Chardon Mine, France): geochemical evidence for the salinity origin, Appl. Geochemistry, 14, 67–84, doi:10.1016/S0883-2927(98)00034-1, 1999.
10
Bonnet, S., Guillocheau, F., and Brun, J. P.: Relative uplift measured using river incisions: the case of the Armorican basement (France), Surf. Geosci., 327, 245–251, 1998.
Bonnet, S., Guillocheau, F., and Brun, J.: Large-scale relief development related to Quaternary tectonic uplift of a Proterozoic-Paleozoic basement, J. Geophys. Res., 105, 19273–19288, 2000.
15
Le Borgne, T., Bour, O., de Dreuzy, J. R., Davy, P., and Touchard, F.: Equivalent mean flow models for fractured aquifers: insights from a pumping tests scaling interpretation, Water Resour. Res., 40, W03512, doi:10.1029/2003WR002436, 2004.
Le Borgne, T., Bour, O., Paillet, F. L., and Caudal, J.-P.: Assessment of preferential flow path connectivity and hydraulic properties at single-borehole and cross-borehole scales in a
frac-20
tured aquifer, J. Hydrol., 328, 347–359, doi:10.1016/j.jhydrol.2005.12.029, 2006.
Bottomley, D. J., Gregoire, D. C., and Ravens, K. G.: Saline groundwaters and brines in the Canadian Shield: geochemical for a residual evaporite brine component and isotopic evi-dence, Geochim. Cosmochim. Acta, 58, 1483–1498, 1994.
Bottomley, D. J., Katz, A., Chan, L. H., Starinsky, A., Douglas, M., Clark, I. D., and Raven, K. G.:
25
The origin and evolution of Canadian Shield brines: evaporation or freezing of seawater? New lithium isotope and geochemical evidence from the Slave craton, Chem. Geol., 155, 295–320, doi:10.1016/S0009-2541(98)00166-1, 1999.
Brault, N.: Ressources du sous-sol et environnement en Bretagne. Génèse, géométrie et pro-priétés de différents types d’aquifères, Ph.D. ,University of Rennes 1, Rennes, 240 pp., 2002.
30
Brault, N., Bourquin, S., Guillocheau, F., Dabard, M.-P., Bonnet, S., Courville, P., Estéoule-Choux, J., and Stepanoff, F.: Mio–Pliocene to Pleistocene paleotopographic evolution of
HESSD
11, 6599–6635, 2014 Time scales of regional circulation of saline fluids A. Armandine Les Landes et al. Title Page Abstract Introduction Conclusions References Tables Figures ◭ ◮ ◭ ◮ Back CloseFull Screen / Esc
Printer-friendly Version Interactive Discussion Discussion P a per | Discus sion P a per | Discussion P a per | Discussion P a per |
Brittany (France) from a sequence stratigraphic analysis: relative influence of tectonics and climate, Sediment. Geol., 163, 175–210, doi:10.1016/S0037-0738(03)00193-3, 2004. Bucher, K. and Stober, I.: Fluids in the upper continental crust, Geofluids, 10, 241–253,
doi:10.1111/j.1468-8123.2010.00279.x, 2010.
Cardenas, M. B.: Potential contribution of topography-driven regional groundwater flow to fractal
5
stream chemistry: residence time distribution analysis of Tóth flow, Geophys. Res. Lett., 34, L05403, doi:10.1029/2006GL029126, 2007.
Carpenter, A. B.: Origin and Chemical Evolution of Brines in Sedimentary Basins, in: SPE Annual Fall Technical Conference and Exhibition, 1–3 October, 1978.
Casanova, J., Negrel, P., Kloppmann, W., and Aranyossy, J. F.: Origin of deep saline
ground-10
waters in the Vienne granitic rocks (France): constraints inferred from boron and strontium isotopes, Geofluids, 1, 91–101, doi:10.1046/j.1468-8123.2001.00009.x, 2001.
Chantraine, J., Egal, E., Thieblemont, D., Le Goff, E., Guerrot, C., and Ballevre, M.: The Cadomian active margin (North Armorican Massif, France): a segment of the North Atlantic Panafrican belt, Tectonophysics, 331, 1–18, 2001.
15
Clauser, C.: Permeability of crystalline rocks, Eos T. Am. Geophys. Un., 73, 233–238, 1992. Le Corre, C., Auvray, B., Ballèvre, M., and Robardet, M.: Le Massif Armoricain, Sci. Geol. Bull.,
44, 31–103, 1991.
Dewandel, B., Lachassagne, P., and Wyns, R.: A generalized 3-D geological and hydrogeolog-ical conceptual model of granite aquifers controlled by single or multiphase weathering, J.
20
Hydrol., 330, 260–284, doi:10.1016/j.jhydrol.2006.03.026, 2006.
Dorn, C., Linde, N., Doetsch, J., Le Borgne, T., and Bour, O.: Fracture imaging within a granitic rock aquifer using multiple-offset single-hole and cross-hole GPR reflection data, J. Appl. Geophys., 78, 123–132, doi:10.1016/j.jappgeo.2011.01.010, 2012.
Douglas, M., Clark, I. D., Raven, K., and Bottomley, D.: Groundwater mixing dynamics at
25
a Canadian Shield mine, J. Hydrol., 235, 88–103, doi:10.1016/S0022-1694(00)00265-1, 2000.
Dugué, O.: Le Massif Armoricain dans l’evolution Mésozoique et Cénozoique du nord-ouest de l’Europe, H.D.R, University of Caen, Caen, 346 pp., 2007.
Edmunds, W. and Savage, D.: Geochemical characteristics of groundwater in granites and
30
related crystalline rocks, in: Applied Groundwater Hydrology, edited by: Downing, R. A. and Wilkinson, W. B., Clarendon Press, Oxford, UK, 1991.
HESSD
11, 6599–6635, 2014 Time scales of regional circulation of saline fluids A. Armandine Les Landes et al. Title Page Abstract Introduction Conclusions References Tables Figures ◭ ◮ ◭ ◮ Back CloseFull Screen / Esc
Printer-friendly Version Interactive Discussion Discussion P a per | Discus sion P a per | Discussion P a per | Discussion P a per |
Edmunds, W., Kay, R. L. F., and McCartney, R.: Origin of saline groundwaters in the Carnmenel-lis granite (Cornwall, England): natural processes and reaction during hot dry rock reservoir circulation, Chem. Geol., 49, 287–301, 1985.
Frape, S., Fritz, P., and Blackmer, A.: Saline groundwater discharges from crystalline rocks near Thunder Bay, Ontario, Canada, Balanc. Freshw. Syst., available at: http://iahs.info/redbooks/
5
a150/150034.pdf (last access: 15 March 2013), 1984.
Frape, S. K., Blyth, A., Blomqvist, R., McNutt, R. H., and Gascoyne, M.: Deep fluids in the continents: II. Crystalline rocks, edited by: Drever, J. I., Holland, H. D., and Turekian, K. K.. Treatise on Geochemistry, Vol. 5, Surface and Groundwater, Weathering, and Soils, Elsevier-Pergamon, Oxford, p. 560, 2003.
10
Freeman, J. T.: The use of bromide and chloride mass ratios to differentiate salt-dissolution and formation brines in shallow groundwaters of the Western Canadian Sedimentary Basin, Hydrogeol. J., 15, 1377–1385, 2007.
Fritz, P.: Saline groundwater and brines in crystalline rocks: the contributions of John Andrews and Jean-Charles Fontes to the solution of a hydrogeological and geochemical problem,
15
Appl. Geochemistry, 12, 851–856, doi:10.1016/S0883-2927(97)00074-7, 1997.
Fritz, P. and Frape, S. K.: Saline groundwaters in the Canadian Shield – a first overview, Chem. Geol., 36, 179–190, 1982.
Gascoyne, M. and Kamineni, D. C.: The hydrogeochemistry of fractured plutonic rocks in the Canadian Shield, Hydrogeol. J., 2, 43–49, doi:10.1007/s100400050044, 1994.
20
Goderniaux, P., Davy, P., Bresciani, E., de Dreuzy, J.-R., and Le Borgne, T.: Partitioning a re-gional groundwater flow system into shallow local and deep rere-gional flow compartments, Water Resour. Res., 49, 2274–2286, doi:10.1002/wrcr.20186, 2013.
Greene, S., Battye, N., Clark, I., Kotzer, T., and Bottomley, D.: Canadian Shield brine from the Con Mine, Yellowknife, NT, Canada: noble gas evidence for an evaporated Palaeozoic
25
seawater origin mixed with glacial meltwater and Holocene recharge, Geochim. Cosmochim. Acta, 72, 4008–4019, doi:10.1016/j.gca.2008.05.058, 2008.
Gros, Y. and Limasset, O.: Déformation récente dans les socles cristallins. Exemple du Massif Armoricain, BRGM, Orléans-la-Source, 1984.
Guillocheau, F., Brault, N., Thomas, E., Barbarand, J., Bonnet, S., Bourquin, S.,
Estéoule-30
Choux, J., Guennoc, P., Menier, D., Néraudeau, D., Proust, J.-N., and Wyns, R.: Histoire géologique du Massif Armoricain depuis 140MA (Crétacé-Actuel)-Geological history of the Armorican Massif since 140 M y (Cretaceous-Present Day), Bull. Inf., 40, 13–28, 2003.
HESSD
11, 6599–6635, 2014 Time scales of regional circulation of saline fluids A. Armandine Les Landes et al. Title Page Abstract Introduction Conclusions References Tables Figures ◭ ◮ ◭ ◮ Back CloseFull Screen / Esc
Printer-friendly Version Interactive Discussion Discussion P a per | Discus sion P a per | Discussion P a per | Discussion P a per |
Gumiaux, C., Gapais, D., Brun, J. P., Chantraine, J., and Ruffet, G.: Tectonic history of the Hercynian Armorican Shear belt (Brittany, France), Geodin. Acta, 17, 289–307, 2004. Hardenbol, J. A. N., Thierry, J., Farley, M. B., Cnrs, U. R. A., and Vail, P. R.: Mesozoic and
Ceno-zoic sequence chronostratigraphic fremework of European basins. The chronostratigraphic charts presented in this paper are the result of an initiative by Peter Vail and Thierry Jacquin
5
in 1990 to analyze and document depositional sequence, SEPM Special Publication, 60, 3–13, 1998.
Ingebritsen, S. and Manning, C. E.: Geological implications of a permeability-depth curve for the continental crust, Geology, 27, 1107–1110, 1999.
Jost, A.: Caractérisation des forçages climatiques et géomorphologiques des cind derniers
10
millions d’années et modélisation de leurs conséquences sur un système aquifère complexe: le bassin de Paris, Ph.D., University of Pierre and Marie Curie, Paris, 344 pp., 2005.
Kelly, V. R., Lovett, G. M., Weathers, K. C., Findlay, S. E. G., Strayer, D. L., Burns, D. J., and Likens, G. E.: Long-term sodium chloride retention in a rural watershed: legacy ef-fects of road salt on streamwater concentration, Environ. Sci. Technol., 42, 410–415,
15
doi:10.1021/es071391l, 2008.
Lague, D., Davy, P., and Crave, A.: Estimating uplift rate and erodibility from the area-slope examples from Brittany (France) and numerical modelling relationship, Phys. Chem. Earth, 25, 543–548, 2000.
Larsson, I.: Les eaux souterraines des roches dures du socle: Projet 8.6 du Programme
20
Hydrologique International, Report, Paris: UNESCO (Eds), collection Etudes et rapports d’hydrologie, 33, 282 pp., 1987.
Lefebvre, D., Antoine, P., Auffret, J. P., Lautridou, J. P., and Lécolle, F.: Réponses de la Seine et de la Somme aux événements climatiques, eustatiques et tectoniques du Pléistocène moyen et récent?: rythmes et taux d’érosion (The responses of the river Seine and of
25
the river Somme to the climatic, eustatic and tectonic controls), Quaternaire, 5, 165–172, doi:10.3406/quate.1994.2028, 1994.
Lenôtre, N., Thierry, P., Blanchin, R., and Brochard, G.: Current vertical movement demon-strated by comparative levelling in Brittany (northwestern France), Tectonophysics, 301, 333– 344, 1999.
30
Leray, S., de Dreuzy, J.-R., Bour, O., and Bresciani, E.: Numerical modeling of the productivity of vertical to shallowly dipping fractured zones in crystalline rocks, J. Hydrol., 481, 64–75, doi:10.1016/j.jhydrol.2012.12.014, 2013.
HESSD
11, 6599–6635, 2014 Time scales of regional circulation of saline fluids A. Armandine Les Landes et al. Title Page Abstract Introduction Conclusions References Tables Figures ◭ ◮ ◭ ◮ Back CloseFull Screen / Esc
Printer-friendly Version Interactive Discussion Discussion P a per | Discus sion P a per | Discussion P a per | Discussion P a per |
Li, Y.-H. and Gregory, S.: Diffusion of ions in sea water and in deep-sea sediments, Geochim. Cosmochim. Acta, 38, 703–714, 1974.
Louvat, D., Michelot, J.-L., and Aranyossy, J. F.: Origin and residence time of salinity in the Aspo groundwater system, Appl. Geochemistry, 14, 917–925, 1999.
Martin, C., Aquilina, L., Gascuel-Odoux, C., Molénat, J., Faucheux, M., and Ruiz, L.: Seasonal
5
and interannual variations of nitrate and chloride in stream waters related to spatial and tem-poral patterns of groundwater concentrations in agricultural catchments, Hydrol. Process., 18, 1237–1254, 2004.
Mercier, D., Brulhet, J., Beaudoin, B., Cahuzac, B., Laurent, M., Lauriat-Rage, A., Marg-erel, J. P., Moguedet, G., Moritz, R., Sierra, P., Thiry, M., Turpin, L., Van Vliet-Lanoë, B.,
10
and Vauthier, S.: Le Redonien de l’Ouest de la France: enregistrement des événements (climatiques, eustatiques) messiniens et pliocènes sur la façade atlantique, 1res journées GFEN-APF, Rennes, 6—7 December, 12–13, 2000.
Morzadec-Kerfourn, M.-T.: La limite Pliocene– Pleistocene en Bretagne, Boreas, 6, 275–283, 1977.
15
Morzadec-Kerfourn, M. T.: Datation pollinique et conditions de sédimentation de l’argile plio-pléistocène de Lanrinou en Landerneau, Bull. l’Association française pour l’étude du Quat., 19, 179–184, 1982.
Morzadec-Kerfourn, M. T.: Dinoflagellate cysts and the paleoenvironment of late Pliocene early-Pleistocene deposits of Brittany, Quat. Sci. Rev., 16, 883–898, 1997.
20
Mullaney, J. R., Lorenz, D. L., and Arntson, A. D.: Chloride in Groundwater and Surface Water in Areas Underlain by the Glacial Aquifer System, Northern United States Scientific Investi-gations Report 2009–5086, USGS, New-York, 2009.
Müller, B., Zoback, M. L., Fuchs, K., Mastin, L., Gregersen, S., Pavoni, N., Stephansson, O., and Ljunggren, C.: Regional patterns of tectonic stress in Europe, J. Geophys. Res., 97,
25
11783–11803, 1992.
Négrel, P. and Casanova, J.: Comparison of the Sr isotopic signatures in brines of the Canadian and Fennoscandian shields, Appl. Geochemistry, 20, 749–766, doi:10.1016/j.apgeochem.2004.11.010, 2005.
Négrel, P. and Pauwels, H.: Interaction between different groundwaters in Brittany catchments
30
(France): characterizing multiple sources through strontium- and sulphur isotope tracing, Wa-ter, Air, Soil Pollut., 151, 261–285, doi:10.1023/B:WATE.0000009912.04798.b7, 2004.
HESSD
11, 6599–6635, 2014 Time scales of regional circulation of saline fluids A. Armandine Les Landes et al. Title Page Abstract Introduction Conclusions References Tables Figures ◭ ◮ ◭ ◮ Back CloseFull Screen / Esc
Printer-friendly Version Interactive Discussion Discussion P a per | Discus sion P a per | Discussion P a per | Discussion P a per |
Néraudeau, D., Mercier, D., Van Vliet-Lanoë, B., and Lauriat-Rage, A.: Les faluns redoniens stratotypiques, enregistrement partiel du Messinien atlantique, 1res journées GFEN-APF, 2002.
Néraudeau, D., Barbe, S., Mercier, D., and Roman, J.: Signatures paléoclimatiques des échinides du Néogène final atlantique à faciès redonien, Ann. Paléontologie, 89, 153–170,
5
doi:10.1016/S0753-3969(03)00023-5, 2003.
Néraudeau, D., Dudicourt, J.-C., Boutin, F., Ceulemans, L., and Nicolleau, P.: Les Spatan-gus du Miocène et du Pliocène de l’Ouest de la France, Ann. Paléontologie, 96, 159–170, doi:10.1016/j.annpal.2011.05.001, 2010.
Nicolas, M., Santoire, J. P., and Delpech, P. Y.: Intraplate seismicity: new seismotectonic data in
10
Western Europe, Tectonophysics, 179, 27–53, doi:10.1016/0040-1951(90)90354-B, 1990. Nordstrom, D. K., Olsson, T., Carlsson, L., Fritz, P., Survey, U. S. G., Road, M., and Park, M.:
Introduction to the hydrogeochemical investigations within the International Stripa Project, Geochim. Cosmochim. Acta, 53, 1717–1726, 1989.
Panno, S. V., Hackley, K. C., Hwang, H. H., Greenberg, S. E., Krapac, I. G., Landsberger, S., and
15
O’Kelly, D. J.: Characterization and identification of Na-Cl sources in ground water, Ground Water, 44, 176–87, doi:10.1111/j.1745-6584.2005.00127.x, 2006.
Pauwels, H., Fouillac, C., and Fouillac, A.: Chemistry and isotopes of deep geothermal saline fluids in the Upper Rhine Graben: origin of compounds and water-rock interactions, Geochim. Cosmochim. Acta, 57, 2737–2749, 1993.
20
Pauwels, H., Ayraud-Vergnaud, V., Aquilina, L., and Molénat, J.: The fate of nitrogen and sulfur in hard-rock aquifers as shown by sulfate-isotope tracing, Appl. Geochemistry, 25, 105–115, doi:10.1016/j.apgeochem.2009.11.001, 2010.
Pauwels, H., Aquilina, L., Negrel, P., Bour, O., Perrin, J., and Ahmed, S.: Groundwater saliniza-tion in hard-rock aquifers: impact of pumping and vertical transfers, Procedia Earth Planet.
25
Sci., 7, 660–664, doi:10.1016/j.proeps.2013.03.189, 2013.
Perera, N., Gharabaghi, B., and Howard, K.: Groundwater chloride response in the Highland Creek watershed due to road salt application: a re-assessment after 20 years, J. Hydrol., 479, 159–168, doi:10.1016/j.jhydrol.2012.11.057, 2013.
Roques, C.: Hydrogeologie des zones de faille du socle cristallin: implications en terme de
30
ressources en eau pour le Massif Armoricain, Ph.D., University of Rennes 1, Rennes, 266 pp., 2013.