HAL Id: hal-00316599
https://hal.archives-ouvertes.fr/hal-00316599
Submitted on 1 Jan 2000
HAL is a multi-disciplinary open access
archive for the deposit and dissemination of sci-entific research documents, whether they are pub-lished or not. The documents may come from teaching and research institutions in France or abroad, or from public or private research centers.
L’archive ouverte pluridisciplinaire HAL, est destinée au dépôt et à la diffusion de documents scientifiques de niveau recherche, publiés ou non, émanant des établissements d’enseignement et de recherche français ou étrangers, des laboratoires publics ou privés.
Total ozone decrease in the Arctic after REP events
V. C. Roldugin, M. I. Beloglazov, G. F. Remenets
To cite this version:
V. C. Roldugin, M. I. Beloglazov, G. F. Remenets. Total ozone decrease in the Arctic after REP events. Annales Geophysicae, European Geosciences Union, 2000, 18 (3), pp.332-336. �hal-00316599�
Total ozone decrease in the Arctic after REP events
V. C. Roldugin1, M. I. Beloglazov1, G. F. Remenets2
1Polar Geophysical Institute, Apatity, Murmansk reg., Russia E-mail: [email protected]
2Institute of Radiophysics, University of St.-Petersburg, Russia
Received: 17 December 1997 / Revised: 23 April 1999 / Accepted: 10 May 1999
Abstract. Eight periods of relativistic electron precipi-tation (REP) with electron energies of more than 300 keV are identi®ed from VLF data (10±14 kHz) monitored along the Aldra (Norway) ± Apatity (Kola peninsula) radio trace. In these cases, anomalous ionization below 55±50 km occurred without disturbing the higher layers of the ionosphere. The daily total ozone values in Murmansk for six days before and six days after the REP events are compared. In seven of eight events a decrease in the total ozone of about 20 DU is observed. In one event of 25 March, 1986, the mean total ozone value for six days before the REP is bigger than that for six days after, but this a case of an extremely high ozone increase (144 DU during the six days). However, on days 3 and 4 there was a minimum of about 47 DU with regard to REP days, so this case also con®rms the concept of the ozone decrease after REP. The dierence between mean ozone values for periods six days before and six days after the REPs was found also for 23 points in Arctic on TOMS data. The dierence was negative only in Murmansk longitudinal sector. Along the meridian of the trace it was negative at high latitudes in both hemispheres and was near zero at low latitudes.
Key words: Atmospheric composition and structure (middle atmosphere ± composition and chemistry) ± Meteorology and atmospheric dynamics (polar meteorology)
1 Introduction
The eects of high energy particle precipitation on the ozone layer are noted in many works. Stephenson and Scour®eld (1992) have observed from satellite data,
ozone depletion over the polar caps caused by solar protons. Shumilov et al. (1992) described the same eect using ground data. Shumilov et al. (1997) also reported an ozone increase of 10% after Forbush decreases of galactic cosmic rays.
Hence, we might expect similar or even stronger eects after atmospheric penetration of relativistic electrons with energy of more than 300 keV. Baker et al. (1990a) discussed the ozone decrease in the upper stratosphere speculatively, but without any concrete investigations. Callis et al. (1991a, b) connect the ozone decrease in the 1980s with enhancement of relativistic electron ¯uxes which produce odd nitrogen molecules. Their model suggests that by 1985 the relativistic electrons are responsible for 2.6% decay of the global ozone.
2 Ground-based data
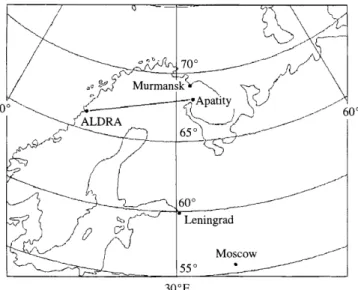
As a rule, relativistic electron precipitation (REP) events are registered by measurements on satellites. We do not know of published records or year books with these data. To identify REP events we have used data of amplitude and phase measurements on VLF traces (10.2, 12.1 and 13.6 kHz) at Aldra (Norway, 66.3°N, 13.2°E) and Apatity (Kola peninsula, 67.5°N, 33.3°E); see map in Fig. 1. Remenets and Beloglazov (1992) have shown that, on this trace during sunlit conditions, speci®c variations of VLF signal occur in REP events: amplitudes and phases of all three frequencies diminish simultaneously in the absence of magnetic disturbances and anomalous riometer absorption.
To model numerically the changes of the electron pro®les in the low ionosphere during REP events, Beloglazov and Remenets (1997) have selected 12 such cases for the period 1982±1989. The principle of selection was the high quality of the experimental data in order to solve the VLF inversion problem. The results of the calculations have shown signi®cant changes in electron pro®les below 50 km, i.e., in the stratosphere.
These events are compared with variations of the total ozone in Murmansk which is situated not far from
the radio trace (see Fig. 1). The event number is reduced to eight because one case occurred in November when the ozone measurements are not carried out, and three others took place from one to three days after the preceding precipitation and were combined as single events. In Table 1, dates and times of the start and end of the chosen events are shown. They occurred during the daylight portion of the day and had durations from 5 min to 10 h. Magnetic disturbances and riometer absorption in Kola peninsula were absent during these events.
The cosmic ray intensity is examined for these events using data from the neutron monitor in Apatity. Six events occurred in quiet conditions or in small Forbush decreases. The case of 29 September, 1989, occurred during the strong solar proton event with the onset at 1150 UT. Table 1 shows that this REP event ended 2 h before the onset. Certainly, in this event both relativistic electrons and solar protons may in¯uence on the ozone layer. The case of 23 October, 1989, was in the Forbush decrease just after SPE at 22 October.
All eight events have occurred when even the troposphere was illuminated by the Sun. It is in accordance with the result of Beloglazova and Bel-oglazov (1982), that the diurnal variation of such
phenomena in Apatity has maximum at 11±19 LT, or nearly 9±17 UT.
Baker et al. (1990b) found a strong 13- and 27-day periodicity of the ¯uxes of high-energy electrons. Despite the small number of our cases, this periodicity is seen well: (1) 15 and 29 September 1982, (2) 25±27 March and 22±23 April, 1986, (3) 22±23 April and 5 May, 1986, and (4) 29 September and 23 October, 1989. It con®rms that the phenomena picked in the VLF propagation are REP events.
According to data from Baker et al. (1990a), the REP events occur on the geomagnetic latitude 62° 6°. The geomagnetic latitude of Murmansk is about 64°, the main part of the radio trace is situated also in the REP zone. Murmansk is to the east of the trace, and the main winds in this region are westerly, which carry ozone from the trace to the observatory. Thus, the disposition of the stations can be regarded as favourable for this investigation. The total ozone values in Murmansk are taken from the Soviet year-books edited by Gushchin (1984, etc).
3 Ozone changes in Murmansk
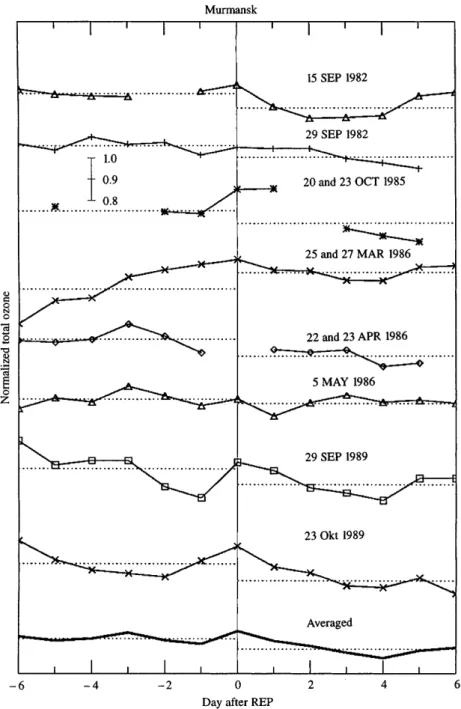
The mean daily ozone data were picked out for the intervals between 6 days before to 6 days after the REP events. They are shown in Fig. 2. To smooth over seasonal dependence, the ozone variations are shown here in relative units, normalized to the values for the day of the REP, which is marked in Fig. 2 by the vertical line. This relative scale is shown. For three cases of twinned REP occurrences with 1±3 days of lag combined into single events, the zero day is taken as the day of the ®rst REP event. Annoying gaps in the ozone date can be seen, however, in Murmansk gaps in ozone data usually occur more frequently than in these cases. The bottom curve is the result of averaging of all eight normalized curves. The dotted horizontal lines show the mean ozone values before and after the REP events.
Figure 2 shows that for seven events out of the eight studied the mean ozone values after the REPs are smaller than before. The dierences in Dobson Units are given in Table 1, where the mean ozone values before and after the events together with the mean square
Fig. 1. Map of the VLF trace
Table 1. List of REP events and changes of total ozone in Murmansk
No Day Time (UT) Ozone
Beginning End Before REP After REP Dierence
1 15 September 1982 12 h 55 m 13 h 50 m 343 2 319 8 25 2 29 September 1982 13 h 20 m 13 h 25 m 333 4 314 6 20 3 20 October 1985 10 h 50 m 12 h 10 m 292 3 272 18 20 23 October 1985 8 h 48 m 11 h 30 m 4 25 March 1986 9 h 30 m 17 h 00 m 403 21 439 6 )36 (47) 27 March 1986 12 h 35 m 19 h 30 m 5 22 April 1986 12 h 15 m 22 h 00 m 472 8 435 8 37 23 April 1986 18 h 20 m 20 h 20 m 6 5 May 1986 7 h 30 m 9 h 40 m 417 6 410 6 7 7 29 September 1989 4 h 00 m 10 h 00 m 273 11 252 6 21 8 23 October 1989 8 h 08 m 9 h 15 m 226 6 206 7 20
errors are given also, in DU. One can see that the dierences are less than the errors, and only for the 5 May, 1986, case is the ozone decrease comparable with the error. The typical value of the dierence is about 20 DU.
In one example for 25±27 March, 1986, the mean ozone value before the REP is signi®cantly larger than after it. However in that case the extremely large total ozone increase happened when the ozone rise of 144 DU occurred for these six days. Later however, an appre-ciable ozone decrease was seen the next day and also on the third fourth day, when the ozone value was smaller by 47 DU than the highest on the REP day. Thus, an ozone decrease took place during this event as well.
At the bottom of Fig. 2, the averaged data for all eight normalized ozone variations are shown. The averaged-out normalized values in the space of six days
are equal to 0.964 before the REP events and 0.915 after, the dierence is 0.049, which is signi®cantly less than errors of both mean values 0.007 and 0.011, correspondingly.
4 Satellite ozone data
For those eight events the ozone changes were examined also for 23 stations situated in high latitudes by using TOMS data. We averaged the total ozone values for 6 days before and 6 days after the events without normalizing to zero day value, and determined mean dierences. The number of stations with negative dierence, corresponding to an ozone decrease, was twices as big as positive one for all events with the exception of 25 March, 1986.
Fig. 2. The normalized ozone variations in Mur-mansk before and after REP events. The dotted lines are mean values. The bottom curve is an average of all eight events
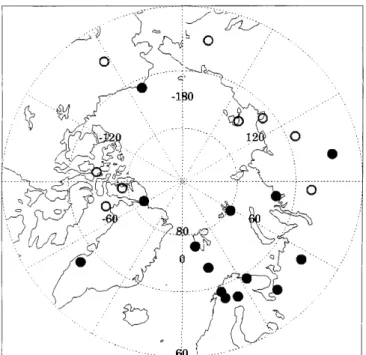
Then, for every event and every station, we excluded the seasonal dierence ``6 days after ± 6 days before''. To do this we calculated the daily averaged variation using the TOMS 1979±1993 data, approximated them by cubic polynomials and then found the required dierence. Figure 3 shows the mean values of eight event dierences, excluding seasonal changes, at all 23 stations by circles: solid circles show a negative dierence, open circles mean a positive dierence. There are 14 stations with decreased total ozone and nine stations with increased ozone. It is clear the stations with ozone decreases are grouped in the longitudinal sector between 60°W±90°E, around the Murmansk meridian. In Mur-mansk the mean ozone decrease is 14 DU (21 DU without the event of 25 March 1986).
On the base of the TOMS data the dierence ``6 days after ± 6 days before'' was determined also along the geographic meridian from the pole to the equator, passing through the middle point between Aldra and Apatity (67°N, 23°E), and then along the geographic meridian in the Southern Hemisphere, passing through the geomagnetic conjugated point (56°S, 63°E). The result is shown in Fig. 4. The vertical bars at both points present the statistical errors. Here the negative de¯ec-tions exceed the error twice. Figure 4 testi®es to the ozone decrease at high latitudes after the REP events. 5 Discussion
The comparison of the total ozone variations in the ground-based observatory at Murmansk before and after eight REP events over Scandinavia reveals an
ozone decrease of about 20 DU over several days. This value exceeds by several times, the mean season ozone diminution for the six day period by about 4 DU and seems to be statistically signi®cant. Accordingly to TOMS data, the ozone decrease is observed also at the area near Murmansk in the Arctic and in the magnetic conjugated area in the Antarctic. The decrease is absent in middle latitudes (see Fig. 4), where the relativistic electrons do not precipitate.
However there are lots of stations in the polar cap where the ozone decrease after REP is not observed, e.g. over eastern Siberia or western Canada. Two dierent reasons for this phenomenon occur to us.
1. Because there is no decrease on the dark side, we can guess that the process of the ozone decay includes any photoreactions. In particular, it may be photolysis of N2O that is involved, see Callis et al. (1991b)
2. The eight REPs chosen were local.
The second explanation seems to be in contradiction with apparent global character of REP. For example, Reeves et al. (1998) demonstrate synchronous temporal variations of relativistic electron ¯uxes of E >2 MeV on 13 satellites in January 1997 over several days.
However, our events were not chosen on the basis of satellite data, but from data of VLF propagation over Scandinavia, so the physical distinction may exist between REPs determined from space and ground-based observations. Really, accordingly to Fig. 1 of Imhof et al. (1991), the precipitating ¯uxes of electrons E >1 MeV at low altitudes from the S81-1 satellite during our REP cases 15 and 29 September 1982 (258 and 272 days), were very moderate. The authors give information of spikes of precipitating relativistic elec-trons exceeding by tenfold the daily averaged trapped ¯uxes at high altitudes.
6 Conclusion
Both ground-based ozone observations and TOMS data testify to an ozone decrease of about 20 DU during
Fig. 3. Main geophysical observatories in the northern polar cap used to examine the dierence of the total ozone after and before the REP events. The solid circles mean the ozone decrease, the open circles mean a positive dierence
Fig. 4. The meridian pro®le of the ozone decrease after the REP events. The vertical bars are standard errors
relativistic electron precipitation events, which were determined from disturbance of VLF propagation.
Acknowledgements. Topical Editor F. Vial thanks D. N. Baker and E. KyroÈ for their help in evaluating this paper.
References
Baker, D. N., J. B. Blake, R. W. Klebesadel, D. D. Sentman, D. J. Gorney, and P. R. Higbie, Relativistic magnetospheric electrons: lower ionospheric conductivity and long-term atmospheric variability, Adv. Space Res., 10, 229±233, 1990a.
Baker, D. N., R. L. McPherron, T. E. Cayton, and R. W. Klebesadel, Linear prediction ®lter analysis of relativistic electron properties at 6.6 RE, J. Geophys. Res., 95, 15 133±15 140, 1990b. Beloglazov, M. I., and G. F. Remenets, Unique ground VLF
monitoring of the relativistic electron precipitation, in Physics of auroral phenomena. XX annual Apatitian seminar. 25±28 February 1997, Abstracts, Preprint PGI-97-01-101, Apatity, 1997.
Beloglazova, G. P., and M. I. Beloglazov, On one type of phase anomaly of VLF-signal at auroral trace, Geomagn. Aeron., 22, 56±59, 1982.
Callis, L. B., R. E. Boughner, M. Natarajan, J. D. Lambeth, D. N. Baker, and J. B. Blake, Ozone depletion in the high latitude lower stratosphere: 1979±1990, J. Geophys. Res., 96, 2921±2937, 1991a.
Callis, L. B., D. N. Baker, J. B. Blake, J. D. Lambeth, R. E. Boughner, M. Natarajan, R. W. Klebesadel, and D. J. Gorney, Precipitating relativistic electrons: their long-term eect on stratospheric odd nitrogen levels, J. Geophys. Res., 96, 2939± 2976, 1991b.
Gushchin, G. P., (Ed.) Total content of the ozone and spectral transparency of the atmosphere // Leningrad, Hydrometeoizdat, 1984 and etc. (in Russian).
Imhof, W. L., H. D. Voss, J. Mobilia, D. W. Datlow, J. P. McGlennon, and D. N. Baker, Relativistic electron enhance-ments: simultaneous measurements from synchronous and low altitude satellites, Geophys. Res. Lett., 18, 397±400, 1991. Reeves, G. D., D. N. Baker, R. D. Belian, J. B. Blake, T. E. Cayton,
J. F. Fennel, R. H. W. Friedel, M. M. Meier, R. S. Selesnick, and H. E. Spence, The global response of relativistic radiation belt electrons to the January 1997 magnetic cloud, Geophys. Res. Lett., 25, 3265±3268, 1998.
Remenets, G. F., and M. I. Beloglazov, Dynamics of an auroral low ionospheric fringe of geophysical disturbances on 29.09.89, Planet. Space. Sci., 40, 1101±1108, 1992.
Shumilov, O. I., K. Henriksen, O. M. Raspopov, and E. A. Kasatkina, Arctic ozone abundance and solar proton events, Geophys. Res. Lett., 19, 1647, 1992.
Shumilov, O. I., E. A. Kasatkina, O. M. Raspopov, and K. Henriksen, In¯uence of Forbush decreases of galactic cosmic rays on the ozone layer, Geomagn. Aeron., 37, 24±31, 1997 (in Russian). Stephenson, J. A. E., and Scour®eld, M. W. J., Ozone depletion
over the polar caps caused by solar protons, Geophys. Res. Lett., 12, 2425, 1992.