HAL Id: hal-00303139
https://hal.archives-ouvertes.fr/hal-00303139
Submitted on 16 Oct 2007HAL is a multi-disciplinary open access
archive for the deposit and dissemination of sci-entific research documents, whether they are pub-lished or not. The documents may come from teaching and research institutions in France or abroad, or from public or private research centers.
L’archive ouverte pluridisciplinaire HAL, est destinée au dépôt et à la diffusion de documents scientifiques de niveau recherche, publiés ou non, émanant des établissements d’enseignement et de recherche français ou étrangers, des laboratoires publics ou privés.
Volatile Organic Compound (VOC) measurements in the
Pearl River Delta (PRD) region, China
Yehan Liu, M. Shao, S. H. Lu, C.-C. Chang, J.-L. Wang, G. Chen
To cite this version:
Yehan Liu, M. Shao, S. H. Lu, C.-C. Chang, J.-L. Wang, et al.. Volatile Organic Compound (VOC) measurements in the Pearl River Delta (PRD) region, China. Atmospheric Chemistry and Physics Discussions, European Geosciences Union, 2007, 7 (5), pp.14707-14745. �hal-00303139�
ACPD
7, 14707–14745, 2007VOCs measurements in Pearl River Delta
Y. Liu et al. Title Page Abstract Introduction Conclusions References Tables Figures ◭ ◮ ◭ ◮ Back Close Full Screen / Esc
Printer-friendly Version Interactive Discussion
EGU
Atmos. Chem. Phys. Discuss., 7, 14707–14745, 2007 www.atmos-chem-phys-discuss.net/7/14707/2007/ © Author(s) 2007. This work is licensed
under a Creative Commons License.
Atmospheric Chemistry and Physics Discussions
Volatile Organic Compound (VOC)
measurements in the Pearl River Delta
(PRD) region, China
Y. Liu1, M. Shao1, S. H. Lu3, C.-C. Chang2, J.-L. Wang3, and G. Chen4
1
State Joint Key Laboratory of Environmental Simulation and Pollution Control, College of Environmental Sciences and Engineering, Peking University, Beijing, China
2
Res. Center of Environment Change, Academia Sinica, Nankang, Taipei 115, Taiwan, China
3
Department of Chemistry, National Central University, Chungli 320, Taiwan, China
4
NASA Langley Research Center, Hampton, VA 23681, USA
Received: 3 September 2007 – Accepted: 9 October 2007 – Published: 16 October 2007 Correspondence to: M. Shao (mshao@pku.edu.cn)
ACPD
7, 14707–14745, 2007VOCs measurements in Pearl River Delta
Y. Liu et al. Title Page Abstract Introduction Conclusions References Tables Figures ◭ ◮ ◭ ◮ Back Close Full Screen / Esc
Printer-friendly Version Interactive Discussion
EGU Abstract
We measured levels of ambient volatile organic compounds (VOCs) at seven sites in the Pearl River Delta (PRD) region of China during the Air Quality Monitoring Cam-paign spanning 4 October to 3 November 2004. Two of the sites, Guangzhou (GZ) and Xinken (XK), were intensive sites at which we collected multiple daily canister 5
samples. The observations reported here provide a look at the VOC distribution, spe-ciation, and photochemical implications in the PRD region. Alkanes constituted the largest percentage (>40%) in mixing ratios of the quantified VOCs at six sites; the ex-ception was one major industrial site that was dominated by aromatics (about 52%). Highly elevated VOC levels occurred at GZ during two pollution episodes; however, 10
the chemical composition of the VOCs did not exhibit noticeable changes during these episodes, except that the fraction of aromatics was about 10% higher. We calculated the OH loss rate to estimate the chemical reactivity of all VOCs. Of the anthropogenic VOCs, alkenes played a predominant role in VOC reactivity at GZ, whereas the contri-butions of reactive aromatics were more important at XK. Our preliminary analysis of 15
the VOC correlations suggests that the ambient VOCs at GZ came directly from local sources (i.e., automobiles); those at XK were influenced by both local emissions and transportation of air mass from upwind areas.
1 Introduction
The Pearl River Delta (PRD) is located in Southern China, extends from the Hong 20
Kong metropolitan area to the northwest, and encompasses 9 cities in the Guangdong Province (Fig. 1). The PRD region has an area of about 41 698 km2and a population of about 45.5 million. It has been the most economically dynamic region of mainland China over the last two decades, with a per capita GDP of U.S.$ 6583 in 2004. The average annual rate of GDP growth in the PRD from 2000 to 2004 was 13.6%, which is 25
ACPD
7, 14707–14745, 2007VOCs measurements in Pearl River Delta
Y. Liu et al. Title Page Abstract Introduction Conclusions References Tables Figures ◭ ◮ ◭ ◮ Back Close Full Screen / Esc
Printer-friendly Version Interactive Discussion
EGU
Guangzhou (GZ), the capital of Guangdong Province, had the highest GDP value (US$ 496 billion) in the PRD region in 2004. Dongguan (DG) is the city with the fastest growth rate GDP (18.7% per year from 2002–2006); it is a major manufacturing base for a wide range of products, including electronics, communication, paper, garments and textiles, food, shoes, and plastic.
5
Associated with the rapid economic development are the high levels of PM2.5 and ozone that have been observed in the PRD region over the past decade (Wang et al., 2003). Concentrations of ozone at GZ rose dramatically during the 1990s. For example, daily average O3concentrations exceeded the second level criterion (80 ppbv, hourly) of the Chinese National Ambient Air Quality Standard (NAAQS) on at least 5 10
days in October 1995 (Zhang et al., 1998). Between October and December 2001, the highest hourly O3 average reached 142 ppbv at Tai O, a site on the north–south centerline of the Pearl Estuary (Wang et al., 2003). The daily concentrations of PM2.5 observed in downtown of GZ reached 111 µg/m3 in 2002, which is nearly twice the level recommended by the US EPA (65 µg/m3, daily) (Li et al., 2005). Such high levels 15
of air pollutants present a serious public health issue.
NOx and volatile organic compounds (VOCs) are important precursors of ground-level ozone. The VOC impact on ozone is closely related to the magnitude and the species emitted from various sources. For instance, liquefied petroleum gas (LPG) leakage played an important role in causing excessive ozone in Mexico City and in 20
Santiago, Chile (Blake and Rowland 1995; Chen et al., 2001). The continuous high levels of atmospheric O3in summer in Houston, Texas were caused mainly by reactive VOCs emitted by petrochemical industries (Ryerson et al., 2003; Jobson et al., 2004), and vehicular emissions have contributed more than 50% of ambient VOCs in Beijing city (Liu et al., 2005). Other studies have indicated the importance of biogenic sources 25
of VOCs (Chameides et al., 1988; Shao et al., 2000; Warneke et al., 2004; de Gouw et al., 2005).
In the PRD, VOC speciation and sources have been quite intensively studied. The most representative work, which was conducted in 2000 (Chan et al., 2006), provided
ACPD
7, 14707–14745, 2007VOCs measurements in Pearl River Delta
Y. Liu et al. Title Page Abstract Introduction Conclusions References Tables Figures ◭ ◮ ◭ ◮ Back Close Full Screen / Esc
Printer-friendly Version Interactive Discussion
EGU
the first snapshot of VOC concentrations in industrial, urban, and industrial-suburban areas and discussed the importance of industrial and vehicular emissions in shaping the spatial variation of VOCs. The measurements at Tai O (Guo et al., 2006; Wang et al., 2005), a remote site between the PRD region and Hong Kong, illustrated how the characteristics of air masses varied with their point of origin, especially in terms 5
of the differences in regional and local contributions to ambient VOCs at the site. Due to the complexity of VOC variation and the rapid changes in VOC sources in the PRD region, more simultaneous measurements of ambient VOCs with CO, NOx, and O3 are needed. An understanding of local VOC source profiles will be helpful in interpreting the sources of VOCs in ambient measurements. The PRD air quality 10
monitoring campaign of 2004 represents the first regional study in China designed to gain a better understanding of how ground-level ozone is formed and to determine the sources of fine particles. The measurement of PRD VOCs was a joint effort by the College of Environmental Sciences (CES) of Peking University (PKU); the Research Center for Environmental Changes of Academia Sinica (RCEC), Taiwan; and the De-15
partment of Chemistry of National Central University, Taiwan. Herein we present the data on VOC distribution and speciation obtained at seven PRD sites and we discuss their potential photochemical impacts. We explored the contributions of various VOC sources by analyzing correlations between VOC species as well as the co-variations between VOC species and other gaseous pollutants.
20
2 Field measurements
2.1 Sampling sites
We sampled VOCs at seven sites in the PRD during October and November, 2004 (Fig. 1). Two of them – Guangzhou (GZ) and Xinken (XK) – were intensive sites, at which three daily whole air sample (WAS) canisters were collected from 4 October to 3 25
ACPD
7, 14707–14745, 2007VOCs measurements in Pearl River Delta
Y. Liu et al. Title Page Abstract Introduction Conclusions References Tables Figures ◭ ◮ ◭ ◮ Back Close Full Screen / Esc
Printer-friendly Version Interactive Discussion
EGU
and SO2, at the intensive sites. The GZ and XK sites were thought to be representative of a major metropolitan emission site and a receptor site, respectively. We collected VOC samples at the other five sites at the end of October. These five sites were Conghua (CH), Huizhou (HZ), Foshan (FS), Zhongshan (ZS), and Dongguan (DG).
Guangzhou is situated at the coast of the South China Sea (21∼23◦N) and
experi-5
ences a typical sub-tropical climate. The GZ site is located in the downtown are of the city. We collected canister samples at the roof of a 17-floor building (about 55 m above ground). Xinken lies in a less populated coastal area; it is a rural site located ∼50 km to the southeast of the city center. Ambient air was drawn at the third floor platform of a building (about 10 m above ground). CH is a rural site and HZ is a suburban one, 10
and both are located upwind of the PRD region. We chose DG to examine industrial emissions. FS and ZS, like GZ, are urban sites.
During the PRD air quality monitoring campaign of 2004, abundant sunshine, mild temperature and breeze, and no precipitation characterized the weather. Under the influence of a high-pressure system and stagnant conditions, the boundary layer height 15
was generally within 1 km. At GZ, a northerly wind prevailed (mainly between NNW and NNE) and weakened during the dayime. At XK, a northeasterly wind was dominant (often between N and NE) in the morning, and a sea breeze (a SE or ESE air stream) was observed in late afternoon.
2.2 Sampling methods 20
We collected WAS in fused silica-lined stainless steel canisters (2 L, 3.2 L, or 6 L). An ozone scrubber (Na2SO3 trap) was installed in the sample line to remove ozone, and a passive capillary (calibrated in advance) was connected to the canister to keep the sampling air flow rate constant.
Each day from 4 October to 3 November 2004, routine samples were collected for 25
60 min at 05:30, 07:30, and 14:00 in GZ and at 07:30 and 14:00 in XK. The samples to examine diurnal variation were taken every 2 h for 30 min from 06:00 to 22:00 at GZ and XK on 9 October, 21 October, and 3 November, 2004. The samples at CH, HZ,
ACPD
7, 14707–14745, 2007VOCs measurements in Pearl River Delta
Y. Liu et al. Title Page Abstract Introduction Conclusions References Tables Figures ◭ ◮ ◭ ◮ Back Close Full Screen / Esc
Printer-friendly Version Interactive Discussion
EGU
FS, and ZS were drawn for 60 min at 08:00 and 17:00 on 20–22 October of 2004. Air samples were collected for 60 min at 08:30 and 16:30 at DG on 3–4 November of 2004. 2.3 Quantification of VOC species
The analysis of the canister samples was conducted in a laboratory at PKU. Up to 134 species of VOCs were detectable using a cryogenic pre-concentrator (Entech In-5
strument 7100A, SimiValley, CA) and a gas chromatograph (Hewlett Packard, 6890) equipped with two columns and two detectors (see detailed description in Liu et al., 2005). The C2–C4 alkanes and alkenes were separated on a non-polar capillary col-umn (HP-1, 50 m×0.32 mmID×1.05 µm, J&W Scientific) and quantified with a flame ionization detector (FID). The C5–C12 hydrocarbons were separated on a semi-polar 10
column (DB-624, 60 m×0.32 mmID×1.8 µm, J&W Scientific) and quantified uisng a quadrupole mass spectrometer (MS, Hewlett Packard 5973), which was operated in Selected Ion Mode (SIM) with a maximum of six ions being monitored for each time window.
First, ambient air samples and internal standards were pumped into the pre-15
concentrator, which has 3-stage cryotraps (Module 1∼3). VOC compounds were ini-tially trapped cryogenically on glass beads of Module 1 at −180◦C by liquid nitrogen; then they were recovered by desorbing at 20◦C to leave most of the liquid H
2O behind
in the first trap. The second cryotrap, which contains Tenax, was cooled to −30◦C,
which allows trapping of VOCs while letting CO2pass through. From Module 2, VOCs 20
were backflushed at 180◦C then focused again at −180◦C in the Module 3 trap. The
Module 3 trap then was rapidly heated to 60∼70◦C in 30 s. Helium was used as the
purge gas for the cryogenic pre-concentrator and the carrier gas for the GC. Column HP-1 was initially held at −50◦C for 3 min, then was raised to 164◦C at a rate of 6◦C/min;
then to 200◦C at a rate of 14◦C/min, and finally was held for 0.5 min. Column DB-624
25
was programmed to move from 30◦C to 180◦C at a rate of 6◦C/min and then was held
for 5 min at 180◦C.
ACPD
7, 14707–14745, 2007VOCs measurements in Pearl River Delta
Y. Liu et al. Title Page Abstract Introduction Conclusions References Tables Figures ◭ ◮ ◭ ◮ Back Close Full Screen / Esc
Printer-friendly Version Interactive Discussion
EGU
quantified using a certificated standard of VOC mixture in ambient concentration (pro-vided by the Environmental Technology Center, Canada). We performed calibrations at five concentrations from 0.1 to 25 ppbv for each compound before sample analysis. Correlation coefficients, which ranged from 0.996 to 1.000, showed that integral areas of peaks were proportional to concentrations of target compounds. The definition of 5
the method detection limit (MDL) for each compound is given in EPA TO-15, and the MDL for all measured VOC species ranged from 0.009 to 0.057 ppbv. The response of the instrument to VOCs was calibrated after every eight samples using standard runs of a calibration gas with ambient concentrations.
2.4 Inte-comparison experiment 10
To ensure the quality of the data, we conducted measurement comparison exercises for both standard mixtures and ambient samples. Two planned experiments were involved: 1) analysis at PKU of a known standard gas (provided by D. R. Blake’s group from the Department of Chemistry, University of California at Irvine (UCI)); and 2) a blind intercomparison of WAS results measured separately by PKU and RCEC.
15
Table 2 shows the measurements made at PKU for 55 NMHC species in standard gas obtained from UCI; each point represents one species, and error bars were com-puted from over seven replicate measurements. The correlation between measured concentrations analyzed at the PKU lab and the reference values were good (R2=0.96), and the averaged slope was 1.09±0.04. The measured concentrations of alkanes 20
were very close to their reference values, and the relative standard deviation ranged from 0.9% to 9.6%. The relative errors of n-butane, i-butane, n-pentane, 2-methyl pen-tane, and 2-mehtyl hexane were below 5%; for >C7 alkanes the relative errors were usually between 5.7% and 9.9%. The deviations of 1-butene/i-butene, trans-2-butene, 1-pentene, and 2-methyl-1-butene were 4.5%, 9.1%, 5.9%, and 9.5%, respectively. For 25
isoprene and α-pinene, the deviations from the reference values were relatively larger, reaching 10.7% and 13.4%, respectively. The averaged deviations of aromatics were about 10%. Several scattered points, such as those of cyclopentene, that deviated
ACPD
7, 14707–14745, 2007VOCs measurements in Pearl River Delta
Y. Liu et al. Title Page Abstract Introduction Conclusions References Tables Figures ◭ ◮ ◭ ◮ Back Close Full Screen / Esc
Printer-friendly Version Interactive Discussion
EGU
from the 1:1 dashed line in Fig. 2, indicate the difference of the standards used at PKU and RCEC lab to calibrate the NMHC species.
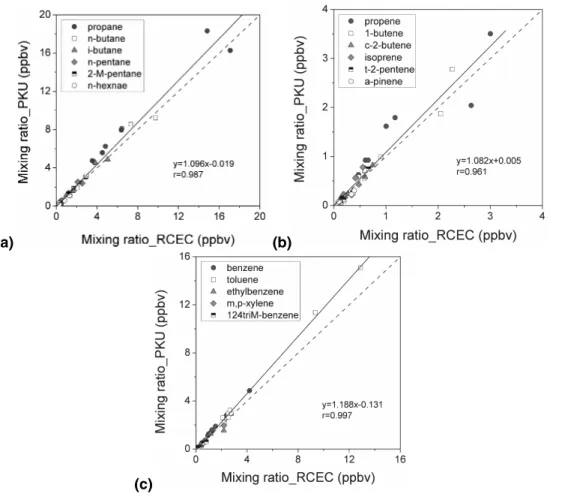
Both PKU and RCEC measured 50 VOC species from the same 16 ambient canisters samples. Figure 3 shows the results for some of the NMHC compounds. For most of the alkanes, the slopes of the linear regression for PKU versus RCEC measurements 5
fell between 0.87 and 1.11, with R2values over 0.9. For reactive alkene and aromatics compounds, including butenes, cis-2-pentene, 3-methyl-1-butene, benzene, toluene, xylenes, and trimethylbenzene, the measured mixing ratios calculated by the two labs also agreed well within the combined uncertainties for each system. However, the average α-pinene concentration measured at PKU was about 30% lower than that 10
from RCEC lab.
3 Results and discussion
3.1 Mixing ratios of VOC species at Guangzhou and Xinken
Figure 4 shows the averages of the total quantified PRD VOC mixing ratios and the relative contributions from the major VOC groups. The highest total VOC mixing ratio 15
was measured at DG (an industrial area), followed by the major urban site GZ. The levels at XK, FS, and ZS were quite similar to each other. All three sites lie downwind of industrial areas and/or major urban centers. The two lowest VOC values were recorded in CH and HZ, which lie upwind of the major cities.
Figure 4 also shows that alkanes constituted the largest group of VOCs at six (CH, 20
HZ, GZ, FS, ZS, and XK) of the seven sites, accounting for over 40% of the total. In contrast, exceptionally high values of aromatics (about 52% of the total VOCs) charac-terized DG, the industrial site. The DG aromatics likely resulted from emissions from the plants associated with textiles, furniture manufacturing, shoemaking, printing, and plastics. XK lies downwind of DG; consequently, it had the second highest faction of 25
ACPD
7, 14707–14745, 2007VOCs measurements in Pearl River Delta
Y. Liu et al. Title Page Abstract Introduction Conclusions References Tables Figures ◭ ◮ ◭ ◮ Back Close Full Screen / Esc
Printer-friendly Version Interactive Discussion
EGU
Table 2 summarizes the average concentrations and variations of 54 VOCs at GZ and XK, and Table 3 lists the 10 most abundant species observed at these two sites compared with results from a previous studies in Hong Kong and other Chinese cities (Barletta et al. 2005; Guo et al. 2006). In general, the PRD VOC mixing ratios fell within the ranges reported for other Chinese cities. A pronounced similarity existed between 5
XK site and Hong Kong’s Tai O site, a coastal site at the southern tip of the PRD region. Large fractions aromatic compounds, especially toluene, were observed at both sites. And XK and Tai O had similar levels of light alkanes as well. Both sites lie downwind from industrial sources of the PRD region, which might explain the similarities.
In contrast, GZ had the highest concentration of propane, likely due to the 10
widespread domestic and vehicular use of LPG. High levels of acetylene, toluene, ethy-lene, and ethane at this site probably originated from several anthropogenic sources such as vehicle exhaust, petrochemical industries, and industrial uses of solvents. Vehicular emissions were clearly identifiable from the significant levels of isobutane, isopentane, and benzene. Finally, CO levels at GZ were about 40% and 65% higher 15
than those observed at XK and Tai O, respectively. 3.2 Time series of VOCs at Guangzhou and Xinken
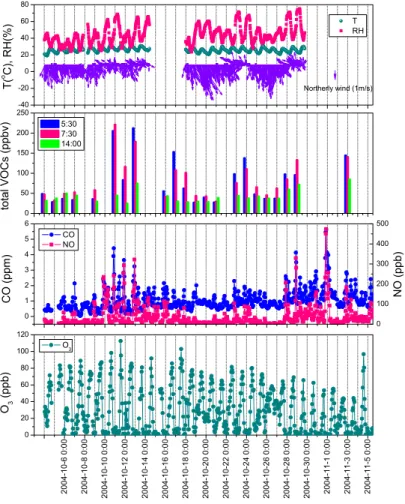
Figure 5 displays the time series of NO, CO, O3, and VOCs together with meteorologi-cal parameters observed at the GZ site. It clearly shows two major pollution episodes characterized by significantly elevated NO and CO values. The first episode occurred 20
during 11–13 October and the second one between 28 October and 1 November. The highest hourly averages of VOCs were recorded during the morning hours of episode one (i.e., 05:30 and 07:30 of 11 and 13 October), when wind speed was relatively low (∼1.5 m/s) and wind direction had mostly switched from northeast or northwest to south or southeast. Those VOC values are about 5∼7 times higher than the typical 25
values. We also found some elevated VOC levels during the second pollution episode. In contrast, other observed VOC enhancements (e.g., 17 and 24 October) were not as-sociated with highly elevated NO and CO. This suggests that the observed high levels
ACPD
7, 14707–14745, 2007VOCs measurements in Pearl River Delta
Y. Liu et al. Title Page Abstract Introduction Conclusions References Tables Figures ◭ ◮ ◭ ◮ Back Close Full Screen / Esc
Printer-friendly Version Interactive Discussion
EGU
of VOCs may be attributed to different sources or processes. In the case of O3, there
were 14 days with hourly averages exceeding 80 ppbv, which is the second grade of China’s NAAQS. However, a clear relationship between these high ozone days and either VOC levels or NO and CO levels was not evident. This may reflect the fact that ozone level is controlled by both advection and local photochemistry.
5
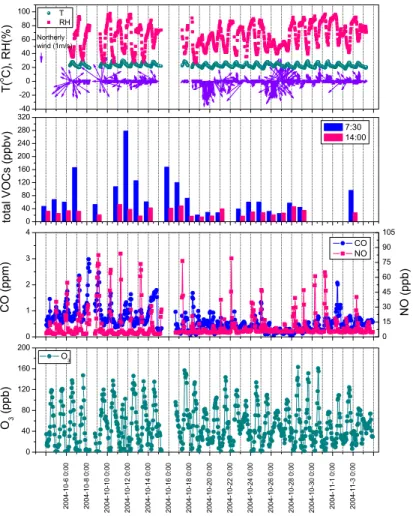
The observations for XK are displayed as a time series in Fig. 6. The NO levels were significantly lower at XK than at GZ. The XK CO levels, on average, also were lower. In addition, the correlations between NO and CO enhancements at XK were much weaker than those for GZ. Large VOC enhancement episodes, with levels more than a factor of two greater than the typical values, occurred seven times between 7 October 10
and 18 October. Total VOC level peaked at over 277 ppbv at XK on the morning of 12 October, but few corresponding changes occurred in NO and CO (Fig. 6a). The O3 levels observed in XK exceeded 80 ppbv on 23 days within the study period , and were generally higher than those seen at GZ.
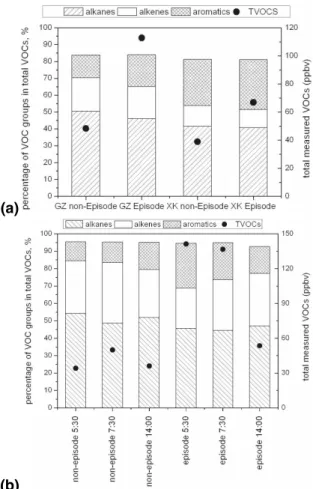
Figure 7 compares the episode days versus background (or normal) conditions at GZ 15
and XK. The average of the relative contributions from alkanes, alkenes, and aromatics remained quite constant or fluctuated within a narrow range at GZ and XK (Fig. 7a). This suggests that the high VOC levels during the episode days are likely due to mete-orological conditions favorable for accumulation of pollutants. Figure 7b illustrates that during the pollution episodes at GZ, total VOC levels were about 2–4 times higher than 20
those from non-episode days.
3.3 Diurnal variation at Guangzhou and Xinken 3.3.1 Guangzhou
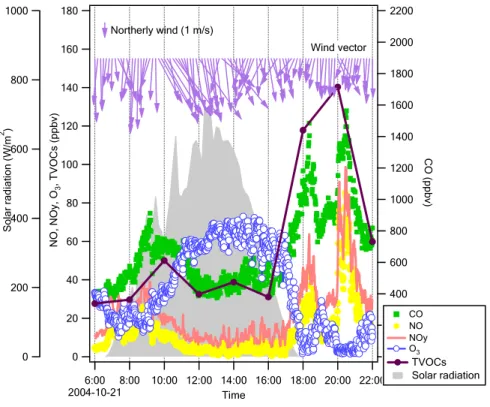
Figure 8 illustrates the diurnal patterns of primary and secondary pollutants, using data from 21 October at the GZ site as an example. The diurnal trend of total VOCs followed 25
a pattern similar to that of the primary pollutants, such as CO and NO, but it differed from that of O3. The NO levels were generally over 50% of the NOy concentrations,
ACPD
7, 14707–14745, 2007VOCs measurements in Pearl River Delta
Y. Liu et al. Title Page Abstract Introduction Conclusions References Tables Figures ◭ ◮ ◭ ◮ Back Close Full Screen / Esc
Printer-friendly Version Interactive Discussion
EGU
implying that the air mass was influenced by fresh emissions. Furthermore, the diurnal variation of the NO, NOy, CO, and total VOCs generally followed the traffic pattern of Guangzhou City. The morning and late afternoon peaks were correlated with rush hour traffic. The evening peak (∼21:00) coincided with heavy traffic because of traditional nighttime activities in the city. The boundary layer height is likely to be lower at this 5
time than in the morning and afternoon, which would also contribute to the higher level of pollutants.
3.3.2 Xinken
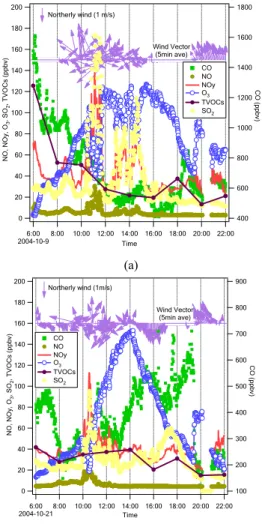
The diurnal patterns of VOC gases measured at XK were quite different from those at GZ (Fig. 9). CO and VOC tracked each other on 9 October, whereas no consistent diur-10
nal variation for either CO or VOCs occurred on 21 October. Unlike at GZ, ambient NO remained at much lower levels and constituted only a small fraction of NOy, suggesting that the air mass was more chemically aged at XK. The ambient NO and NOy spikes occurred around 10:00–11:00 a.m. on both 9 October and 21 October, causing distinct decreases in O3 due to titration. As no corresponding enhancement in CO and VOCs 15
occurred and SO2displayed a similar trend as NOy, these plumes probably originated from power plant emissions from upwind areas. The observations at XK suggest that advection transport likely has a larger impact on local air quality than do the local traffic sources.
Ozone had higher peak concentrations and much rapid variations at XK than those 20
recorded in GZ. The higher ozone levels at XK were accompanied by lower levels of VOCs and NO, indicating that the ozone did not result solely from local photochemistry. Because XK lies downwind of an urban region, the mixing ratios of VOCs in the early morning were higher than those from the same time period at GZ because of the accumulation of VOCs at night as well as transport from upstream urban areas. This 25
phenomenon appears to be more apparent during periods of northerly wind. The wind vectors at XK display a diurnal pattern; frequently, the northerly wind shifted to the south during the nighttime hours or in the early morning, and the land–sea breeze
ACPD
7, 14707–14745, 2007VOCs measurements in Pearl River Delta
Y. Liu et al. Title Page Abstract Introduction Conclusions References Tables Figures ◭ ◮ ◭ ◮ Back Close Full Screen / Esc
Printer-friendly Version Interactive Discussion
EGU
circulation had some effects on the convection and recirculation of air pollutants in the region.
3.4 VOC reactivity at Guangzhou and Xinken
OH loss rate (LOH) is frequently used as a gauge to measure the initial peroxy radical (RO2) formation rate, which might be the rate-limiting step in ozone formation in pol-5
luted air (Carter, 1994). While this approach does not account for the full atmospheric chemistry of the compounds considered, it does provide a simple approach to evaluate the relative contribution of individual VOCs to daytime photochemistry (Goldan et al., 2004). LOH is calculated as the product of the OH reaction rate coefficient (kiOH) and the ambient mixing ratio ([VOC]i) of a given compound:
10
LOH= [VOC]i × kiOH
We used Atkinson and Arey’s (2003) published kiOH.
Table 4 lists the OH loss frequencies of the main VOC groups at GZ and XK. Of the anthropogenic VOCs, reactive olefins dominated the reactivity at GZ. The alkenes at GZ represented 28.9% of the overall mixing ratios of the measured VOCs and ranged 15
from 24.7 to 305.5 ppbv, and they accounted for over 65% of the overall LOHs. In contrast, the alkanes represented 47.1% of the overall mixing ratios but only a small fraction (13%) of the overall LOHs. The contribution of aromatics to VOC reactivity was ∼20%, which was comparable with its percentage of the total mixing ratios.
At XK, the overall LOHs were lower than those at GZ, and the relative contributions 20
from aromatics and alkenes to VOCs reactivity were similar. At lower mixing ratios of total VOCs, the LOHs of alkenes exceeded those of aromatics, and with an increase of the total mixing ratios, the contributions of aromatics were enhanced. For more polluted air, the roles of aromatics were more important in photochemical processes.
Because alkenes and aromatics played a significant role in the reactivity of VOCs 25
ACPD
7, 14707–14745, 2007VOCs measurements in Pearl River Delta
Y. Liu et al. Title Page Abstract Introduction Conclusions References Tables Figures ◭ ◮ ◭ ◮ Back Close Full Screen / Esc
Printer-friendly Version Interactive Discussion
EGU
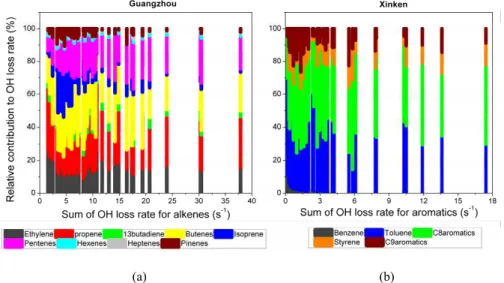
species of alkenes and aromatics at the two sites. At GZ, all alkenes were classified into groups by their carbon number (Fig. 10a). The most important contributors to the
LOHs was C4 alkenes (butenes), closely followed by propene and pentenes. Isoprene was not the dominant species as expected; this can be explained by the low emissions from plants in the urban center. In the case of clean air, the contribution of isoprene 5
and monoterpenes was slightly increased. Hexenes and heptenes played a smaller role in OH loss due to their low concentrations. Figure 10b shows the percentages of aromatic groups at XK. Together with xylenes, toluene played a predominant role in the reactivity of VOCs. Although trimethyl-benzenes had larger rate coefficients, they made a minor contribution because of their low concentrations. The contribution of benzene, 10
which was the most inert compound among the observed aromatics, decreased from the clean air to the polluted air.
3.5 Identification of VOC sources at Guangzhou and Xinken
Determining the PRD VOC sources was a rather complex task because it involved numerous sources in different cities. To assess the VOC sources for four major groups 15
– alkanes, alkene, isoprene, and aromatics – we examined correlations among the measured ambient VOC species and compared them with the known correlations from primary emission sources.
Acetylene usually is associated with sources of incomplete combustion of fossil fuel, including combustion of gasoline, diesel, and LPG in vehicles and domestic use of LPG 20
for cooking (Blake and Rowland, 1995; Goldan et al., 2000). We used methyl tert-butyl ether (MTBE), a gasoline additive used to enhance its octane rating and combustion efficiency, as an indicator for exhaust of gasoline-powered vehicles (Blake and Row-land, 1995; Chang et al., 2003). Figure 11 shows strong correlations of acetylene and ethylene with MTBE at GZ. Thus, it is reasonable to conclude that gasoline-powered 25
vehicles are mostly likely the major sources of acetylene and ethylene at GZ.
The ratios of ambient concentrations of two hydrocarbons with similar reactivity re-main constant at the value equal to their relative emission rates from sources (Goldan
ACPD
7, 14707–14745, 2007VOCs measurements in Pearl River Delta
Y. Liu et al. Title Page Abstract Introduction Conclusions References Tables Figures ◭ ◮ ◭ ◮ Back Close Full Screen / Esc
Printer-friendly Version Interactive Discussion
EGU
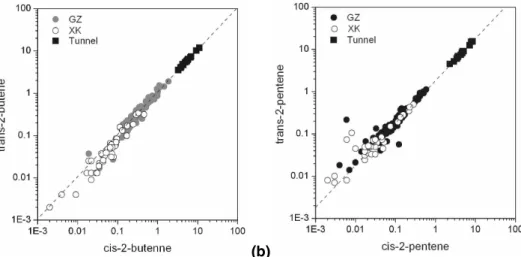
et al., 2000; Jobson et al., 2004). As mentioned above, the C4–C5 alkenes were the most reactive groups at GZ. Correlations between selected butene and pentene par-ings with similar kOH values are shown in Fig. 12, compared to the results from Pearl River Tunnel samples (Fu et al., 2005). The trans-2-butene and cis-2-butene in the atmosphere at GZ displayed excellent correlation with the tunnel samples; the slope 5
of the regression line of ambient data (1.067) is very close to that of the tunnel sam-ples (1.074). The trans/cis-2-pentenes obtained at GZ and XK correlated to each other very well, and again the regression line fit nicely with the The trans/cis-2-pentenes data points measured from the tunnel experiment (Fig. 12b). The trans/cis-2-pentenes levels obtained at XK were more scattered than that from GZ site at the lower concentrations 10
of these two species, which were likely impacted by other sources. These findings suggest that reactive 2-butenes and 2-pentenes at GZ and XK resulted primarily from vehicle exhaust emissions.
The widespread use of LPG can be another significant source of VOCs. Propane is one of the important components of LPG fuel. For LPG-powered vehicles, major 15
emissions include light alkanes (i.e., propane, isobutene, and n-butane) as well as some alkenes (e.g., butenes). The correlations of n-butane and isobutane with propane were significant (Fig. 13) at GZ with slopes of 0.48 (correlation coefficient r=0.97) and 0.28 (correlation coefficient r=0.97), respectively. The values of these two slopes agree well with those measured in Mexico City (0.458 and 0.210), where VOCs originate 20
mainly from LPG leakage (Blake and Rowland, 1995). These correlations suggest that gasoline-powered vehicles and LPG use are two important sources of light alkanes.
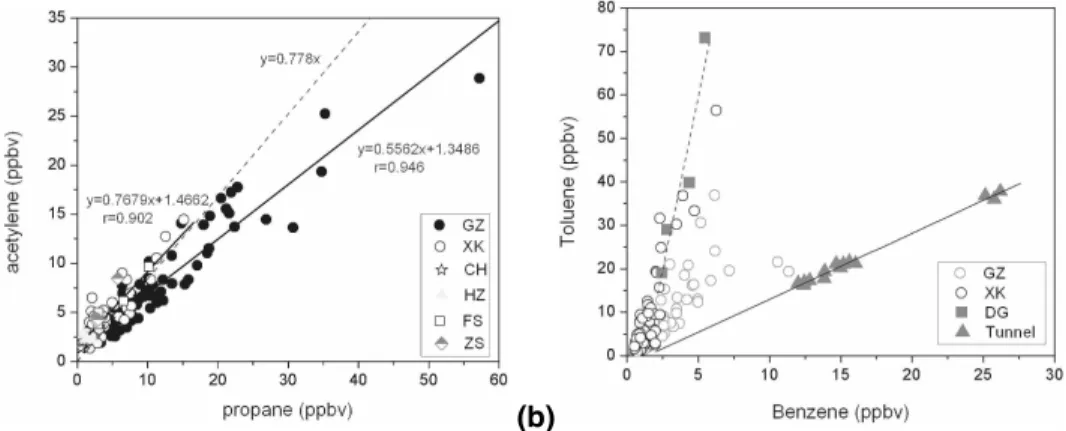
Acetylene and propane have similar photochemical lifetimes but come from different sources: gasoline-powered vehicles and LPG use, respectively. The ratio of these two compounds at a given site can be used to assess the relative importance of gasoline 25
and LPG sources (Goldan et al., 2000; Zhang et al., 2004). The ratios of acetylene and propane at different sites provide an overview on a regional scale of the relative impor-tance of these two sources to ambient alkane species levels. Figure 14a shows the plot of acetylene versus propane at six sites (GZ, XK, CH, HZ, FS, and ZS). The ratios
ACPD
7, 14707–14745, 2007VOCs measurements in Pearl River Delta
Y. Liu et al. Title Page Abstract Introduction Conclusions References Tables Figures ◭ ◮ ◭ ◮ Back Close Full Screen / Esc
Printer-friendly Version Interactive Discussion
EGU
measured at XK, FS, and ZS agreed well with those reported by Seila et al. (1989) for 39 urban locations in the U.S. (dashed line in Fig. 14). XK, FS, and ZS had a ratio of acetylene to propane that characterizes an area mostly influenced by vehicle exhaust emissions. The regression line of the GZ data diverged slightly from the dashed line, and the slope of the acetylene versus propane (0.556) regression at GZ was smaller 5
than that measured in the mobile source samples. These findings imply that LPG leak-age contributed more to ambient VOCs at GZ than at the other sites, probably due to the higher percentage of LPG used for residential energy and for public transportation in Guangzhou City.
The major source of benzene is vehicular emissions, whereas toluene is associated 10
with industrial emissions, solvent and fuel storage, and vehicle exhaust (Bravo et al., 2002; Wang et al., 2002; Na et al., 2003). Toluene was the most abundant species of VOCs observed in industrial areas of the PRD; it is emitted directly from shoemaking, printing, leather manufacturing, furniture making, coating and chemical bonding agent production, and other chemicals plants (He et al., 2002; Chan et al., 2006). In this study 15
we used the toluene/benzene ratio as a tool to evaluate the relative importance of ve-hicular and industrial emissions on a regional basis. Figure 14b shows the correlations between toluene and benzene at GZ, XK, and DG compared with those measured from tunnel samples in previous studies (Fu, 2005; Fu et al., 2005). The slopes of toluene versus benzene at XK and DG were similar; in both locales shoemaking is a major in-20
dustry housed in widespread factories. The higher toluene levels at XK were impacted by the additional input of industrial emissions from DG that were advected to XK from DG. The GZ data fell between the linear regression lines of the tunnel and DG data, suggesting that ambient toluene at GZ was affected by both automotive and industrial sources.
25
Isoprene is one of the most reactive hydrocarbon species and is used as a tracer for biogenic emissions. Vehicular exhaust also is a source of isoprene in cities (Borbon et al., 2001). We found a good correlation (r=0.91) between isoprene and 1,3-butadiene in the Pearl River tunnel (Fig. 15). However, the mixing ratios of ambient isoprene did
ACPD
7, 14707–14745, 2007VOCs measurements in Pearl River Delta
Y. Liu et al. Title Page Abstract Introduction Conclusions References Tables Figures ◭ ◮ ◭ ◮ Back Close Full Screen / Esc
Printer-friendly Version Interactive Discussion
EGU
not correlate well with 1,3-butadiene measurement from the GZ site (r=0.51). There-fore, we attribute ambient isoprene at GZ to biogenic sources.
4 Conclusions
Mixing ratios and chemical speciation of VOCs were measured intensively at GZ and XK as well as at five more sites in the 2004 Air Quality Monitoring Campaign in the PRD. 5
We quantified up to 134 VOCs species, and the total VOC levels varied from 10 ppbv to over 200 ppbv. GZ had a very high level of propane, whereas Xinken, the suburban site, had high mixing ratios of aromatics. The chemical compositions differed greatly among the seven sites, reflecting the heterogeneous distribution of VOC sources in the region.
10
We used the OH loss frequency to assess the chemical reactivity of VOC species. Reactive alkenes and aromatics influenced the VOC reactivity at GZ and XK, respec-tively, whereas alkanes, which constituted the largest portion (>45%) of overall VOC mixing ratios, comprised merely <15% of the overall OH loss rate. At GZ, butenes showed the greatest relative contribution, closely followed by propene and pentanes; 15
the heavier alkenes with low mixing ratios accounted for a small faction of total VOC reactivity. At XK, toluene and C8 reactive aromatics made the largest contribution to the OH loss rate.
Using correlations among VOC compounds, we evaluated the relative importance of local emissions of VOCs at different sites. We attributed the ambient acetylene, 20
ethylene, and other light alkenes at GZ to the local emissions from gasoline-powered vehicles. The high level of propane originated mostly from vehicles that consumed LPG fuel. Aromatic species at GZ were influenced by on-road vehicle emissions, industrial solvent use, and fuel evaporation. Due to the limited data about the compositions of LPG at GZ, we could not quantify the contribution of LPG exhaust and its leakage. The 25
toluene/benzene ratio showed that VOCs were affected by emissions from solvent us-age, fuel storus-age, and industrial emission. Before we draw a clear conclusion, however,
ACPD
7, 14707–14745, 2007VOCs measurements in Pearl River Delta
Y. Liu et al. Title Page Abstract Introduction Conclusions References Tables Figures ◭ ◮ ◭ ◮ Back Close Full Screen / Esc
Printer-friendly Version Interactive Discussion
EGU
source profiles of paint, gasoline vapor, and industrial emissions should be investigated carefully.
In comparison with the GZ site, the VOC sources that influence XK are more com-plex: The local emissions (from ships, biomass burning, and power plants) are coupled with transport of VOCs from cities (e.g., GuangZhou, DongGuan, and Hong Kong) de-5
pending on prevailing wind. For example, while the reactive butenes and pentenes at XK were primarily from local emissions, the aromatics at XK did not originate solely from local emission and likely were impacted by transport from the upwind industrial area of DG. Thus, controlling ozone levels at XK should not be confined soley to man-agement of local emissions. Detailed investigation at the site (e.g., analysis of the VOC 10
variation with wind direction) will be necessary for more reliable source identification of ambient VOCs.
Acknowledgements. This work was supported by the China National Natural Foundation
(project number 40575059) and the National Basic Research Program of China (973) (project number 2002CB410801). G. Chen’s participation in this work was supported by NASA’s
Tro-15
pospheric Chemistry Program. The authors would like to thank the students from RCEC, NCU, and PKU: C.-H. Lai and C.-H. Wang for their continuous VOC measurements; Z.-M. Luo and Z.-Y. Yu for their NOx, CO, and O3 measurements; and H. Su for his helpful discussion of the
NOxand HONO data.
References 20
Atkinson, R. and Arey, J.: Atmospheric degradation of volatile organic compounds, Chem. Rev., 103(12), 4605–4638, 2003.
Barletta, B., Meinardi, S., Rowland, F. S., Chan, C. Y., Wang, X. M., Zou, S. C., Chan, L. Y., and Blake, D. R.: Volatile organic compounds in 43 Chinese cities, Atmos. Environ., 39(32), 5979–5990, 2005.
25
Blake, D. R. and Rowland, F. S.: Urban leakage of liquefied petroleum gas and its impact on Mexico-City air quality, Science, 269(5226), 953–956, 1995.
ACPD
7, 14707–14745, 2007VOCs measurements in Pearl River Delta
Y. Liu et al. Title Page Abstract Introduction Conclusions References Tables Figures ◭ ◮ ◭ ◮ Back Close Full Screen / Esc
Printer-friendly Version Interactive Discussion
EGU
Borbon, A., Fontaine, H., Veillerot, M., Locoge, N., Galloo, J. C., and Guillermo, R.: An in-vestigation into the traffic-related fraction of isoprene at an urban location, Atmos. Environ., 35(22), 3749–3760, 2001.
Bravo, H., Sosa, R., Sanchez, P., Bueno, E., and Gonzalez, L.: Concentrations of benzene and toluene in the atmosphere of the Southwestern area at the Mexico City Metropolitan Zone,
5
Atmos. Environ., 36(23), 3843–3849, 2002.
Carter, W. P. L.: Development of ozone reactivity scales for volatile organic-compounds, J. Air Waste Manage. Assoc., 44(7), 881–899, 1994.
Chameides, W. L., Lindsay, R. W., Richardson, J. L., and Kians, C. S.: The role of biogenic hydrocarbons in urban photochemical smog: Atlanta as a case study, Science, 241, 1473–
10
1475, 1988.
Chan, L. Y., Chu, K. W., Zou, S. C., Chan, C. Y., Wang, X. M., Barletta, B., Blake, D. R., Guo, H., and Tsai, W. Y.: Characteristics of nonmethane hydrocarbons (NMHCs) in industrial, industrial-urban, and industrial-suburban atmospheres of the Pearl River Delta (PRD) region of south China, J. Geophys. Res.-Atmos., 111(D11), D11304, doi:10.1029/2005JD006481,
15
2006.
Chang, C. C., Lo, S. J., Lo, J. G., and Wang, J. L.: Analysis of methyl tert-butyl ether in the at-mosphere and implications as an exclusive indicator of automobile exhaust, Atmos. Environ., 37(34), 4747–4755, 2003.
Chen, T. Y., Simpson, I. J., Blake, D. R., and Rowland, F. S.: Impact of the leakage of liquefied
20
petroleum gas (LPG) on Santiago air quality, Geophys. Res. Lett., 28(11), 2193–2196, 2001. de Gouw, J. A., Middlebrook, A. M., Warneke, C., Goldan, P. D., Kuster, W. C., Roberts, J. M.,
Fehsenfeld, F. C., Worsnop, D. R., Canagaratna, M. R., Pszenny, A. A. P., Keene, W. C., Marchewka, M., Bertman, S. B., and Bates, T. S.: Budget of organic carbon in a polluted atmosphere: Results from the New England Air Quality Study in 2002, J. Geophys.
Res.-25
Atmos., 110(D16), D16305, doi:10.1029/2004JD005623, 2005.
Fu, L. L.: The Emission Characteristics for Anthropogenic VOCs Sources in China (in Chinese). Thesis for Master degree of College of Environmental Science. Peking University. Beijing, China, 2005.
Fu, L. L., Shao, M., Liu, Y., Lu, S. H., and Tang, D. G.: Tunnel experimental study on the
30
emission factors of volatile organic compounds (VOCs) from vehicles (in Chinese), Acta Scientiae Circumstantiae, 25(7), 879–885, 2005.
ACPD
7, 14707–14745, 2007VOCs measurements in Pearl River Delta
Y. Liu et al. Title Page Abstract Introduction Conclusions References Tables Figures ◭ ◮ ◭ ◮ Back Close Full Screen / Esc
Printer-friendly Version Interactive Discussion
EGU
Meagher, J.: Nonmethane hydrocarbon and oxy hydrocarbon measurements during the 2002 New England Air Quality Study, J. Geophys. Res.-Atmos., 109(D21), D21309, doi:10.1029/2003JD004455, 2004.
Goldan, P. D., Parrish, D. D., Kuster, W. C., Trainer, M., McKeen, S. A., Holloway, J., Job-son, B. T., Sueper, D. T., and Fehsenfeld, F. C.: Airborne measurements of isoprene, CO,
5
and anthropogenic hydrocarbons and their implications, J. Geophys. Res.-Atmos., 105(D7), 9091–9105, 2000.
Guo, H., Wang, T., Blake, D. R., Simpson, I. J. Kwok,, Y. H., and Li, Y. S.: Regional and local contributions to ambient non-methane volatile organic compounds at a polluted rural/coastal site in Pearl River Delta, China, Atmos. Environ., 40(13), 2345–2359, 2006.
10
He, J., Chen, H. X., Liu, X. X., Hu, J. H., Li, Q. L., and He, F. Q.: The analysis of various volatile solvents used in different industries in Zhongshan (in Chinese), South China, J. Preventive Medicine, 28(6), 26–27, 2002.
Jobson, B. T., Berkowitz, C. M., Kuster, W. C., Goldan, P. D., Williams, E. J., Fesenfeld, F. C., Apel, E. C., Karl, T., Lonneman, W. A. and Riemer, D.: Hydrocarbon source
signa-15
tures in Houston, Texas: Influence of the petrochemical industry, J. Geophys. Res.-Atmos., 109(D24), D24305, doi:10.1029/2004JD004887, 2004.
Li, G. Y., Tang, X. L., BI, X. H., Yi, F., Sheng, G. Y., and Fu, J. M.: Composition and mutagenicity of particle sized fraction from urban particulate matter in Guangzhou City, Acta Scientiae Circumstantiae, 25(3), 319–323, 2005.
20
Liu, Y., Shao, M., Zhang, J., Fu, L. L., and Lu, S. H.: Distributions and source apportionment of ambient volatile organic compounds in Beijing city, China. Journal of Environmental Sci-ence And Health Part A-Toxic/Hazardous Substances & Environmental Engineering, 40(10), 1843–1860, 2005.
Na, K., Kim, Y. P., and Moon, K. C.: Diurnal characteristics of volatile organic compounds in the
25
Seoul atmosphere, Atmos. Environ., 37(6), 733–742, 2003.
National Bureau of Statistics. China yearbook of statistics. Beijing, China statistics press, 2004. Ryerson, T. B., Trainer, M., Angevine, W. M., Brock, C. A., Dissly, R. W., Fehsenfeld, F. C., Frost,
G. J., Goldan, P. D., Holloway, J. S., Hubler, G., Jakoubek, R. O., Kuster, W. C., Neuman, J. A., Nicks, D. K., Parrish, D. D., Roberts, J. M., and Sueper, D. T.: Effect of petrochemical
in-30
dustrial emissions of reactive alkenes and NOx on tropospheric ozone formation in Houston, Texas, J. Geophys. Res.-Atmos., 108(D8), 4249, doi:10.1029/2002JD003070, 2003.
hydro-ACPD
7, 14707–14745, 2007VOCs measurements in Pearl River Delta
Y. Liu et al. Title Page Abstract Introduction Conclusions References Tables Figures ◭ ◮ ◭ ◮ Back Close Full Screen / Esc
Printer-friendly Version Interactive Discussion
EGU
carbons in 39 U.S. cities, from 1984 through 1986. Rep. EPA/600/S3-89/059, U.S. Environ. Prot. Agency, Washington, D.C., 1989.
Shao, M., Zhao, M. P., Zhang, Y. H., Peng, L. X., and Li, J. L.: Biogenic VOCs emissions and its impact on ozone formation in major cities of China. Journal Of Environmental Science And Health Part A-Toxic/Hazardous Substances & Environmental Engineering, 35(10), 1941–
5
1950, 2000.
Wang, T., Poon, C. N., Kwok, Y. H., and Li, Y. S.: Characterizing the temporal variability and emission patterns of pollution plumes in the Pearl River Delta of China, Atmos. Environ., 37(25), 3539–3550, 2003.
Wang T., Guo, H., Blake, D. R., Kwok, Y. H., Simpson, I. J., and Li, Y. S.: Measurements of Trace
10
Gases in the Inflow of South China Sea Background Air and Outflow of Regional Pollution at Tai O, Southern China, J. Atmos. Chem., 52, 295–317, 2005.
Wang, X. M., Sheng, G. Y., Fu, J. M., Chan, C. Y., Lee, S. G., Chan, L. Y. and Wang, Z. S.: Urban roadside aromatic hydrocarbons in three cities of the Pearl River Delta, People’s Republic of China, Atmos. Environ., 36(33), 5141–5148, 2002.
15
Warneke, C., de Gouw, J. A., Goldan, P. D., Kuster, W. C., Williams, E. J., Lerner, B. M., Jakoubek, R., Brown, S. S., Stark, H., Aldener, M., Ravishankara, A. R., Roberts, J. M., Marchewka, M., Bertman, S., Sueper, D. T., McKeen, S. A., Meagher, J. F., and Fehsenfeld, F. C.: Comparison of daytime and nighttime oxidation of biogenic and anthropogenic VOCs along the New England coast in summer during New England Air Quality Study 2002, J.
20
Geophys. Res.-Atmos, 109(D10), D10309, doi:10.1029/2003JD004424, 2004.
Zhang, J., Chameides, W. L., Wang, T., and Kiang, C. S.: Final Report: HongKong and the Pearl River Delta Pilot Air Monitoring Project: Pilot study on the use of atmospheric measurements to manage air quality in Hong Kong and the Pearl River Delta Project 1: Ground-level Ozone Pollution in Hong Kong, Civic Exchange, Hong Kong , 2004.
25
Zhang, Y. H., Shao, K. S., and Tang, X. Y.: The study of urban photochemical smog pollution in China. Acta Scientiarum Natrualium, Universitatis Pekinenesis, 24(2–3), 392–400, 1998.
ACPD
7, 14707–14745, 2007VOCs measurements in Pearl River Delta
Y. Liu et al. Title Page Abstract Introduction Conclusions References Tables Figures ◭ ◮ ◭ ◮ Back Close Full Screen / Esc
Printer-friendly Version Interactive Discussion
EGU
Table 1.VOC species quantified by the GC-MS/FID system.
Alkanes Alkenes Aromatics Halides
Ethane Ethylene Benzene Chloromethane
Porpane Propene Toluene Bromomethane
Isobutnae 1-Butene/Isobutene Ethylbenzene Chloroethane
n-Butane 1,3-Butadiene m/p-Xylene Bromoethane
2,2-Dimethylpropane trans-2-Butene o-Xylene 1,1-Dichloromethane
2-Methylbutane cis-2-Butene Styrene 1,1-Dichloroethane
Pentane 3-Methyl-1-butene Isopropylbenzene Chloroform
2,2-Dimethylbutane 1-Pentene n-Propylbenzene 1,1,1-Trichloroethane
2,3-Dimethylbutane 2-Methyl-1-butene 3-Ethyltoluene Carbontetrachloroide
2-Methylpentane trans-2-Pentene 4-Ethyltoluene 1,2-Dichloropropane
3-Methylpentane Isoprene 1,3,5-Trimethylbenzene Dibromomethane
n-Hexane cis-2-Pentene 2-Ethyltoluene Bromodichloromethane
2,2-Dimethylpentane 2-Methyl-2-butene tert-Butylbenzene 1,1,2-Trichloroethane 2,4-Dimethylpentane 4-Methyl-1-pentene 1,2,4-Trimethylbenzene Dibromochloromethane Methylcyclopentane 3-Methyl-1-pentene iso-Butylbenzene 1,2-Dibromoethane
2-Methylhexane Cyclopentene sec-Butylbenzene 1,4-Dicrorobutane
Cyclohexane trans-4-Methyl-2-pentene p-Cymene 1,1,2,2-Tetrachloroethane
2,3-Dimethylpentane cis-4-Methyl-2-pentene 1,2,3-Trimethylbenzene 1,1-dichloroethylene 2,2-Dimethylhexane 2-Methyl-1-pentene 1,3-Diethylbenzene cis-1,2-dichloro-ethene
n-Heptane 2-Ethyl-1-butene 1,4-Diethylbenzene Trichloroethylene
2,5-Dimethylhexane trans-2-Hexene n-Butylbenzene tans-1,3-Dichloropropene
Methylcyclohexane trans-3-Methyl-2-pentene 1,2-Diethylbenzene Tetrachloroethylene
2,3,4-Trimethylpentane cis-2-Hexene Indan
2-Methylheptane cis-3-Methyl-2-pentene
4-Methylheptane 1-Methylcyclopentene Alkynes Chlorinated aromatics
3-Methylheptane Cyclohexene Acetylene Chlorobenzene
c-1,3-Dimethylcyclohexane 1-Heptene Propyne 1,3-Dichlorobenzene
t-1,4-Dimethylcyclohexane trans-2-Heptene 1-Butyne 1,4-Dichlorobenzene
Octane cis-2-Heptene Benzylchloride
t-1,2-Dimethylcyclohexane 1-Methylcyclohexene Freons 1,2-Dichlorobenzene
c-1,4/1,3-Dimethylcyclohexane 1-Octene Freon12
c-1,2-Dimethylcyclohexane trans-2-Octene Freon22 Others
n-Nonane 1-Nonene Freon114 Acetonitrile
3,6-Dimethyloctane a-Pinene Freon11 MTBE
n-Decane Camphene Freon113
Dodecane b-Pinene
Limonene 1-Undecene
ACPD
7, 14707–14745, 2007VOCs measurements in Pearl River Delta
Y. Liu et al. Title Page Abstract Introduction Conclusions References Tables Figures ◭ ◮ ◭ ◮ Back Close Full Screen / Esc
Printer-friendly Version Interactive Discussion
EGU
Table 2. The method detection limits (MDL; ppbv) and average mixing ratios of 54 NMVOCs measured at Guangzhou (GZ) and Xinken (XK).
GZ GZ XK XK
Species MDL (ppbv) range average ± s.d. range average ± s.d. Ethane 0.014 1.35–25.80 5.58±3.34 1.54–10.15 3.07±1.26 propane 0.010 3.16–57.24 10.35±8.53 0.99–15.14 3.51±2.90 Isobutane 0.016 0.70–17.09 2.93±2.57 0.21–6.26 1.26±1.23 n-Butane 0.035 1.19–28.30 5.07±4.42 0.38–13.51 2.71±2.79 2-Methylbutane 0.032 0.55–12.15 2.62±2.24 0.23–7.91 1.45±1.42 Pentane 0.011 0.21–4.67 1.19±1.07 0.09–5.98 1.10±1.25 2,2-Dimethylbutane 0.024 0.01–0.38 0.09±0.07 n.a.–0.38 0.07±0.07 2,3-Dimethylbutane 0.015 0.05–1.06 0.26±0.24 0.01–1.09 0.19±0.20 2-Methylpentane 0.019 0.18–4.44 1.03±0.94 0.07–5.46 0.83±0.92 3-Methylpentane 0.016 0.08–2.80 0.67±0.64 0.03–3.76 0.61±0.69 n-Hexane 0.024 0.11–3.45 0.84±0.80 0.04–5.83 0.89±1.03 Methylcyclopentane 0.011 0.06–2.00 0.53±0.49 0.01–2.72 0.39±0.47 2-Methylhexane 0.012 0.06–2.33 0.56±0.55 0.02–4.14 0.56±0.71 Cyclohexane 0.011 0.02–1.15 0.21±0.21 n.a.–1.32 0.20±0.24 2,3-Dimethylpentane 0.010 0.03–5.28 0.92±1.19 0.02–9.30 0.79±1.34 n-Heptane 0.009 0.07–2.53 0.63±0.61 0.02–4.04 0.57±0.71 Methylcyclohexane 0.013 0.04–1.89 0.38±0.34 n.a.–1.81 0.23±0.31 2-Methylheptane 0.015 0.02–0.72 0.15±0.14 n.a.–0.78 0.10±0.13 Octane 0.009 0.03–0.86 0.18±0.15 0.02–1.09 0.15±0.20 n-Nonane 0.017 0.01–0.44 0.12±0.08 0.01–0.73 0.10±0.11 n-Decane 0.009 0.02–0.43 0.10±0.09 n.a.–1.03 0.10±0.16 Ethene 0.027 1.95–28.35 6.55±4.82 0.64–13.11 2.68±2.19 Propene 0.018 0.45–17.88 3.02±2.84 0.14–5.49 0.87±0.86 1-Butene/Isobutene 0.020 0.25–4.44 1.33±0.91 0.06–1.80 0.44±0.41 1,3-Butadiene 0.024 0.03–0.81 0.20±0.17 n.a.–0.64 0.08±0.11 trans-2-Butene 0.009 0.02–1.89 0.40±0.36 n.a.–0.34 0.06±0.08 cis-2-Butene 0.018 0.02–1.87 0.38±0.33 n.a.–0.46 0.06±0.08 3-Methyl-1-butene 0.012 n.a.–0.38 0.09±0.07 n.a.–0.16 0.03±0.03 1-Pentene 0.029 0.04–0.73 0.18±0.14 n.a.–0.52 0.09±0.10 2-Methyl-1-butene 0.026 0.02–1.08 0.27±0.23 n.a.–0.85 0.10±0.14 trans-2-Pentene 0.009 0.01–1.12 0.24±0.23 n.a.–0.50 0.07±0.11 Isoprene 0.010 n.a.–0.67 0.22±0.17 n.a.–0.80 0.17±0.15 cis-2-Pentene 0.006 n.a.–0.58 0.12±0.12 n.a.–0.28 0.04±0.06 2-Methyl-2-butene 0.013 0.01–1.35 0.24±0.29 n.a.–0.47 0.07±0.11 4-Methyl-1-pentene 0.021 0.02–0.48 0.19±0.10 n.a.–0.90 0.18±0.15 a-Pinene 0.009 n.a.–1.23 0.18±0.18 n.a.–1.18 0.17±0.22 Benzene 0.014 0.66–11.35 2.39±1.99 0.52–6.26 1.42±0.98 Toluene 0.016 0.76–36.91 7.01±7.33 0.54–56.41 8.46±9.94 Ethylbenzene 0.021 0.14–5.20 1.16±1.22 0.04–13.36 1.62±2.08 m/p-Xylene 0.024 0.17–5.19 1.46±1.42 0.03–17.67 1.94±2.95 o-Xylene 0.023 0.07–1.98 0.52±0.50 0.02–5.87 0.71±1.02 Styrene 0.008 0.01–2.30 0.20±0.37 n.a.–2.35 0.22±0.41 isopropylbenzene 0.007 0.01–0.15 0.04±0.03 n.a.–0.27 0.04±0.05 n-Propylbenzene 0.009 0.01–0.27 0.06±0.06 n.a.–0.52 0.06±0.08 3-Ethyltoluene 0.015 0.02–0.84 0.16±0.16 n.a.–1.04 0.10±0.17 4-Ethyltoluene 0.014 0.01–0.30 0.07±0.06 n.a.–0.43 0.05±0.08 1,3,5-Trimethylbenzene 0.020 0.02–0.31 0.06±0.06 n.a.–0.46 0.05±0.10 2-Ethyltoluene 0.010 0.01–0.29 0.06±0.06 n.a.–0.52 0.05±0.09 1,2,4-Trimethylbenzene 0.029 0.02–1.06 0.24±0.22 n.a.–1.81 0.18±0.32 1,2,3-Trimethylbenzene 0.012 n.a.–0.32 0.06±0.06 n.a.–0.58 0.05±0.10 1,4-Diethylbenzene 0.005 n.a.–1.58 0.10±0.21 n.a.–0.67 0.08±0.15 Chloromethane 0.020 0.80–1.56 1.18±0.21 0.79–1.64 1.15±0.22 Acetonitrile 0.039 0.11–1.57 0.66±0.29 0.31–1.26 0.66±0.18 MTBE 0.013 0.18–5.41 0.96±0.94 n.a.–3.27 0.47±0.61
ACPD
7, 14707–14745, 2007VOCs measurements in Pearl River Delta
Y. Liu et al. Title Page Abstract Introduction Conclusions References Tables Figures ◭ ◮ ◭ ◮ Back Close Full Screen / Esc
Printer-friendly Version Interactive Discussion
EGU
Table 3.The 10 most abundant species and CO (ppbv) measured at Guangzhou and at Xinken.
Guangzhou, average Xinken, coastal/ average 43 Chinese range Tai Ob, Hongkong, average
urban site suburban site citiesa rural/coastal site
Propane 10.7±8.9 Toluene 8.3±9.9 Ethane 3.7–17.0 Toluene 5.6±7.1
Acetylene 7.3±5.2 Acetylene 4.1±2.5 Acetylene 2.9–58.3 Acetylene 2.8±2.0
Toluene 7.0±7.3 Propane 3.5±2.9 Ethylene 2.1–34.8 Ethane 2.1±1.0
Ethylene 6.8±5.1 Ethane 3.0±1.3 Propane 1.5–20.8 Propane 2.0 ±2.2
Ethane 5.6±3.3 n-butane 2.7±2.8 Benzene 0.7–10.4 Ethylene 1.7±1.7
n-Butane 5.2± 4.4 Ethylene 2.7±2.2 Toluene 0.4–11.2 n-Butane 21.6±2.1
Propene 3.2±3.0 m/p-Xylene 1.9±2.9 n-Butane 0.6–14.5 Methyl chloride 0.9±0.2
i-butane 2.9±2.6 Ethylbenzene 1.6±2.1 i-Butane 0.4–4.6 Ethylbenzene 0.9
i-Pentane 2.7±2.3 i-Pentane 1.5±1.4 i-Pentane 0.3–18.8 Benzene 0.9
Benzene 2.4±1.9 Benzene 1.4±1.0 p-Xylene 0.2–10.1 i-Pentane 0.8
CO 867±552 CO 597±388 CO 525±323
a
ACPD
7, 14707–14745, 2007VOCs measurements in Pearl River Delta
Y. Liu et al. Title Page Abstract Introduction Conclusions References Tables Figures ◭ ◮ ◭ ◮ Back Close Full Screen / Esc
Printer-friendly Version Interactive Discussion
EGU
Table 4. The OH loss rate (s−1) of major VOC groups at Guangzhou and Xinken during the
campaign in 2004.
Sampling sites Alkanes Alkenes Aromatics Isoprene Guangzhou 1.9±1.5 8.8±6.8 2.9±2.7 0.5±0.4 Xinken 1.2±1.3 3.2±3.4 3.2±4.5 0.4±0.4
ACPD
7, 14707–14745, 2007VOCs measurements in Pearl River Delta
Y. Liu et al. Title Page Abstract Introduction Conclusions References Tables Figures ◭ ◮ ◭ ◮ Back Close Full Screen / Esc
Printer-friendly Version Interactive Discussion
EGU
Fig. 1. Location of sites for the 2004 Air Quality Monitoring Campaign in the Pearl River Delta (PRD). The star indicates intensive sites, and the dots indicate sites for regional distribution sampling.
ACPD
7, 14707–14745, 2007VOCs measurements in Pearl River Delta
Y. Liu et al. Title Page Abstract Introduction Conclusions References Tables Figures ◭ ◮ ◭ ◮ Back Close Full Screen / Esc
Printer-friendly Version Interactive Discussion
EGU
Fig. 2. Correlation of the measured and reference concentrations of 55 NMHCs in standard gas.
ACPD
7, 14707–14745, 2007VOCs measurements in Pearl River Delta
Y. Liu et al. Title Page Abstract Introduction Conclusions References Tables Figures ◭ ◮ ◭ ◮ Back Close Full Screen / Esc
Printer-friendly Version Interactive Discussion
EGU
(a) (b)
(c)
Fig. 3. Comparison of parallel WAS canisters between PKU and RCEC results for some (a) alkanes, (b) alkenes, and (c) aromatics.
ACPD
7, 14707–14745, 2007VOCs measurements in Pearl River Delta
Y. Liu et al. Title Page Abstract Introduction Conclusions References Tables Figures ◭ ◮ ◭ ◮ Back Close Full Screen / Esc
Printer-friendly Version Interactive Discussion
EGU
Fig. 4. Regional distribution of mixing ratio (in volume percentage) and chemical composition of VOCs at seven sites.
ACPD
7, 14707–14745, 2007VOCs measurements in Pearl River Delta
Y. Liu et al. Title Page Abstract Introduction Conclusions References Tables Figures ◭ ◮ ◭ ◮ Back Close Full Screen / Esc
Printer-friendly Version Interactive Discussion
EGU
Fig. 5. Time series of measured O3,CO, NO, total VOCs, temperature, relative humidity, wind direction, and speed at Guangzhou during the campaign.
ACPD
7, 14707–14745, 2007VOCs measurements in Pearl River Delta
Y. Liu et al. Title Page Abstract Introduction Conclusions References Tables Figures ◭ ◮ ◭ ◮ Back Close Full Screen / Esc
Printer-friendly Version Interactive Discussion
EGU
Fig. 6. Time series of measured O3, CO, NO, total VOCs, temperature, relative humidity, wind
ACPD
7, 14707–14745, 2007VOCs measurements in Pearl River Delta
Y. Liu et al. Title Page Abstract Introduction Conclusions References Tables Figures ◭ ◮ ◭ ◮ Back Close Full Screen / Esc
Printer-friendly Version Interactive Discussion
EGU
(a)
(b)
Fig. 7. (a) The average compositions and total concentration of VOCs at Guangzhou and Xinken during the first polluted episode and during non-episode days, and (b) the average composition and total concentration of VOCs at 05:30 and 07:30 at Guangzhou during the first polluted episode and during non-episode days.
ACPD
7, 14707–14745, 2007VOCs measurements in Pearl River Delta
Y. Liu et al. Title Page Abstract Introduction Conclusions References Tables Figures ◭ ◮ ◭ ◮ Back Close Full Screen / Esc
Printer-friendly Version Interactive Discussion EGU 1000 800 600 400 200 0 S o la r ra d ia tio n ( W /m 2 ) 6:00 2004-10-21 8:00 10:00 12:00 14:00 16:00 18:00 20:00 22:00 Time 2200 2000 1800 1600 1400 1200 1000 800 600 400 200 0 C O (p p b v) 180 160 140 120 100 80 60 40 20 0 N O , N O y , O3 , T VO C s (p p b v) Northerly wind (1 m/s) CO NO NOy O3 TVOCs Solar radiation Wind vector
ACPD
7, 14707–14745, 2007VOCs measurements in Pearl River Delta
Y. Liu et al. Title Page Abstract Introduction Conclusions References Tables Figures ◭ ◮ ◭ ◮ Back Close Full Screen / Esc
Printer-friendly Version Interactive Discussion EGU 200 180 160 140 120 100 80 60 40 20 0 N O , N O y, O3 , SO 2 , T V O C s (p p b v) 6:00 2004-10-98:00 10:00 12:00 14:00Time 16:00 18:00 20:00 22:00 1800 1600 1400 1200 1000 800 600 400 C O (p p b v) Northerly wind (1 m/s) Wind Vector (5min ave) CO NO NOy O3 TVOCs SO2 (a) 200 180 160 140 120 100 80 60 40 20 0 N O , N O y, O3 , SO 2 , T V O C s (p p b v ) 6:00 2004-10-21 8:00 10:00 12:00 14:00 16:00 18:00 20:00 22:00 Time 900 800 700 600 500 400 300 200 100 C O (p p b v ) Northerly wind (1m/s) Wind Vector (5min ave) CO NO NOy O3 TVOCs SO2 (b)
Fig. 9.Diurnal variations of TVOCs, CO, NO, NOy, and O3 at XK on (a) 9 October and (b) 21 October 2004.
ACPD
7, 14707–14745, 2007VOCs measurements in Pearl River Delta
Y. Liu et al. Title Page Abstract Introduction Conclusions References Tables Figures ◭ ◮ ◭ ◮ Back Close Full Screen / Esc
Printer-friendly Version Interactive Discussion
EGU
(a) (b)
ACPD
7, 14707–14745, 2007VOCs measurements in Pearl River Delta
Y. Liu et al. Title Page Abstract Introduction Conclusions References Tables Figures ◭ ◮ ◭ ◮ Back Close Full Screen / Esc
Printer-friendly Version Interactive Discussion
EGU
Fig. 11.Correlations of acetylene and ethylene with MTBE at Guangzhou. The solid line is the regression line of the dots, and the area within the dashed lines is the 95% confidence interval.
ACPD
7, 14707–14745, 2007VOCs measurements in Pearl River Delta
Y. Liu et al. Title Page Abstract Introduction Conclusions References Tables Figures ◭ ◮ ◭ ◮ Back Close Full Screen / Esc
Printer-friendly Version Interactive Discussion
EGU
(a) (b)
Fig. 12.Correlations between (a) trans-2-butene and cis-2-butene and (b) trans-2-pentene and cis-2-pentene at Guangzhou (solid dots) and Xinken (open circles) compared with Pearl River Tunnel samples (solid squares).
ACPD
7, 14707–14745, 2007VOCs measurements in Pearl River Delta
Y. Liu et al. Title Page Abstract Introduction Conclusions References Tables Figures ◭ ◮ ◭ ◮ Back Close Full Screen / Esc
Printer-friendly Version Interactive Discussion
EGU
Fig. 13. Correlations between propane and n-/iso-butane at Guangzhou. The solid line is the regression line of the dots, and the area within the dashed lines is the 95% confidence interval.
ACPD
7, 14707–14745, 2007VOCs measurements in Pearl River Delta
Y. Liu et al. Title Page Abstract Introduction Conclusions References Tables Figures ◭ ◮ ◭ ◮ Back Close Full Screen / Esc
Printer-friendly Version Interactive Discussion
EGU
(a) (b)
Fig. 14. (a)The correlation between acetylene and propane for six sites (Guangzhou (GZ), Xinken (XK), Conghua (CH), Huizhou (HZ), Foshen (FS), and Shongshan (ZS)), with a com-parison with 39 cities studied in the US (shown as the dashed line); (b) The correlation between toluene and benzene for GZ, XK, and Dongguan (DG), comparing ambient data to the Pearl River Tunnel study (solid squares). The solid and dashed lines represent the regression lines for the results from tunnel samples and ambient data at DG, respectively.
ACPD
7, 14707–14745, 2007VOCs measurements in Pearl River Delta
Y. Liu et al. Title Page Abstract Introduction Conclusions References Tables Figures ◭ ◮ ◭ ◮ Back Close Full Screen / Esc
Printer-friendly Version Interactive Discussion
EGU
Fig. 15. The correlation between ambient isoprene and 1,3-butadiene at Guangzhou, com-pared with the results from the Pearl River Tunnel study.
![[DOC] Cours Windows 2000 : comptes d'utilisateurs](data:image/gif;base64,R0lGODlhAQABAIAAAP///wAAACH5BAEAAAAALAAAAAABAAEAAAICRAEAOw==)