APPROPRIATE WATER TREATMENT
FOR THE NYANZA PROVINCE OF KENYA
by
Pragnya Y. Alekal
B.S. in Civil and Environmental Engineering University of California at Los Angeles
Submitted to the Department of Civil and Environmental Engineering in Partial Fulfillment of the Requirements for the Degree of
MASTER OF ENGINEERING IN CIVIL AND ENVIRONMENTAL ENGINEERING at the
MASSACHUSETTS INSTITUTE OF TECHNOLOGY
JUNE 2005 MASSACHUSETT
OF TECHN
© 2005 Pragnya Alekal. All rights reserved.
LIBRA
The author hereby grants MIT permission to reproduce and distribute publicly paper and electronic copies of this thesis document in whole and in part.
S INSTMTUE. OLOGY
2005
RIES
Signature of the Author
Department of Civil r d EAviroLdentaI Engineerg-May 13, 2005
Certified by
E. Eric Adams Senior Research Associate, Department of Civil and Environmental Engineering )Thesi Supervisor
Accepted by
Andrew J. Whittle Chairman, Departmental Committee on Graduate Studies
MITLibraries
Document Services Room 14-0551 77 Massachusetts Avenue Cambridge, MA 02139 Ph: 617.253.2800 Email: docs@mit.edu http://libraries.mit.edu/docsDISCLAIMER OF QUALITY
Due to the condition of the original material, there are unavoidable flaws in this reproduction. We have made every effort possible to provide you with the best copy available. If you are dissatisfied with this product and find it unusable, please contact Document Services as soon as possible.
Thank you.
The images contained in this document are of
the best quality available.
APPROPRIATE WATER TREATMENT
FOR THE NYANZA PROVINCE OF KENYA
by Pragnya Alekal
Submitted to the Department of Civil and Environmental Engineering on May 13, 2005 in partial fulfillment of the requirements
for the Degree of Master of Engineering in Civil and Environmental Engineering
ABSTRACT
In 2000 the Centers for Disease Control and Prevention (CDC) in conjunction with CARE International began working with several local non-governmental organizations (NGOs) in the Nyanza Province of Kenya to reduce the rate of waterborne diseases. In 2002, CDC partnered up with the Society for Women and AIDS in Kenya (SWAK), a local NGO, to implement safe water treatment in SWAK-affiliated communities. SWAK is seeking ways to improve and expand sales of safe water treatment products in all of its communities. The water treatment sales expansion study has two components:
" A technical component that addresses the most appropriate treatment " A business component that addresses marketing and sales of the products.
This study focuses on the technical component. Its purpose is to evaluate the most appropriate water treatment in SWAK communities in the Nyanza Province. Three water treatment products were assessed - WaterGuard@, PuR@, and an alternative naturally occurring coagulant made of seeds from the Moringa tree. WaterGuard@ is a chlorine-based disinfectant; PuR@ is a coagulant and chlorine-chlorine-based disinfectant. Both are already being marketed by SWAK. Moringa trees are indigenous to the region.
Research was conducted in the United States and Kenya from October to April 2005. Field evaluation in Nyanza during January consisted of surveys that addressed water treatment practices, and water quality tests, specifically turbidity which interferes with the effectiveness of chlorine-based disinfection. Research revealed that rainwater is the best water source, and WaterGuard@ is the best water treatment. PuR@ was hardly used, and Moringa needs to be studied further for cost-efficiency and availability. A set of recommendations were drawn up and presented to SWAK communities, based on the results. These include promotion of rainwater treatment, retreatment of water every 24-48 hours, and health education programs.
Thesis Supervisor: Dr E. Eric Adams
Acknowledgements
I would like to dedicate this thesis to all the forces that have made me possible and continually inspire me to be better. You are the reason that I am.
Special thanks to everyone who allowed me to be a part of their lives this year. Dr Eric Adams, Susan Murcott, Daniele Lantagne, Dr Richard Locke, Dr Pete Shanahan, the M.Eng Class of 2005, the G-Lab group, the Course 1 staff, Anne Graham, the Government of Kenya, Alie, SWAK, PSI, CDC, St Anna's Guesthouse, and many more. You have made this year so special. I will take you with me wherever I go.
TABLE OF CONTENTS
1 INTRO DU CTIO N ... 8
1.1 Background ... 8
1.2 The Technical Com ponent ... 9
1.3 Thesis Outline ... 10
2 W ATER ISSU ES IN KENYA AND NYA N ZA ... 11
2.1 K enya: G eography, Rainfall and W ater Resources... 11
2.2 N yanza: W ater Issues and Resources... 12
2.3 SW A K ... 14
2.4 Point-O f-U se (POU ) W ater Treatm ent ... 15
2.4.1 D isinfection and Chlorination... 16
2.4.2 W aterG uard@ and the SW S ... 19
2.4.3 PuR@ ... 21
2.4.4 M oringa ... 24
3 M ETH OD O LO GY ... 26
3.1 Prelim inary Phase... 26
3.2 D ata Collection... 26
3.3 Field Tools... 28
3.4 D ata A nalysis ... 29
3.5 Challenges ... 29
4 RESULTS...30
4.1 Sum m ary of Com m unities ... 30
4.2 Turbidity levels in Correspondence to Sources ... 30
4.3 Rainw ater U sage: ... 31
4.4 U ser Preferences:... 32
4.5 Safety Factor ... ... . 33
4.6 Field Observations... 33
4.7 Challenges ... 35
5 RECOMMENDATIONS & CONCLUSIONS ... 36
5.1 Recom m endations ... 36
5.1.1 Treatm ent Recom m endation ... 36
5.1.2 O ther Technical Recom m endations ... 38
5.1.3 Other Recom m endations ... 38
5.2 CO N CLU SIO N ... 40
6 REFERENCES... 41
Appendix 1: History, Economy and Culture in Kenya and Nyanza ... 45
A 1.1 K enya: Profile... 45
A l. 1.1 K enya: Brief H istory ... 45
A 1.1.2 Kenya: Econom y ... 45
A 1.1.3 Kenya: Society & Culture ... 47
A 1.1.4 Kenya: H ealth Profile... 47
A 1.2 N yanza: H ealth and Socio-econom ic Profile ... 48
Appendix 2: Turbidity D ata ... 50
Appendix 3: Rainfall D ata... 56
Appendix 5: Household Field Survey ... 58
Appendix 6: Survey Results...60
Appendix 7: Business Research Team Paper ... 64
LIST OF FIGURES
Figure. 1.1: Map of Africa and Kenya. Kisumu is the capital of Nyanza Province. ... 8
Figure 2.1: Physical Map of Kenya and Nyanza Province. ... 11
Figure 2.2: Average Rainfall in Kenya 1960-1990... 12
Figure 2.3: Chlorine D ose Curve. ... 18
Figure 2.4 a: Source Water immediately before and after PuR@ is added. ... 22
Figure 2.4 b: Source Water after Complete Administration of PuR@...22
Figure 2.5: Turbidity Removal of PuR@ . ... 22
Figure 2.6: CDC Data on Diarrhea Reduction from use of PuR@ in Guatemala. ... 23
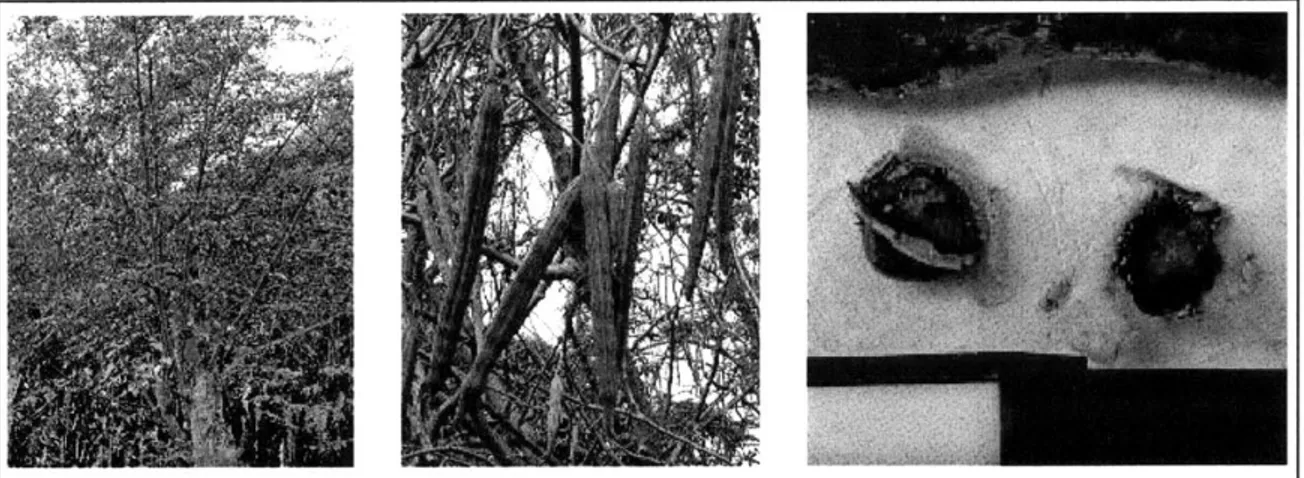
Figure 2.7: Moringa Oleifera Tree, Pods, and Seeds. ... 25
Figure 3.1: Approximate Location of Surveyed SWAK communities... 27
Figure 4.1: Source Use versus Average Turbidity of Source... 31
Figure 4.2: Percent of Population that Treated Rainwater ... 32
Figure 4.3: SWAK Community Product Usage... 32
Figure 4.4: Percentage of WaterGuard@ Users showing Free Chlorine Levels...33
Figure Al.1: Kenya-GDP Real Growth Rate... 46
LIST OF TABLES
Table 2.1: Water Resources in Kenya... 13
Table 2.2 a: Virus Removal Efficacy of PuR@... 23
Table 2.2 b: Bacterial Removal Efficacy of PuR@... 23
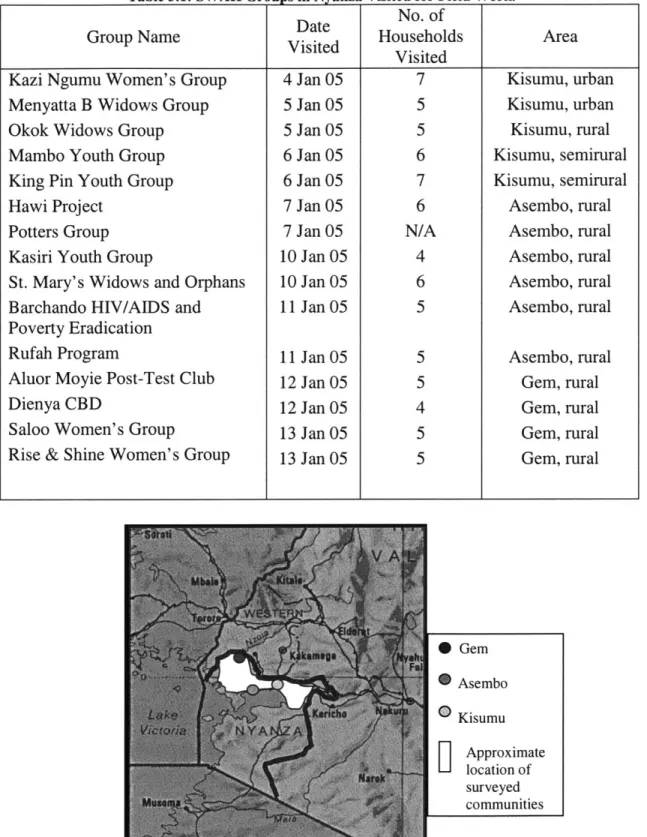
Table 3.1: SWAK Groups in Nyanza Visited for Field Work. ... 27
Table 4.1: Source Waters and their Turbidities... 31
Table 5.1: A im s and Tools U sed... 36
Table Al.1: HIV/AIDS statistics in Kenya... 46
Table A1.2: Key economic indicators for Kenya... 46
Table A1.3: Distribution of Ethnic Groups in Kenya by Province. ... 47
Table Al.4: Health indicators in Kenya... 47
Table A1.5: Estimated HIV infection in adults 15 to 49 by province, June 2000. ... 47
1 INTRODUCTION
The purpose of the research outlined in this thesis is to recommend the most appropriate water treatment option in the Nyanza province of Kenya.
1.1 Background
In October 2004, the Centers for Disease Control and Prevention (CDC) approached an interdisciplinary team of graduate students in the Civil and Environmental Engineering (CEE) Department at the Massachusetts Institute of Technology (MIT) and the MIT-Sloan Business School, with a proposal to address water safety issues in Nyanza (Figure 1.1 and Figure 2.1). CDC's field station in Nyanza, Western Kenya, studies infectious diseases including diarrhea, malaria, and HIV in order to develop and assess strategies for controlling these diseases.
In western Kenya, diarrheal diseases are a major cause of morbidity and mortality among children younger than 5 years, largely because of inadequate water treatment and human waste disposal infrastructure.' A 1999 health survey revealed that 66% of the population in rural Nyanza lacked access to safe drinking water, and 47% of children younger than 5 years had experienced diarrhea in the preceding 2 weeks.'
Mortality from water related diseases is further exacerbated by the increased HIV/AIDS rates in the region. Doctors and social workers interviewed during field research believe the HIV/AIDS rate to be anywhere from 25-40%. Already immuno-compromised, those affected are extremely susceptible to water-related diseases such as malaria, typhoid, cholera and other diarrheal diseases that typically result in mortality. Thus, morbidity can be reduced by making the water safer to drink.
SUA N e capitaL fy arince Maaais
TAZAIasoa 1 OM
TW~ C2W ~ ~ KWO E KNY
The high HIV/AIDS rates are a result of several historical, socio-economic and cultural factors in the region. Appendix 1 outlines these issues in greater detail.
In 2000, CDC began implementing the Safe Water System (SWS) in conjunction with CARE International in communities in the Nyanza province. SWS is a three-component approach to improve water quality and hygiene practices in the home, which includes treatment of drinking water with dilute sodium hypochlorite, safe storage and hygiene education.
In order to promote SWS, CDC joins forces with local NGOs (Non Governmental Organizations) to penetrate into regions that need SWS the most. One such NGO that CDC works with is SWAK (Society for Women and AIDS in Kenya). Headquartered in Nairobi, SWAK has offices in every province of Kenya including Nyanza where the author's project is located. Since October 2002, SWAK-Nyanza has been working to promote the use of SWS in some communities. They are currently seeking ways to
improve upon and expand the sales of SWS into all of their communities.
The overall goal of this project was to outline a set of recommendations to improve penetration and adoption of water treatment products in the SWAK communities. It was divided into two components:
" A technical component: Work included gauging the water quality in the communities, addressing technical problems the communities have with the treatment products and recommending the best available water treatment option for the communities.
" A business component: Work included gauging the markets, current business practices and outlining a set of best practices/recommendations to improve sales of the water treatment products in the communities.
The research outlined in this thesis forms the technical component and was conducted by the author.
The business component was addressed by a team of second year MIT-Sloan Business students - Mark Chasse, Jody Gibney, Rachel Greenblatt, and Ellen Sluder - who have multiple of years of prior business experience. Their report is included in Appendix 7. This multidisciplinary team traveled to Nyanza, Kenya in January 2005 to conduct field work in SWAK communities there. Results from the data collected in the field were presented to all stakeholders before the team's return to the United States.
1.2 The Technical Component
The goal of the technical component is to find the most appropriate water treatment product for the SWAK communities in Nyanza.
Three water treatment products were assessed. Two were already being marketed by SWAK in their communities - PuR@ and WaterGuard@. The third, an herbal product consisting of seeds from the Moringa tree family, was considered as a possible alternative mainly for financial reasons.
WaterGuard@ was designed by CDC in conjunction with PSI and CARE International for water disinfection. It consists of 1% Sodium Hypochlorite (NaOCl) solution. PuR@ was designed by Proctor & Gamble to reverse engineer a water treatment plant and to provide high quality drinking water at the point-of-use. PuR@ consists of Ferric Sulfate
(Fe2(SO4)3) for coagulation and Calcium Hypochlorite (Ca(OCl)2) for disinfection. PuR@
is important because Nyanza has naturally high turbidity levels in surface and groundwater. Moringa trees are locally available. Their seeds are proven to be natural coagulants.
Over the three week field research period in January 2005, fourteen SWAK communities were assessed using field surveys, and chlorine and turbidity tests in order to gauge personal preferences, product knowledge, current water practices and water quality. Upon return to the United States, the data was analyzed and further research was done to substantiate the results.
1.3 Thesis Outline
The second chapter outlines the water situation in Kenya and particularly, Nyanza. The chapter starts with an overview of water resources in Kenya before focusing on Nyanza's water issues, and provides an in-depth look into the water treatment products which have been briefly outlined above.
The third chapter outlines the methodology used for research. It is followed by chapter four which highlights the results of research conducted thus far.
This thesis concludes with chapter five where the final set of recommendations for SWAK is presented and the most appropriate treatment for use in the SWAK communities in Nyanza is discussed.
2 WATER ISSUES IN KENYA AND NYANZA
This chapter will highlight the water availability issues in Kenya and Nyanza.
2.1 Kenya: Geography, Rainfall and Water Resources
This section briefly highlights the salient water resources across Kenya. All data provided below is from Reference 4.
Kenya is located in Eastern Africa and shares borders with Ethiopia, Somalia, Sudan, Uganda and Tanzania. It covers a total area of 582,646 square kilometers and is home to the second highest mountain in Africa, the snow-capped Mt. Kenya, with an altitude of 5199 meters. A physical map of Kenya is provided in Figure 2.1.
Kenya can be divided into four geographic regions: Lake Victoria Basin, Rift Valley and Western Highlands, Northern Kenya and Eastern Highlands, and the Coastal Belt. The country goes through two rain cycles each year - long rains that run March through May, and the shorter rains that run October through December.
The Lake Victoria Basin, where the Nyanza Province is located, is next to the second largest lake in the world. It is generally considered the wettest region in Kenya. The rainfall is seasonal with an average of 60 mm in January, and 200 mm in April, and an annual rainfall of 1000 to 1300 mm. Temperatures range from a minimum average of 14 Celsius to 34 Celsius.
The Coastal Belt has an average temperature of 28 Celsius, and an average rainfall of 1100 mm, with a minimum of 20 mm in February and a maximum of 240 mm in May.
I 2 candNyanza -
-V loi Pps
The Rift Valley and the Western Highlands have the most moderate climate, with temperatures ranging from a high of 26-27 Celsius to a low of 12-15 Celsius in Nairobi and mean temperatures of 12-18 Celsius, and night temperatures of 0 Celsius in Mt. Kenya. The rainfall varies from 21 mm in July to 200 mm in April. The Highlands are the most fertile areas of Kenya.
Northern Kenya and the Eastern Highlands, home to the nomads, have the harshest climate with very little rainfall, ranging from a minimum of 0 mm in July to a maximum of 80 mm in November. Temperatures vary from 22 Celsius to 34 Celsius.
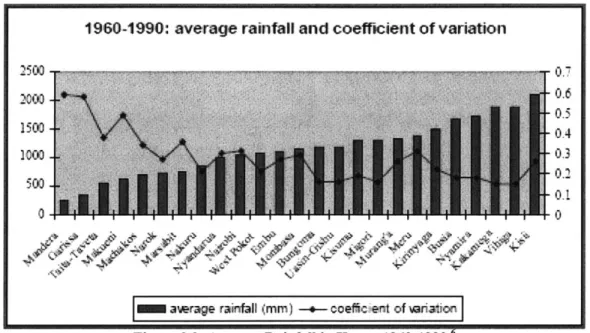
Detailed information on rainfall in Kenya can be found in Figure 2.2 and Appendix 3. Table 2.1 gives a brief look at the water resources and withdrawals in Kenya.
1960-1990: average rainfall and coefficient of variation
-0.6
0.4
0.
awrage rainfail (mm) -e- oeficient of eriation Figure 2.2: Average Rainfall in Kenya 1960- 1990.6
2.2 Nyanza: Water Issues and Resources
This section addresses Nyanza's water situation, sources used, and issues with access and availability. Information presented here is based on the author's observations and interviews conducted in the field with Nyanza residents, unless otherwise cited.
For the most part, the population of Nyanza has had a history of difficulty with regards to water access and distribution. While water itself is abundant, access is limited. Nyanza (Figure 2.1) has access to several freshwater sources, including one of Kenya's main rivers - the Nzoia, and Lake Victoria, the second largest freshwater lake in the world.7 Lake Victoria is 68,870 square kilometers in size and contains 2,760 cubic kilometers of water. The lake lies within an elevated plateau in the western part of Africa's Great Rift Valley and is subject to territorial administration by Tanzania, Uganda and Kenya.
Unfortunately, Lake Victoria is home to a highly impacted and polluted ecosystem, making the water unsafe to drink.7
Rainfall is another source of water for Nyanza residents. From Figure 2.2, rainfall in Kisumu, the capital of Nyanza, is estimated to receive around 1150mm per year. Many NGOs are encouraging rainwater harvesting in order to capitalize on this resource. Nyanza residents typically use corrugated metal roofs to collect water. Wealthier residents have gutters along the roof that collect the water and store it in a tank. The poorer residents usually collect the runoff in buckets placed under the periphery of the roof.
Nyanza residents, particularly those in the lower socio-economic bracket, use several sources other than rain, lake and river water. Women and children (who typically fetch water) choose from the sources that are nearest to them. This includes ponds, boreholes, open wells, earthpans (typically large depressions in the ground where water has collected), springs, streams and even ditches. There is a poor distribution system, particularly in the urban areas, that serves the wealthier sections of the community.
Table 2.1: Water Resources in Kenya.8
" Surface water produced internally: 17 km3 * Groundwater Recharge: 3 km3
Internal Renewable Water * Overlap (shared by groundwater and surface Resources (IRWR), 1977-2001: water): 0 km
3
R Total Internal Renewable Water Resources
(surface water + groundwater - overlap):
20 km3
* Per capita IRWR, 2002: 633 m3
Natural Renewable Water * Total, 1977 - 2001: 30 km3
Resources e Per capita, 2002: 947 m3/person
Annual River Flows 9 From other countries: 10 km 3
* Total withdrawals: 2 km3
* Withdrawals per capita: 87 m3
Water withdrawals (1990) * Withdrawals as a percentage of Actual Renewable Water Resources: 9.2%
* Withdrawals by Sector: Agriculture (76%), Industry (4%), Domestic (20%)
Water quality is another issue that Nyanza residents must combat. Turbidity in the region is unusually high. Data collected across Nyanza by CDC showcased turbidity levels averaging 205 Nephelometric Turbidity Units (NTUs).9 However, note that for this study, the most turbid sources of water in the region were deliberately sought out. This data is included under Appendix 2. The predominantly silty soil located in the region could be one of the factors responsible for the high levels of turbidity.
Turbidity in the water is caused by suspended matter such as clay, silt, and organic matter and by plankton and other microscopic organisms that interfere with the passage of light through the water.10 Turbidity limits the efficacy of disinfecting agents, such as chlorine because pathogens are able to hide in the suspended particles. For this reason, the United States Environmental Protection Agency's (USEPA) Surface Water Treatment Rule requires systems using surface water or ground water under the direct influence of surface water to (1) disinfect their water, and (2) filter their water or meet criteria for avoiding filtration so that at no time can turbidity go above 5 NTUs. Systems that filter must ensure that the turbidity go no higher than 1 NTU (0.5 NTU for conventional or direct filtration) in at least 95% of the daily samples in any month." Nyanza's turbidity levels are significantly higher as previously said and pose a serious safety issue.
Water quality is further compromised by waterborne pathogens. Diarrheal diseases are a major cause of morbidity and mortality among children younger than five years of age, largely because of inadequate water treatment and lack of sanitation. A 1999 health survey revealed that 66 percent of the population in the rural Nyanza Province lacked access to safe drinking water, and 47 percent of children under the age of five had suffered from diarrhea in the preceding two weeks.'
Many NGOs are combating waterborne diseases by implementing safe water treatment in the home, or point-of-use water treatment. SWAK, one such NGO, began their safe water program in 2002 with CDC, CARE and PSI. Now they are interested in scaling up their pilot project which markets water treatment technologies to their patrons. We will discuss SWAK in greater detail in the next section.
2.3 SWAK
This section introduces SWAK, its operations and how it is involved with promulgating water treatment in the community. Information presented here comes from interviews conducted in January 2005 with Alie Eleveld, the secretary of SWAK-Nyanza, and other SWAK staff, unless otherwise cited.
SWAK is the Kenyan affiliate of a much larger continental organization called SWAA or the Society for Women and AIDS in Africa. SWAA was born in 1988, during the 4th
International AIDS Conference in Stockholm, Sweden. Since then it has grown to include 40 African countries, including Kenya.
SWAK is SWAA's Kenyan subsidiary. It was founded in Nairobi in 1996 by a group of women who were HIV positive and others who were affected by the epidemic. In
addition to advocacy for women and children affected by AIDS, the group offers a wide range of services to women and families, including HIV education, counseling and support, children's activities, home-based care, nutritional products and training, training in income-generating activities, etc. SWAK has grown to include an office in all the 12 Kenyan provinces. The regional offices are largely decentralized since financial
independence is the only way for survival. However, the offices share a supportive relationship with the national office, regularly communicating their activities and progress. We worked closely with one of these regional offices-SWAK-Nyanza.
SWAK-Nyanza was founded in February 2000 in Kisumu, capital of Nyanza. It started with 10 volunteers and today counts over 3200 group members, all part of 160 registered groups, and 2000 individual members scattered across the Province. At the moment, it is headed by Alie Eleveld and a group of dynamic male and female volunteers, who work tirelessly to keep the organization going.
SWAK-Nyanza works by identifying community support groups for women, youth, widows, orphans, and families coping with HIV/AIDS. They teach these groups how to positively handle the disease by providing nutrition information, healthy living, income-generation training and other ways that primarily address the issue of AIDS. All of SWAK's programs are geared towards community development.
One support method used is micro-finance. Members buy health-based products like salves, high-protein flour, immune boosters, condoms, treated mosquito nets, soap, and safe water products at wholesale prices and then sell them at a small profit. This profit is generally used for community projects. This system fulfills two needs in the community: a profit margin for the community, and more importantly, desperately needed health products. Most members told the author that they are involved in SWAK programs primarily to help their communities.
In an effort to promote safe water treatment in the community, SWAK is selling WaterGuard@ and PuR@. Both are point-of-use water treatment products that will be addressed in detail in the following section.
2.4 Point-Of-Use (POU) Water Treatment
This section introduces POU treatment and highlights its importance in developing countries like Kenya.
POU water treatment is an in-home water treatment system. The devices are generally cheap, effective, sustainable, and easy to use. In most developing countries, residents lack access to continuous sources of water, and thus must store water in their homes. It is for these populations that POU water treatment is developed.
The most common form of POU water treatment is boiling. It is convenient and preferred because it uses the stove, which is already needed for cooking food. However, it has two
disadvantages -boiled water is subject to recontamination even as it cools; and it expends fuel.
Two POU treatment products were examined for this project - WaterGuard@ and PuR@. Both are being marketed by Population Services International (PSI), a nonprofit international organization based in the United States that has pioneered social marketing.13 In addition, a third, naturally occurring option was considered - Moringa seeds. All of these will be discussed later in this section.
First, the concepts of disinfection and chlorination will be examined as they explain how PuR@ and WaterGuard@ work.
2.4.1 Disinfection and Chlorination
This subsection introduces the concepts of disinfection and chlorination, the different types of disinfectants available, how chlorination works and its relevance to Nyanza. Primary references for this subsection are Reference 16 and 17, unless otherwise cited. As the term suggests, disinfection is the act of ridding infection. This is done by killing
microorganisms (Merriam-Webster) in water, air, on surfaces, etc.
Water is a medium for a variety of pathogens or "vectors" of pathogens (like mosquitoes) that are harmful to humans. These include microsporidia, mosquitoes, bacteria, viruses, amoeba, etc., which cause a range of water-related diseases including cholera, dysentery, diarrhea, giardiasis, typhoid, malaria, etc. Waterbome diseases like cholera and diarrhea are contracted when contaminated water is ingested. The only way to make water safe is to filter out or kill the microorganisms that are in the water.
There are many disinfectants that are used to make water safe. They can be divided into physical and chemical disinfectants. Physical disinfectants include ultraviolet radiation, electronic radiation, sound, heat, and gamma radiation. Chemical disinfectants include:14
* Chlorine compounds: chlorine (Cl2), chlorine dioxide (C10 2), hypochlorite
(OCl~), chloramines
" Halogens: bromine (Br2), iodine (I)
" Other oxidizing agents: ozone (03), potassium permanganate (KMnO4),
hydrogen peroxide (H202)
" Metals: copper (Cu2+), silver (Ag+)
" Other chemicals: phenols, alcohols, soaps and detergents, and several acids and bases
This project focuses on the use of chlorine compounds, a procedure known as chlorination. Chlorination can leave a residual and keep water safe long after administration (depending on the concentration added). Chlorine compounds are generally easy to generate, cheap and widely available. For all these reasons, chlorine
compounds are being used in POU water treatment products such as PuR@ and WaterGuard@.
Chlorine is a highly reactive element. It is a green diatomic gas in its elemental state. Chlorine, chlorine dioxide, and hypochlorite are all oxidizing biocides. Chlorination inactivates microorganisms by disrupting the transport of nutrients across the cell wall of the microorganism, not by disruption of a metabolic process.15
Chlorine gas was used for disinfection world-wide earlier in the 19 th century, but it brought on a whole set of issues. Storage was cumbersome, and it was difficult to transport. Hence other variations were sought out that had the disinfection ability of Chlorine gas, but were more stable. Hypochlorites (OCI-) are chloro-compounds that are more stable, easier to store, and in some ways, less reactive. Sodium hypochlorite (NaOCl) and calcium hypochlorite (Ca(OCl)2) are the most common hypochlorites. Sodium hypochlorite is the main disinfectant used in WaterGuard@; calcium hypochlorite is used in PuR@.
NaOCl is commonly known as liquid bleach or soda bleach liquor and is the most widely used of the hypochlorites for potable and waste water disinfection. It is liquid, requires more storage space and is more costly to transport over long distances than Ca(OCl)2 which is granular. However, NaOCl is much easier to handle and gives the least maintenance problems. NaOCl is prepared by a very simple rocedure involving the reaction of chlorine (Cl2) with caustic soda (NaOH) as follows:
2NaOH + C12 -+ NaOCl + NaCl + H20
Sodium hypochlorite is mixed with water for use at different concentrations. In the case of WaterGuard@, the solution is 1% NaOCl with a pH greater than 11.9.19
Ca(OCl)2 is a white crystalline powder commonly known as bleaching powder. It is the most expensive means of chlorination, but is less bulky and more cost efficient to transport than other forms of chlorination. It has to be stored very carefully because the chemical is highly exothermic and it decomposes rapidly. Calcium hypochlorite generation is relatively complicated compared to that of NaOCl. Its generation can be described through the following equation, mixing calcium hydroxide with chlorine gas to get calcium hypochlorite, calcium chloride and water:
2Ca(OH)2 + 2C 2 -- Ca(OCl)2 + CaCl2 + 2H20
The hypochlorites work in the following way. When mixed with water, they hydrolyze to form hypochlorous acid, HOCl:
NaOCl + H20-* Na+ + OH- + HOCl
HOCl is the most germicidal of all chlorine species, except for chlorine dioxide. Hypochlorous acid (HOCl) is a weak acid that partially hydrolyzes in water to form:
HOCl + H20<-+ H+ + OC
The dissociation and availability of all three species (HOCl, H+, and OC- ions) is based on the temperature and pH of the water. The ions combine to replenish the supply of HOCl, which is based on the equilibrium of the equation above.
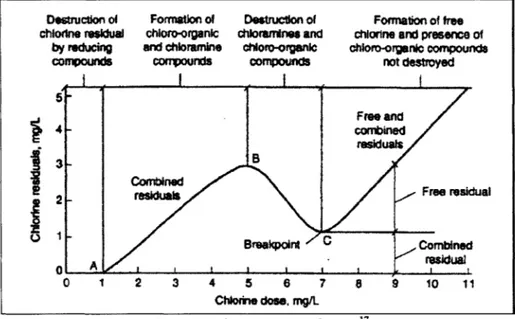
The amount of hypochlorites added for disinfection depends on the "chlorine demand" of the water. Figure 2.3 shows how chlorine dosage relates to the amount of chlorine that is left for disinfection. Chlorine is a strong oxidizing agent. Once HOCI ionizes in water, the chlorine quickly reacts with reduced compounds that naturally exist in the water like ammonia, metals, and organic compounds like humic and fulvic acids to form other products, including chloroamines and chloro-organic products. This amount of chlorine usage can be defined as the "chlorine demand" of the water.
Destruction of chlodne residual by reducing compounds Formation of choro-organic and chloramine compounds Destruction of dhioramines and chioro-organic compounds Formation of free
chlorine and presence of chioro-orgenic compounds not destroyed Free a combin residw 8 Combined residus BreakpoInt I t I I I t 0 1 2 3 4 5 6 7 8 9 Chlorine dose. mg/L Id 'Is Free residual Combined residual 10 11 Figure 2.3: Chlorine Dose Curve.17
Any chlorine still left (shown at point "C" onwards) that can be used for disinfection after all the demand has been met is called "residual" or "total chlorine." Residual chlorine can be divided into two parts:
* Free chlorine: The amount of HOCl and OC- that is available after meeting the chlorine demand and combined chlorine demand of the water. This is very important for determining the safety of water, since this amount is typically used for disinfection.
" Combined chlorine: When ammonia or organic nitrogen is present in the water, chloramines known as monochloramine, dichloramine, and trichloramine will quickly form. Chloramines are also known as combined chlorine.'8
4- 3- 2-i
I
0 AGood disinfection always accounts for chlorine demand and ensures that a safe level of free chlorine is available in the water.
2.4.2 WaterGuard@ and the SWS
This subsection discusses WaterGuard@ - what it is, why it was developed, and how it works. The primary references for this section are Reference 19 and 20, unless otherwise cited .
WaterGuard@ is a chemical component of the SWS program implemented by CDC. It was developed by the CDC in conjunction with the Pan American Health Organization (PAHO), primarily to combat waterbome bacteria and viruses in homes. The key factors in its development were its ease of use and efficacy at disinfection.
The SWS system consists of the following:
" POU water treatment: Patrons are encouraged to use sedimentation, followed by filtration over a clean cotton cloth. This is meant to decrease turbidity and filter out cryptosporidia, giardia and mosquito larvae, among other things. Only after that are patrons encouraged to disinfect their water with WaterGuard@. CDC encourages patrons to administer WaterGuard@ using the following guidelines. For treating water with turbidities
- less than 30 NTUs, use single dose of WaterGuard@
- more than 30 NTUs, but less than 100 NTUs, use double dose of WaterGuard@
- more than 100 NTUs, use PuR@
" Safe Water Storage: A safe storage system is necessary to slow down the dissipation of chlorine and to prevent pests, dirt, contaminated hands, etc, from recontaminating the water. CDC, in conjunction with several local NGOs, has developed safe storage containers that are closed, protected, and have spigots for water access (as opposed to using hands or containers to dip into the containers to access water).
* Behavioral Change Education: These techniques include community mobilization (like SWAK) and social marketing (like PSI) to penetrate the market providing educational links between water and disease and the need for hygiene.
CDC found the rate of diarrhea decreased by 24% to 71% when SWS was used correctly. Countries in these studies include Zambia, Bolivia, Bangladesh, Uzbekistan, and Pakistan. In a study conducted in Malawi, a 69% reduction of microbiological indicators (fecal/thermotolerant coliforms, and E. coli) was noted in users of the Safe Water System. Studies in Bolivia and Pakistan show similar results. 20
In the year 2000, CDC implemented the SWS program in Nyanza, Kenya. With the help of CARE, several governmental agencies, PSI, SWAK and Jet Chemicals, it has slowly become a nationally available product.
WaterGuard@ is a disinfectant, consisting of 1% sodium hypochlorite (NaOCl) solution. It was originally marketed under the name of Klorin by CARE. In October 2004, PSI branded the same product under the name of WaterGuard@. There are no differences between the products. During the course of this project, Klorin was in the process of being phased out and WaterGuard@ was phasing in.
WaterGuard@ disinfects through chlorination as outlined in Section 2.4.1 Disinfection and Chlorination. It consists of 1% NaOCl solution sold in 500 ml bottles and retails for 45 Kenyan Shillings (Ksh) ($0.56; $1 = 80 Ksh, as of January 2005). The bottles were designed to last a family of six for about three months, or treat around 2500L of water. The price was about 10 Ksh lower until October 2004, when the Government of Kenya instituted a VAT (Value Added Tax) which raised it to the current price of 45 Ksh. This has been a significant raise since the average income of the communities we were examining was less than 32 Ksh per day.
PSI makes their products locally in order to keep prices low. For example, it produces WaterGuard@ through a local partner called Jet Chemicals. The bottles are sold in crates of 20, at a wholesale price of 40 Ksh per bottle. This gives a net profit of 5 Ksh per bottle to the SWAK members.
WaterGuard@ dosages are developed by CDC in conjunction with PSI and are based on water conditions of the area. In Kenya and most of Africa, WaterGuard@ is 1% NaOCl (10,000 ppm) added to water. For comparison, Clorox Bleach is approximately 5.25% to 6.00% NaOCl.
WaterGuard@ is administered by mixing half a bottle cap (4 ml) to 20 L of water. The water is stirred and left to disinfect for about 30 minutes. Chlorine levels are typically high enough to sustain a safety factor (meaning a detectable amount of free chlorine) for a period of 24 hours.19 In the case of turbid water, where turbidity is visible, patrons are instructed to double the dosage of WaterGuard@ from one capful to two (8mL). CDC believes this method to be effective up to a turbidity of 100 NTUs.19 This is to ensure that there is enough free chlorine in spite of the turbidity.
WaterGuard@/Klorin has deficiencies. It was not developed to combat turbidity. It is defenseless against mosquito larvae, cryptosporidia oocysts, and other microsporidia. Chlorine can kill these pathogens only at very high concentrations, at which point the water becomes very bitter. Also, the chlorine is unstable. The residual dissipates over time, leaving water that is not sealed or covered, susceptible to contamination.
2.4.3 PuR@
This subsection examines the definition and operation of PuR@, and its importance in Nyanza. Primary references are 20, 21, 22, and 23, unless otherwise cited.
PuR@ is the latest water product to be added into SWAK's safe water initiative. It was developed by the Proctor and Gamble Health Sciences Institute (PGHSI) in Mason, OH, in collaboration with CDC. It was primarily designed for regions with highly turbid waters, like in Nyanza where drinking water turbidities can average about 205 NTUs.9
PuR@ was developed in response to customers who wanted more visible signs of water treatment, more control of their water treatment and affordability. The engineers at PGHSI took all the methods of a conventional water treatment system and reverse-engineered them to fit into a small sachet. PGHSI developed a new flocculent-disinfectant technology for treating water in the home that incorporates techniques used in municipal water purification. PuR@ uses ferric sulfate Fe2(SO 4)3 for coagulation and
calcium hypochlorite Ca(OCl)2 for disinfection. It removes heavy metals, organic matter, and microorganisms; and leaves free chlorine residual in water. After decanting, the treated water is microbiologically and chemically cleaner and looks clearer. The immediate improvement in clarity may encourage more people to treat their water. A three-week pilot study in November 2000 demonstrated the microbiologic efficacy and short-term acceptability of this technology in rural Guatemalan households. Results from this study have been provided in Appendix 4.
PuR@ is not as yet commercially marketed in Kenya, except through SWAK-Nyanza. PSI-Nairobi informed the author in January 2005, that PuR@'s launch had been postponed due to lack of funding. SWAK-Nyanza was first introduced to PuR@ during pilot studies conducted by CDC, between 2002 and 2004. After the pilot study ended SWAK-Nyanza began obtaining their supplies from PSI-Uganda, where the product is commercially marketed.
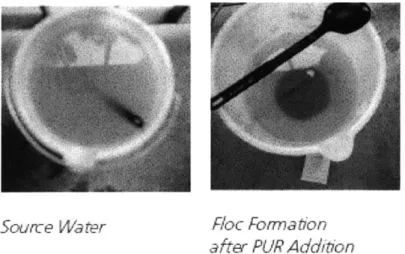
PuR@ comes in a thumb-sized plastic sachet and retails for about 8 Ksh. Each sachet can treat 10 L of water. To administer PuR@, a patron will place the contents of the powder in 10 L of water and stir vigorously for five minutes. The water is left so that the flocs can settle. The water is then filtered over a clean cotton cloth and left to disinfect for 30 minutes, after which it is ready to drink. Figure 2.4 a and b show changes to water as PuR@ is administered. In Kenya, water with turbidities as high as 1850 NTUs have been successfully reduced to 3.2 NTUs with a single treatment, as shown in Figure 2.5.
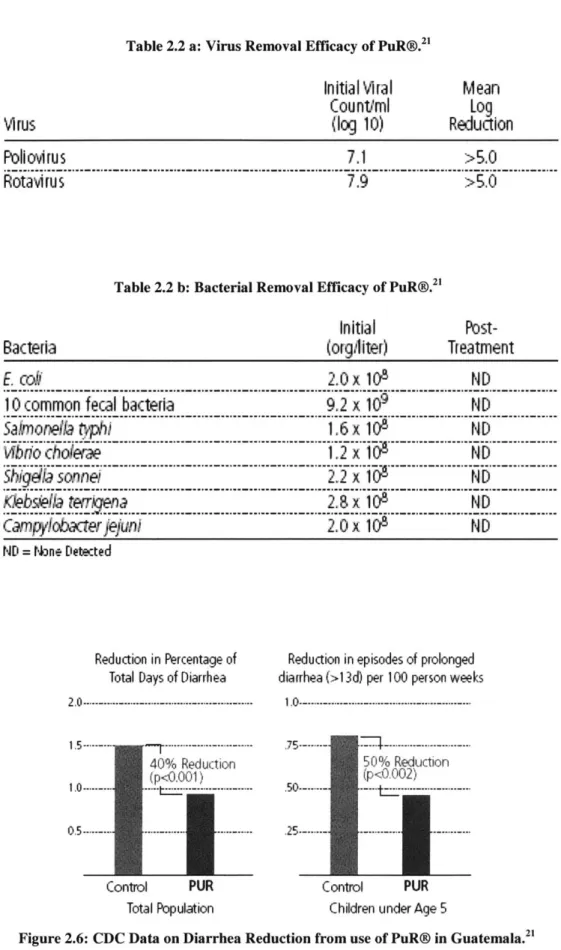
Statistically, PuR@ has demonstrated amazing pathogen removal rates as shown in Table 2.2 a and b. Additional test results are shown in Appendix 4: PuR@ Test Results. In addition, studies conducted by CDC in Guatemala have found dramatic reduction in diarrhea as shown in Figure 2.6.
Unfortunately, PuR@ comes at a high cost, and is very expensive for the SWAK communities. For a month of drinking water, a family of six will have to invest approximately 1200 Ksh. This complicates matters severely and limits the usability of
PuR@. The fact that it is not commercially available complicates matters further, since the stock cannot be easily replenished.
Source Water fRac Formation
after PUR Addit'on
Figure 2.4 a: Source Water immediately before and after PuR@ is added.2'
bloc Formation after Decanting the Water Clean Water Ready Complete Stirring Through a Clean for Storage and Use
Cotton Cloth Filter
Figure 2.4 b: Source Water after Complete Administration of PuR@.21
Kenyan Drinking Water Samples
~Dami Sodnia
Turbidity (NTU)
Virus
Table 2.2 a: Virus Removal Efficacy of PuR@.
Initial Viral
Countiml
(log 10)
Poll ov!ru S 7.1 >5.0
Rotavirus 7.9 >5.0
Table 2.2 b: Bacterial Removal Efficacy of PuR@.
Initial
(orghiter) BacteriaMean
Log
Reduction
Post-TreatmentE.
co# 2.0x 10 ND10 common fecal bacteria 9.2 x 10⁹ ND
Sanortea typ) 6 x 10⁸ ND
Sbida sonne
.
C p
ykbatet
jejui 2.0 x 10⁸ NDND = Nne Detected
Reduction in Percentage of Total Days of Diarrhea
1.5--- ---.---40% Reduction (p<0.001) 0.5--- -- ---Control PUR Total Population
Reduction in episodes of prolonged diarrhea (>1 3d) per 100 person weeks
50% Reduction (p<0.0 0 2)
.50--- -- t --. - -
-25-.- ---
---Control PUR Children under Age 5
2.4.4 Moringa
This subsection examines the desirability of alternative water treatment technologies in Nyanza and how Moringa fills that need.
In 2002 the average per capita income in Kisumu, was only 14,160 Ksh2 4 (~ $177). This
is more than 50% below the "dollar a day" poverty line set by the World Bank. Since SWAK communities are low income communities, it can be safely assumed that their average income is significantly below this average. Both PuR@ and WaterGuard@ are significant investments for the people. Therefore other more locally available models of POU water treatment are being considered. Moringa (Figure 2.7) is an option that seemed most viable due to its local availability.
Moringa is a gnarled tree that has been linked to multiple benefits. Used in India to cure blood pressure and in West Africa for diabetes, this plant sounds like a wonder drug. Moringa flowers, leaves, and roots are used in folk remedies for tumors, the seed for abdominal tumors. The root decoction is used in Nicaragua for dropsy (edema); root juice is applied externally as rubefacient or counter-irritant. The leaves are applied as poultice to sores, rubbed on the temples for headaches, and said to have purgative properties. The bark, leaves and roots are acrid and pungent, and are taken to promote digestion. The bark is regarded as antiscorbic, and exudes a reddish gum with properties of tragacanth; it is sometimes used for diarrhea. The roots are bitter; they act as a tonic to the body and lungs, and act as an emmenagogue, expectorant, mild diuretic and stimulant for paralytic afflictions, epilepsy and hysteria. Probably what is most amazing about moringa is its ability to clear turbidity in water, and soften hard water by creating flocs when added to water. 26
Of the 13 species of moringa identified thus far, about six are native and abundantly found in Kenya.2 7 There are reported cases of moringa being used for water treatment in parts of Ghana and Malawi. Scientists at the University of Leicester in the United Kingdom have done extensive research to better understand the water treatment processes of Moringa.29
For water treatment purposes, the seed pods are allowed to dry naturally on the tree prior to harvesting. After shelling the pods, the seeds are crushed and sieved using traditional techniques employed in the production of maize flour. Approximately 50-150 mg of ground seed are needed to treat a liter of water, depending on the quantity of suspended matter. A small amount of clean water is then mixed with the crushed seed to form a paste. Dosing is usually according to a 1-3 percent solution. The crushed seed powder, when added to water, yields water soluble proteins that possess a net positive charge. The solution therefore acts as a natural cationic polyelectrolyte during treatment. Results showed that at this rate water with turbidities between 270 and 380 NTUs were consistently reduced to below 4 NTUs in the treated water.2 8
Moringa trees have more advantages than just health and turbidity-reduction competence. They grow very easily and are incredibly drought resistant. A moringa sapling can mature to a full-grown tree in about 15 months. Every part of the plant can be used for
something. 27 It's multipurpose uses include providing wood, food, nutrition and water
treatment capabilities for the community.
There are disadvantages to moringa being used as a water treatment product. It has to be harvested, ground and sold. Since cash crops are the focus of most communities, moringa trees are considered a waste of land space. A market for it is not yet available since it is a home remedy. There is also a certain disdain associated with local, holistic remedies that lack the packaging and hype that accompany products like WaterGuard@ and PuR®. Finally it takes more time and effort (since it is not pre-packaged) to use for water treatment. And if used, moringa lacks the ability to disinfect. That means that after turbidity removal, it would have to be paired up with WaterGuard@ (NaOCl) or Ca(OCl)2 to ensure safety.
There are other issues as well. Most turbidity research has been conducted on Moringa
27
Oleifera, the most prevalent and useful species in the world. Even the Moringa trials being conducted by the University of Leicester in Malawi and Ghana use Moringa Oleifera.29 This species is still not widely available in Kenya or at least it hasn't been mapped yet. Very little research has been done on Moringa Stenopetala, the more abundant species in Kenya. While tests have shown that Moringa Oleifera is effective for turbidities of 400 NTUs, little is known beyond that range. In addition, it is not known how widely available Moringa is in the Nyanza region. With this amount of unknown information, it is difficult to say if this approach can be a viable, cost-efficient factor in turbidity removal.
3 METHODOLOGY
This project was conducted in conjunction with a team of MIT-Sloan Business students. Project planning and research began in late October 2004. In January 2005, the team traveled to the Nyanza Province where field research was conducted across the area for three weeks. Upon return in February, the team began data analysis and research necessary to substantiate results.
The specific goal of the engineering component was to gauge the needs of the community based on source water quality and consumer preferences. Consequently, water testing and household surveys were used to measure these variables.
3.1 Preliminary Phase
The preliminary phase ran from late October through early December. Research included a literature review, book research, and equipment orientation; regular team meetings with the Sloan Business team, and stakeholders involved including CDC-Atlanta, and SWAK-Nyanza. Deliverables were identified and schedules were outlined.
3.2 Data Collection
This section discusses the methodology and location of field work.
Data collection took place in Nyanza over the course of three weeks in January 2005. It started with preliminary interviews in Nairobi, with PSI-Nairobi and SWAK-Kenya. The purpose of the interviews was to understand the organizations' national operations, their programs, marketing/operation strategies, consumer base and products, vis-a-vis WaterGuard@ and PuR@.
The team then moved to the Nyanza Province, where they worked out of Kisumu, the capital of Nyanza. Over the course of 15 days, 15 different communities were visited (Table 3.1). These communities were located across the province and randomly identified by SWAK. One community group (potter group) and was visited for information on the construction of safe water pots, not for product analysis. Figure 3.1 provides the approximate location of communities surveyed.
Communities were located in urban, semirural and rural localities. A total of 75 households were visited for surveys and water tests. One household declined the survey, leaving a group of 74.
At the end of field work, data (discussed in Chapter 4) was quickly analyzed and put into a presentation for all stakeholders involved, particularly SWAK communities that had been involved in the research, and PSI-Nairobi. The purpose of this presentation was to give immediate feedback to the communities before the team's return to the United States. This plan ended up being very successful because discussions with the community
members were still fresh and many of them were keenly interested in the recommendations of the team.
Table 3.1: SWAK Groups in Nyanza Visited for Field Work.
Date No. of
Group Name Visited Households Area
Visited
Kazi Ngumu Women's Group 4 Jan 05 7 Kisumu, urban
Menyatta B Widows Group 5 Jan 05 5 Kisumu, urban
Okok Widows Group 5 Jan 05 5 Kisumu, rural
Mambo Youth Group 6 Jan 05 6 Kisumu, semirural
King Pin Youth Group 6 Jan 05 7 Kisumu, semirural
Hawi Project 7 Jan 05 6 Asembo, rural
Potters Group 7 Jan 05 N/A Asembo, rural
Kasiri Youth Group 10 Jan 05 4 Asembo, rural
St. Mary's Widows and Orphans 10 Jan 05 6 Asembo, rural
Barchando HIV/AIDS and 11 Jan 05 5 Asembo, rural
Poverty Eradication
Rufah Program 11 Jan 05 5 Asembo, rural
Aluor Moyie Post-Test Club 12 Jan 05 5 Gem, rural
Dienya CBD 12 Jan 05 4 Gem, rural
Saloo Women's Group 13 Jan 05 5 Gem, rural
Rise & Shine Women's Group 13 Jan 05 5 Gem, rural
SGem Asembo 0Kisumu Approximate location of surveyed communities
3.3 Field Tools
This section discusses the tools employed and the capacity in which they were used in the field.
The goal of field research was to gain an understanding of consumer preferences and their knowledge of water treatment. Households were randomly visited in a selected community and assessed using two tools:
1. Field Survey: The purpose of the field survey was to understand the consumers' current practices with regards to water treatment, their understanding of WaterGuard@ and PuR@, source water preferences, treatment preferences and ease of use. The survey has been enclosed in Appendix 5.
The survey consisted of a series of open-ended questions and included both qualitative and quantitative components. The author (or the translator upon the author's prompting) would ask the questions in order and then wait for the respondent to answer. If answers were vague or not specific enough, the respondents were prodded for more details. For example, for Question #3 (Where do you get your source water(s) from?), a respondent might answer "borehole". The respondent was prodded further for other water sources he/she might have accessed in the past, which was often the case. Or, when asked about whether she treated or boiled her drinking water, she would respond "yes"; she would be prodded on her methodology to gauge "correctness" of the model.
The field survey team consisted of at least three members: the author, a local translator who accompanied the author to all households, and a community leader who typically led the way to the houses. The community leaders were instructed to pick houses at random, but generally they picked houses based on who was home. Occasionally, other curious community leaders, or a Sloan Business student would accompany the group and ask further questions.
The surveys took anywhere from 15 to 40 minutes, depending on household. Unfortunately, surveys were limited by time constraints. In the end only an average of
5 households were surveyed per community. This is because the distances were typically extensive between households.
2. Water Testing: After the surveys, water was collected from the household drinking water supply if the respondent had used WaterGuard@ or PuR@. This drinking water was tested for total and residual chlorine levels. The purpose of chlorine testing was to determine if the treatment products were being administered correctly.
Two different chlorine testing kits were used. First a Hach Digital Titrator (Item no. 16900-01) was used, but the equipment proved to be cumbersome, and tests were erroneous. It was replaced on 7 January 2005 by a simpler Lamotte Chlorine Colorimeter DC 1200-cl (calibrated with Lamotte standard solutions of 0.0, 0.1, 1.0, and 2.65 mg/L). The colorimeter was borrowed from the CDC staff in Kenya.
In addition, source waters and household water samples treated with PuR@ were assessed for turbidity levels. The purpose of this was to gauge:
" whether PuR@ was being administered correctly, " turbidity of source waters in the area.
For turbidity tests, a Hach 2100 P Portable Turbidimeter from MIT was used for testing in the beginning. It had trouble calibrating, and default calibrations were used. It was replaced on 7 January 2005 by a Lamotte 2020 Turbidimeter (calibrated at 1, 10, and 100 NTUs) borrowed from the CDC staff in Kenya.
In all communities, an average of one sample was tested twice to gauge precision of the equipment and results; an average was recorded.
3.4 Data Analysis
Field research was officially closed on 26 January 2005. Upon return to MIT, the team met several times to analyze collected data for the compilation of the business model. From a technical perspective, the focus of the project became more defined; data analysis and research followed suit.
3.5 Challenges
There were many challenges encountered during the course of the field work. Consequently tools had to be changed and some of the results recalibrated.
The first issues encountered were with lab equipment. The initial turbidimeter was not calibrating correctly, so the default calibration had to be used. The default calibration proved to have an error of ±3 NTUs. The turbidimeter was replaced on 7 January, 2005 with another one loaned by Daniele Lantagne from CDC. Similarly, the original chlorine-testing equipment was left in the hotel room, instead of being taken into the field. Samples collected during the day were tested within a twenty-hour period. However, the chlorine in the samples typically evaporated within thirty minutes of collection, immediately invalidating all test results collected until then. On January 7, 2005, the equipment was replaced with one obtained by Daniele Lantagne from CDC.
There were several time constraints that affected the household surveys. First, all the research had to be finished over the course of 15 days. Second, the technical research team had to follow the same time-frame as the business research team (who conducted focus groups, rather than in-depth surveying). Both issues forced time constraints on the length of the survey and the number of surveys possible. The survey consisted of mostly open-ended questions and relied on the prompting of the surveyors for detailed answers (as shown in Appendix 5). The purpose of the survey was to gauge and communicate knowledge of water treatment/products in a very short period of time.
4 RESULTS
This chapter summarizes the results of the research conducted in the field during January 2005. Methodology consisted of household surveys and water quality tests as described in Chapter 3. The chapter will start with a summary of communities surveyed, followed by a section on field observations. It will conclude by outlining challenges that the author believes have affected the results and conclusions. A collection of tabulated survey results are presented in Appendix 6.
4.1 Summary of Communities
Total number of communities assessed = 14
Overall number of households visited for assessment = 74 Average number of households per community = 5 Profile of an average household:
0 Household consists of 6 members
0 Family uses about 6 Jerry Cans of water per day (120 L) 0 1 Jerry Can of drinking water lasted a family 3.5 days 0 Household income = 960 Ksh/month
Cost of materials/products for treatment:
" Sachet of PuR@ costs 8 Ksh. Each sachet treats 10 L of drinking water, which provides a family of 6 enough water for 1 day
* Bottle of WaterGuard@ costs 45 Ksh. It treats 2500 L of water, which typically takes a family of 6 through three months.
" A bundle of firewood costs 20 Ksh, and typically provided fuel for boiling water (and other needs such as cooking, fire, and heat) for one day
* A bag of charcoal costs 300 Ksh; it was used as fuel for a month.
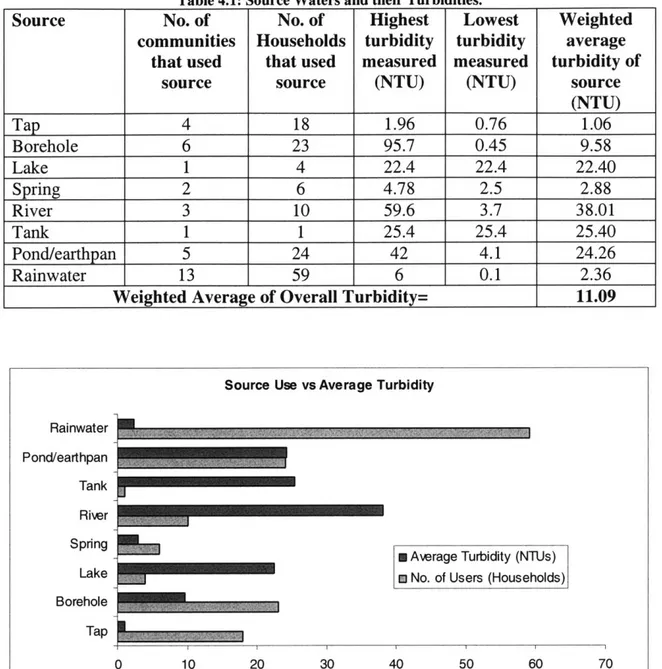
4.2 Turbidity levels in Correspondence to Sources
Most communities used multiple sources of water. Sources and their corresponding turbidity levels are included in Table 4.1.
From Table 4.1, rainwater can be discerned to be the most popular water source, used in thirteen of the fourteen communities surveyed. While the most turbid source was a borehole at 96 NTU, the source with the consistently highest turbidities across all the communities (based on the weighted average) is river water.
Figure 4.1 provides a good comparison between source usage and turbidity levels. It highlights the importance of continued rainwater harvesting and treatment, since it has the best user-turbidity ratio.
Table 4.1: Source Waters and their Turbidities.
Source No. of No. of Highest Lowest Weighted
communities Households turbidity turbidity average that used that used measured measured turbidity of
source source (NTU) (NTU) source
(NTU) Tap 4 18 1.96 0.76 1.06 Borehole 6 23 95.7 0.45 9.58 Lake 1 4 22.4 22.4 22.40 Spring 2 6 4.78 2.5 2.88 River 3 10 59.6 3.7 38.01 Tank 1 1 25.4 25.4 25.40 Pond/earthpan 5 24 42 4.1 24.26 Rainwater 13 59 6 0.1 2.36
Weighted Average of Overall Turbidity= 11.09
Source Use vs Average Turbidity Rainwater
Pond/earthpan Tank River Sprnng
S Average Turbidity (NTUs)
Lake m No. of Users (Households)
Borehole
Tap
0 10 20 30 40 50 60 70
Figure 4.1: Source Use versus Average Turbidity of Source.
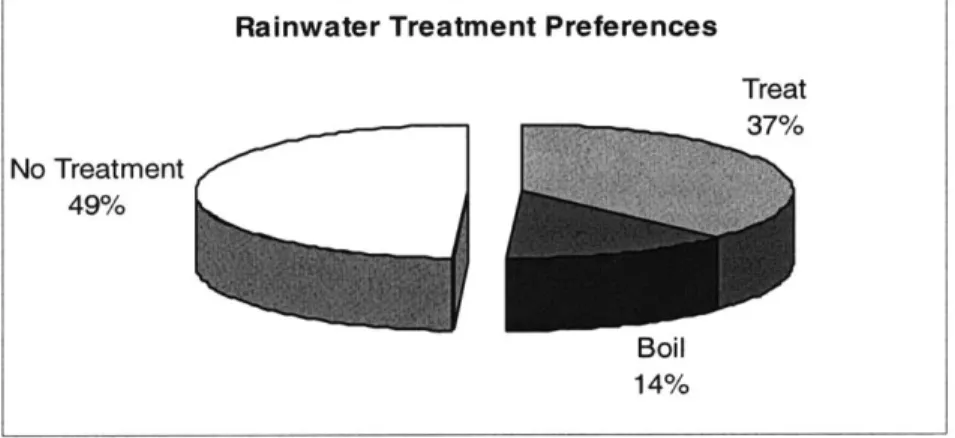
4.3 Rainwater Usage:
Rainwater posed a challenge to water treatment because there is a prevailing notion that the rain is pure. The contamination encountered en route to storage/usage is neglected. Total number of users: 59
Total number of rainwater users who boil or treat their rainwater: 30
In other words, about half of the population that uses rainwater does not boil or treat it before consumption (Figure 4.2). This could be a serious water safety hazard because of the potential contamination of rainwater during collection and storage.
4.4 User Preferences:
Overall, WaterGuard@ seemed to be the most utilized product (Figure 2.3). Patrons seemed satisfied and safe with the product, ensuring continued use of the product. 100% of WaterGuard@ users self-reported an elimination of stomach ailments upon continued use. All WaterGuard@ users said that they were satisfied with the product. The only complaint voiced was that it made the water taste and smell different, and took a little adjustment. It turned out that the two communities that were most vocal about this issue were overdosing by nearly 4 times the required amount.
No. of households surveyed who use WaterGuard@/Klorin = 33 No of people preferring to boil = 27
No. that use PuR@ = 1 *
No. that use Moringa = 1*
*both respondents had used the product very briefly and sporadically, and both preferred and used WaterGuard@ regularly. For analysis, they are incorporated into both PuR@, Moringa and WaterGuard@ groups.
Figure 4.2: Percent of Population that Treated Rainwater
Product Usage No WaterGuard Treatment, /Klorin Monnga 23% 40% 1% PuR 1%
Figure 4.3: SWAK Community Product Usage. Rainwater Treatment Preferences
Treat 37% No Treatment 49% Boil 14% Boiling 35%