HAL Id: hal-01630454
https://hal.archives-ouvertes.fr/hal-01630454
Submitted on 7 Nov 2017
HAL is a multi-disciplinary open access
archive for the deposit and dissemination of
sci-entific research documents, whether they are
pub-lished or not. The documents may come from
teaching and research institutions in France or
abroad, or from public or private research centers.
L’archive ouverte pluridisciplinaire HAL, est
destinée au dépôt et à la diffusion de documents
scientifiques de niveau recherche, publiés ou non,
émanant des établissements d’enseignement et de
recherche français ou étrangers, des laboratoires
publics ou privés.
Distributed under a Creative Commons Attribution - NonCommercial - ShareAlike| 4.0
Second harmonic and terahertz generation in a
Prussian-blue-analog.
Amine Ould-Hamouda, Antonio Iazzolino, Hiroko Tokoro, Shin-Ichi Ohkoshi,
Eric Freysz
To cite this version:
Amine Ould-Hamouda, Antonio Iazzolino, Hiroko Tokoro, Shin-Ichi Ohkoshi, Eric Freysz. Second
har-monic and terahertz generation in a Prussian-blue-analog.. European Journal of Inorganic Chemistry,
Wiley-VCH Verlag, 2018, 2018 (3-4), pp.378-384. �10.1002/ejic.201700980�. �hal-01630454�
Second harmonic and terahertz generation in a Prussian-blue-analog.
Amine Ould-Hamouda,
[a]Antonio Iazzolino,
[a]Hiroko Tokoro,
[b,c]Shin-Ichi Ohkoshi,
[b]and Eric Freysz*
[a]Abstract: Second-harmonic and terahertz generation are performed in Rb0.94Mn[Fe(CN)6]0.98.0.3H2O Prussian-blue-analog. Second-harmonic generation experiments are carried out in between 1100 and 1700 nm and within the hysteresis loop of this compound. In the low and high temperature phases, our measurements indicate that the effective second-order nonlinear component χ(2) of this material is small compared to -Quartz. However at high temperature phase and close to 1100 nm, its χ(2) is enhanced by more than one order of magnitude. Terahertz generation performed indicates that in this frequency range, the effective χ(2) of this compound is high and comparable to ZnTe. Finally we demonstrate that, within the thermal hysteresis loop of this Prussian-blue-analog, one can modulate the χ(2) by photo-switching it from the low temperature to the high temperature phase.
Introduction
Coordination polymers have recently lot of attention due to their interesting nonlinear optical properties.[1–3] Among these compounds, it has been shown that Prussian-blue-analogues offer many prospects in nonlinear optics.[4–8] For instance, the cyano-bridged coordination polymer of RbxMn[Fe(CN)6](x+2)/3 z H2O switches from a
centro-symmetric to a non-centrocentro-symmetric and piezoelectric structure when one increases the Rb content above x=0.7.[6]
The non-centrosymmetric structure of the compound gives rise to second-order nonlinear optical properties that were revealed by second-harmonic generation (SHG) experiments. These SHG experiments were performed using Nd:YAG nanosecond laser pulses centered at 1.064 µm. Above x=0.7, it was demonstrated that the second-order nonlinear coefficient steadily increases with the Rb content.[6] For x=0.94, as the temperature is increased from T=240 K to T=320 K, a phase transition between a tetragonal low temperature (LT) structure to a cubic non-centrosymmetric high temperature (HT) structure is recorded.[9]
During this phase transition, which is associated to a broad thermal hysteresis loop spanning in between 250 K and 310 K, the color of the sample turns from light brown to dark brown. Since both phases are non-centrosymmetric, SHG signal can be recorded. It is interesting to mention that, if the Kleinman’s symmetry conditions hold, this material exhibits the same non-null nonlinear coefficient in both the HT and LT phase.[10]
This makes it possible to directly compare the value the second-order nonlinear properties of this compound in the HT and LT phase. The modulation of SHG signal recorded during the structural change of this compound provides an original mean to record the thermal hysteresis loop.[6] However, the recorded modulation of the SHG signal may be either due to the modification of the amplitude of or of the index of refraction in the LT and HT phase.[11] In the HT phase, exciting the sample with nanosecond pulses centered at =1.064 µm,
was found to be ~0.032 pm.V-1
. However, due to the high absorption of the SHG signal at =532 nm, such measurements have not been performed in the LT phase. Hence, it is difficult to directly compare the second-order nonlinear optical properties of this material in the LT and HT phases. Hereafter, we will demonstrate that,
thanks to a procedure we will describe, we have been able to determine
of this compound in the LT and HT phases over a spectral range ranging from 1.1 µm to 1.8 µm. In the LT phase and at 1.1 µm, the measured second-order optical susceptibility increases about two-orders of magnitude reaching a value =2.7±0.3 pm.V-1. We will show that this enhancement is related to an absorption band of this material whose maximum shifts from 410 nm to 460 nm as the compound switches from the HT to the LT phase. Within the hysteresis loop, we illustrate how one can optically modulate the nonlinear optical properties, namely its , by photo-switching it from the low temperature to the high temperature phase. We have also evaluated the capability of this material to generate terahertz (THz) waves. Indeed, like ZnTe a crystal widely used to generate THz pulses,[12–14] this material belongs to the space group. Accordingly, one may wonder if THz generation cannot be recorded in Rb0.94Mn[Fe(CN)6]0.98.0.3H2O. Performing THz time domain
spectroscopy (TDS), we have first measured the absorption and the index of refraction of this compound in the THz spectral range. Our data indicates this material exhibits a transparency window ranging from 2.5 to 7 THz. Then we have used it to generate THz radiations. We have easily been able to record a non-phase-matched THz signal. In the THz frequency range, the value of the second-order optical susceptibility of this material is found to be very large and comparable with ZnTe crystal.
Results and Discussion
SHG
The evolution of the SHG signal in the LT and HT phases versus the power of the excitation pulse centered at 1200 nm is displayed in Fig. 1. In both the LT and HT phases, the intensity of the SHG signal exhibits quadratic power dependence. Moreover, regardless of the excitation intensity, the spectrum of the SHG signal is found to be in very good agreement with the spectrum of the excitation pulses. These measurements were performed repeatedly, tuning the central wavelength of the exciting pulse from 1.8 µm to 1.1 µm. At each wavelength, we found the SHG signal exhibits quadratic power dependence in both the LT and HT phase. To determine the second-order optical susceptibility of our sample, we calibrate the SHG against a 1 mm thick ZnSe polycrystalline optical window whose micro-crystallites size distribution is centered around 50–70 μm. This crystal also adopts a structure and its second-order optical susceptibility is well known ( = 53.8 pm.V-1). This window was inserted almost exactly at the position of our sample. To define the position of the sample, we inserted two small irises at the back and in the front of the lenses L2 and L3, respectively. These two irises fix precisely the
position of the sample.[7] Then the sample was removed and the ZnSe [a] Amine Ould-Hamouda, Antonio Iazzolino and Eric Freysz,
Universite Bordeaux, CNRS UMR 5798, LOMA, 358 cours de la libération, 33405 Talence Cedex, France
E-mail: [email protected]
[b] Hiroko Tokoro and Shin-Ichi Ohkoshi, Department of Chemistry, School of Science, The University of Tokyo, 7-3-1 Hongo, Bunko-ku, Tokyo 113-0033, Japan
[c] Hiroko Tokoro, Division of Materials Science, Faculty of Pure
and Applied Sciences, University of Tsukuba, 1-1-1, Tennodai, Tsukuba, Ibaraki 305-8573, Japan
window was installed in such a way that the excitation reflected by its front surface is passing through the center of these two irises. Moreover, to ensure we detected only the SHG generated at the surface of a ZnSe window, a razor blade placed on the top surface of the ZnSe window was used to block the SHG signal reflected by the back surface of the latter. Hence, for a fixed intensity of the exciting pulse and whatever its central wavelength, we were able to measure and to quantitatively compare the SHG signals generated by our sample and by the ZnSe window.
0 2 4 6 8 10 12 14 0.0 0.2 0.4 0.6 0.8 1.0 1.2 1.4 HT LT I ( ) ( u .a .) I () (u.a.) 580 590 600 610 620 0 400 800 1200 1600 2000 S H I n te n sit y Wavelength (nm)
Figure 1. Evolution of the SHG signal versus the excitation intensity. The solid lines
are fits considering a square power law of the experimental data recorded in the LT (blue open circles) and HT (red open dots) phases. The inset displays the evolution of the SHG spectra in the HT phase.
1.1 1.2 1.3 1.4 1.5 1.6 0.000 0.002 0.004 0.006 0.008 0.010 0.012 HT LT
I
Rb M n F e I
ZnSe (µm)
Figure 2. Spectral evolution of the SHG signal in the LT (blue open circle) and HT
(red open circles) phases. The lines are just a guide for the eyes. The signals have been calibrated against SHG signal recorded in a ZnSe polycrystalline window.
In Figure 2, we have plotted the evolution of the ratio of the SHG signal recorded in our sample against the SHG signal recorded in ZnSe. These measurements have been performed fixing the intensity of the excitation pulse to ~5 µJ.mm-2. The SHG signal in the HT phase is almost always larger than the SHG in the LT phase. In the HT phase, one can notice the occurrence of a sharp peak of the SHG signal centered at1.47 µm. In the LT phase the amplitude of this peak is decreased and it position is shifted to 1.52 µm. We have repeated this experiment many times and we always recorded the occurrence of these SHG peaks.
The SHG signal generated by a microcrystal of size r of our sample writes:[15] (1)
Where I(), , k are the intensity of the exciting pulse, the second-order optical susceptibility of our sample, the absorption coefficient of SHG signal and the phase mismatch, respectively. For SHG the phase mismatch writes k=2(n-n)/cwhere n and naretheindices of the crystallite at fundamental and second
harmonic pulsations, respectively. Equation 1 holds when r</k and r<<1. From an ensemble of micro crystallites randomly oriented within a single layer, the SHG signal writes NRbMnFe Iv(2,r)
where NRbMnFe is the number of crystallite per unit surface.[16] Hereafter,
we will consider the sample can be modeled as a set of layers of crystallites. Accordingly it can be shown that the SHG signal reflected by an infinite number of layers of crystallites writes (see supporting information): (2) With * (3)
where R(2), T() and T(2) are the reflection of the SHG frequency and the transmission of the fundamental and SHG frequency by crystallite interfaces, respectively. The latter expression is slightly different from the one we previously derived.[7] It now takes into account the multiple reflection of the SHG signal by the different interfaces. Equations 1-3 stress that the SHG signal strongly depends on the indices and absorption of the studied material at the second harmonic wavelength (). 1.1 1.2 1.3 1.4 1.5 1.6 0 100 200 300 400 500 600 700 0.50 0.75 1.00 1.25 1.50 0 2 4 6 HT LT C o h e r e n c e l e n g th ( µ m ) (µm) (a) HT LT A b so r p tio n ( µm -1 ) (µm) (b)
Figure 3: Evolution of the coherence length (a) and the absorption (b) of the sample in the LT (blue line) and HT (red line) phases
The evolution of the absorption and refractive index of this material in the 0.3 µm-0.8 µm spectral range has been previously reported.[11] With a polynomial fit we extended these data in the 1.1 µm to 1.8 µm spectral range. This approximation is valid if the sample is weakly absorbing in this spectral range. To ensure this latter approximation holds, we performed a FTIR spectrum of a thin pellet of our sample. This measurement indicates the absorption is indeed weak in the latter spectral range. Hence, we were able to compute the evolution of the coherence length Lc=/k for our sample in both the LT and HT phase.
The evolution of and Lc are displayed in Fig. 3a-b. In agreement with
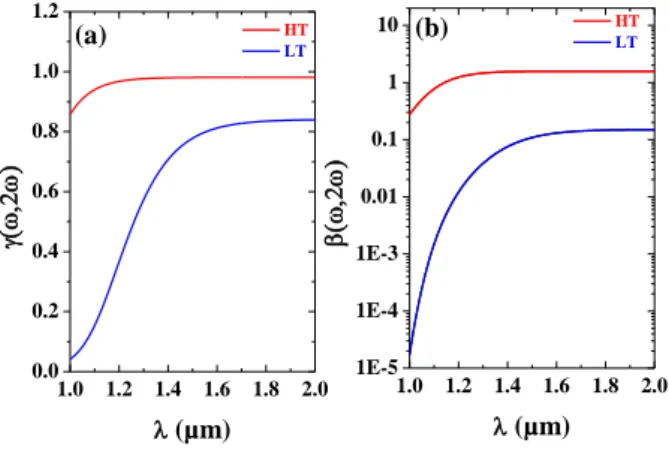
coherence length. Figure 3b indicates that in the LT phase the sample exhibits an intense absorption peak centered at ~460 nm, likely due to the intervalence transfer band from the MnIII-NC-FeII to MnII-NC-FeIII and Jahn–Teller distorted MnIII. Knowing the size, the index of refraction and the absorption of the crystallite and considering the second-order susceptibility of our sample is similar in the LT and HT phases, in Fig. 4 we have plotted the theoretical evolution of the ) and ), as one tunes the central frequency of the exciting laser pulse. In the HT phase, the coherence length is large compared to the size r of the crystallites, hence HT) is ~1. Similarly
HT), which replicates the SHG reflection coefficient of the
powder, is ~1.7 and it decreases as one tunes the excitation wavelength towards 1 µm. As displayed in Figure 3, in the LT phase the coherence length is small. As one decreases the excitation wavelength, the latter further decreases and it becomes comparable to the size r of the crystallite. Hence, LT) <1 and it starts to decrease above
~1.6 µm. The larger absorption of the sample in the LT phase also impacts the parameter LT) which, in the studied spectral range,
is always smaller than 0.2. Furthermore, as one tunes the excitation wavelength below 1.6 µm, it drops abruptly and it becomes smaller than 10-4 at =1.05 µm HT LT 1.0 1.2 1.4 1.6 1.8 2.0 1E-5 1E-4 1E-3 0.01 0.1 1 10 1.0 1.2 1.4 1.6 1.8 2.0 0.0 0.2 0.4 0.6 0.8 1.0 1.2 (b) (µm) (µm) HT LT (a)
Figure 4: Theoretical evolution of (a) ) and (b) ) coefficients of the sample in the LT (blue line) and HT (red line) phases.
As already mentioned, we calibrated the SHG signal produced by our sample against a ZnSe polycrystalline window. The SHG signal produced in reflection by the air-ZnSe interface writes:[10]
(4)
Where I(), , Lc, NZnSe are the intensity of the exciting pulse, the
second-order optical susceptibility of ZnSe, the coherence length and the number of crystallite per unit surface, respectively. For SHG in reflection, the phase mismatch writes
and where n and nareindices of the ZnSe at fundamental () and
second harmonic wavelength (), respectively. To compute the coherence length Lc for SHG in reflection in ZnSe, we used the
dispersion formula proposed by Marple.[17] Its evolution versus the excitation wavelength is plotted in Fig. 5a. It is worth mentioning that in the studied spectral range, Lc is very small and about 20.
Accordingly, the attenuation of the SHG signal over such a small length is negligible. Figure 5a displays the surface SHG signal produced considering the intensity of the exciting pulse is constant and the dispersion of the susceptibility is negligible.[18] The coherence length and consequently the SHG signal are found to decrease as we tuned the central wavelength of the exciting pulse towards 1 µm.
1.0 1.2 1.4 1.6 1.8 2.0 0.04 0.05 0.06 0.07 0.08 0.09 0.10 0.11 1.0 1.2 1.4 1.6 1.8 2.0 0.000 0.002 0.004 0.006 0.008 0.010 0.012 ZnSe C o h e r e n c e l e n g th ( µ m ) (µm) (b) S H G ( a .u .) (µm) (a) ZnSe
Figure 5: Theoretical evolution of (a) the SHG signal produced in reflection and (b)
the coherence length in ZnSe polycrystalline window.
Our experimental set-up makes it possible to directly compare the SHG signal produced by either our sample or the ZnSe window. According to Equation 2 and 4, it can be easily shown that:
(5)
The latter equation indicates that keeping the same experimental conditions, one can evaluate the optical susceptibility measuring the SHG signal produced by our sample and ZnSe window provided that we know , Lc, r, , , NZnSe/NRbMnFe. Hereafter,
we will consider that NZnSe/NRbMnFe~1. Note that in comparison to ZnSe,
the concentration of our very slightly compacted RbMnFe sample is likely less. Hence according to Equation 5, we are underestimating the value of the . Figure 6 displays the evolution of versus the wavelength in the LT and HT phases.
1.1 1.2 1.3 1.4 1.5 1.6 0 1 2 3 0 1 2 3 (2) xyz(LT) (2) xyz(HT) SHG Absorption LT SHG Absorption HT A b so r p ti o n (µm -1 ) (2 ) xyz p m .V -1 ) (µm)
Figure 6: Spectral evolution of the amplitude of in the LT (blue dot) and HT (red dot) phases. The dotted line displays the evolution of the absorption of the SHG signal in the LT (blue line) and HT (red line) phases.
One can notice that the increase of the SHG signal recorded at~1.5 µm in the LT and HT phases do not noticeably impact the spectral dispersion of . In the HT phase and over the scanned spectral range we measured ~0.03±0.01 pm.V-1. This value is very close to the one previously published for this sample and it indicates that two-photon absorption which has been considered by previous authors in second and third harmonic generation experiments are likely negligible in our sample.[7,19,20] However in the LT phase,
presents a clear dispersion. Below 1.2 µm, it rapidly increases, and at 1.1 µm it is ~2.7±0.3 pm.V-1. This increase is directly linked to the increase of the absorption of the SHG signal by the sample in the LT phase (dotted blue line in Fig. 6) and it is well known to give rise to resonant enhancement of the second-order nonlinear optical susceptibility[10].
THz spectroscopy and THz generation
0 2 4 6 -3 0 3 S ig n a l (n A ) Delay (ps) Initial THz pulse Transmission in LT phase Transmission in HT phase
Figure 7: Transmitted THz pulse recorded without the sample (black line) and with
the sample in the LT (blue line) and HT (red line) phases.
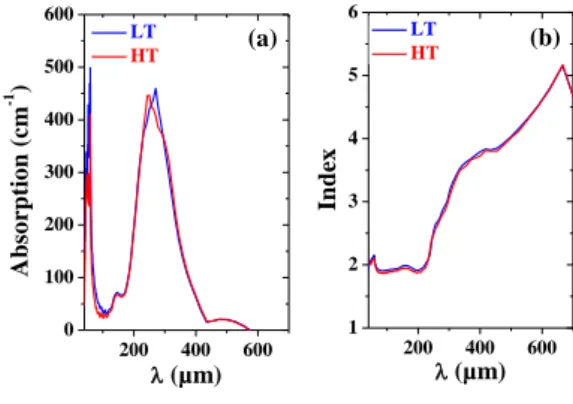
The temporal evolution of the THz pulse used to perform THz-TDS of our sample is displayed in Figure 7. As evidenced in Fig. 7, the transmission of this pulse by the sample is different in the LT and HT phases. Knowing the thickness of the sample, the analysis of the THz signals presented in Fig. 8 makes it possible to directly evaluate the index of refraction and the absorption of the sample in the LT and HT phases 200 400 600 1 2 3 4 5 6 200 400 600 0 100 200 300 400 500 600 In d ex (µm) LT HT (b) A b so rp tio n ( cm -1 ) (µm) LT HT (a)
Figure 8: Evolution of the absorption (a) and index (b) of refraction of the sample in the LT (bue line) and HT (red line) phases.
In both the LT and HT phase the sample exhibits two strong absorption bands centered at 270 µm and 54 µm, respectively. These peaks, likely related to far infrared lattice modes of the sample, induce a large absorption of the THz signal. However one can notice that they are spectral windows where the transmission of the signal remains large. For instance when >400 µm and for ~100 µm the absorption of our sample is strongly reduced. This indicates that in these spectral domains, a THz signal generated within our 300 µm thick sample may be efficiently transmitted. One can also notice that in the far infrared (>500 µm) the index of refraction the sample can be as large as 5. It
rapidly decreases as the wavelength decreases and it is ~1.9 below =200 µm. Over all the spectral range displayed in Figure 8b, the phase matching condition for THz generation is not satisfied. It requires that the index nTHz of the sample in the THz spectral range
equals the group index of the exciting pulse. The latter writes ng
=n-dn/d where n and are the index and the wavelength in the optical range. For our sample, the group index at the excitation wavelength in the LT (ng~1.42) and HT (ng~1.32) phases is always smaller than the
index nTHz of the sample the THz spectral range. However, it is
important to indicate that the coherence length Lc=THz/[2(nTHz-ng)] for
THz generation is always larger than the size (~2.1 µm) of the crystallites used to prepare the pellet. The THz signal produced by exciting the sample with the 160 fs pulses centered at =1.1 µm and detected by the Golay’s cell is displayed in Figure 10.
0 5 10 15 20 25 30 0 50 100 150 200 250 T H z S ig n a l (a .u .) LT HT E (µJ)
Figure 9: Evolution of the THz signal versus the excitation intensity. The solid lines are fits considering a square power law of the experimental data recorded in the LT (blue open circle) and HT (red open circle) phases.
THz generation is a second-order nonlinear process. Hence, the THz signal displays quadratic evolution versus the excitation intensity. In Figure 9, one can also notice that the THz signal in the LT phase is slightly larger than in the HT phase. When the energy of the excitation pulse is ~2.2 µJ, the calibration of our Golay’s cell indicated that the energy of the THz pulse is ~0.11 nJ. This corresponds to a conversion efficiency of 5.10-5. This value has to be compared to conversion efficiency (~10-5) achieved under the phase matching condition when one excite a 1 mm thick <110> cut ZnTe crystal with 120 fs pulses having a similar peak power centered at =800 nm. Hence, this experiment indicates that the nonlinear coefficient of this material in the THz range in both the LT and HT phases is, at least, larger than the nonlinear coefficient of ZnTe crystal ( >100 pm/V). This latter value is very large compared to the nonlinear coefficient we measured for SHG. Here again, this enhancement may results from the very large absorption of our sample in the THz spectral range.
Optical modulation of the second-order nonlinear optical properties.
One of the interesting properties of the cyano-bridged coordination polymer RbxMn[Fe(CN)6](x+2)/3 z H2O is that it can be photo-switched
from the LT phase to the HT phase within the thermal hysteresis loop. We have recently shown this makes it possible to optically photo-switch its third-order nonlinear optical properties.[7] Since the second-order nonlinear properties of these compounds are different in the LT and HT phase, it should be also possible to record a modulation of their second-order nonlinear properties as the sample is switched from the LT phase to the HT phase. To demonstrate this phenomenon we performed an experiment very similar to the one we realized to
demonstrate the photo-switching of the third-order nonlinear optical properties of Rb0.94Mn[Fe(CN)6]0.98.0.3H2O.[7] The sample was initially
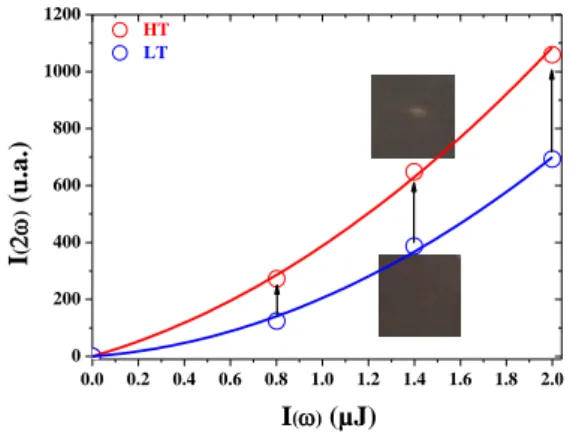
set in the LT phase at 285 K. The SHG signal was then recorded, exciting the sample at λ=1400 nm by varying the energy of the exciting pulse in between 0.1 µJ and 2.0 µJ. Afterwards, we increase the energy of the pulse to ~10 µJ. After several seconds, when a sequence of these more powerful pulses is used, the color of the area excited by these pulses turned from dark brown to light brown (inset Fig. 10). This indicates the sample, likely heated by the laser beam, is switched from the LT phase to the HT phase. To confirm that the sample was indeed in the HT phase, we reduced the energy of the laser pulses from 10 µJ to 0.1–1.5 µJ and recorded the SHG signals for these lower energies. These SHG signal were then compared to the SHG signals we previously recorded under the same experimental condition when the sample was set in the HT phase. Figure 10, indicates the amplitude of these two SHG signals recorded at T=285 K are almost similar. This indicates that indeed we have switched the sample from the LT to the HT phase. Then, cooling the sample with a nitrogen jet, we could bring it back in the LT phase where the sample recovered its dark brown color. The amplitude of the SHG signal is then almost identical to the one we recorded at the beginning of this experiment. Repeating this experiment many times, we could reproduce these results. This experimental proof of concept indicates that one is indeed able to photo-switch back and forth the second-order nonlinear optical properties of this sample from the LT phase to the HT phase.
0.0 0.2 0.4 0.6 0.8 1.0 1.2 1.4 1.6 1.8 2.0 0 200 400 600 800 1000 1200 I() (µJ) I ( ) ( u .a .) HT LT
Figure 10 : Solid lines evolution of the SHG signal versus the energy of the exciting
pulse. The dots corresponds to the SHG signal before (blue open dots) and after (red open dots) photo-switching from the LT to the HT phase. Cooling the sample in the LT phase, we were able to reproduce this experiment more than ten times without significant evolution of the SHG signal
Conclusions
The ensemble of results presented in this manuscript indicates that Rb0.94Mn[Fe(CN)6]0.98.0.3H2O cyano-bridged coordination polymer
exhibits original linear and second-order nonlinear optical properties. Within the broad thermal hysteresis loop of this compound around room temperature, we have characterized its linear properties in the THz frequency range using THz-TDS and determined its second-order nonlinear properties in the near IR and THz ranges performing SHG and THz generation, respectively. We have shown that, in the THz frequency range this compound as a high index of refraction that decreases almost steadily from ~5 to ~2 as the wavelength decreases from 700 µm down to 50 µm. We have shown it also exhibits a high and broad absorption peak centered at ~300 µm and a useful transparency range at higher and lower wavelengths. In the HT phase and in the near IR spectral range the amplitude of the second-order
susceptibility is low and ~0.03±0.01 pm.V-1. Its amplitude increases in the LT phase and it is ~2.7±0.3 pm.V-1 at 1.1 µm. This latter phenomenon is associated to the resonant enhancement of the
close to a broad and intense absorption peak centered at ~460 nm, likely due to the intervalence transfer band from the MnIII-NC-FeII to MnII-NC-FeIII and Jahn–Teller distorted MnIII. We have also demonstrated that in the THz frequency range this compound exhibits a high second-order optical nonlinearity comparable to ZnTe that makes possible to record THz generation when this material is excited with femtosecond laser pulses. Finally, we have also evidenced that one can photo-switch the linear and nonlinear optical properties of this compound within its thermal hysteresis loop. This opens the possibility to modulate the amplitude of the nonlinear properties of this material.
Experimental Section
Sample preparation and characterization
The preparation and characterization of Rb0.94Mn[Fe(CN)6]0.98.0.3H2O has
previously been described elsewhere.[6] The sample we used consists in powder
of cubic micro-crystals with a size of 2.1±0.7 µm. For the SHG measurements, the powder was inserted in between two microscope slides, gently pressed, and heated at 330 K. For the THz spectroscopy and THz generation, we pressed the powder using a pressure of 4 kN to prepare a 300 µm thick pellet. After preparation, the pellet was also heated at 330 K. As displayed in Fig. 11, when the temperature is decreased from 330 K to 200 K, the color of our sample changes from light brown to dark brown.
180 200 220 240 260 280 300 3.0 3.5 4.0 4.5 5.0 5.5 6.0 LT phase HT phase
MT
/
K
c
m
3m
o
l
-1Temperature (K)
Figure 11. Hysteresis loop of the sample revealed by the MT-T plots. The insets
show that in the LT and HT phase the color of the sample is dark brown and light brown, respectively.
As the temperature of the sample is decreased, the sample experiences a structural phase transition from the HT phase (cubic ) to the LT phase (tetragonal ). Figure 11 also shows that this structural transition is associated to a broad thermal hysteresis loop which extends in between T~310 K and T~210 K. The change of color of the sample is associated to the shift of a broad absorption band of the compound in the visible spectral range. In the HT phase, a broad and intense absorption peak centered at ~460 nm, likely due to the intervalence transfer band from the MnIII-NC-FeII to MnII-NC-FeIII and Jahn–
Teller distorted MnIII is recorded.[11] In the LT phase, this absorption peak is
shifted toward ~410 nm and its amplitude decreases. The latter absorption has been assigned to the ligand-to-metal charge transfer (LMCT) transition of [FeIII(CN)
6].[11] The index of refraction is also sensible to this structural phase
change. In the near infrared spectral range, the index of refraction which is ~1.32 in the HT phase increases to ~1.42 in the LT phase.[7,11] As shown in this
manuscript, the changes of the absorption coefficient and the index of refraction
Experimental set-up
The experimental set-up we used to perform our SHG experiments has been presented elsewhere.[7] The sample was excited by 160 femtosecond (fs) pulses yielded by an optical parametric amplifier (OPA), which has a central wavelength tunable from 1100–2400 nm. At the exit of the OPA, an infrared (IR) glass filter is inserted. It transmits the IR pulses produced by the OPA and blocks the visible light produced within this system. The laser pulse is then slightly focused by a lens L1 onto the sample over a beam waist of 235 µm, and
its maximal energy is 2 µJ. Due to the thickness of our sample, no SHG signal was detected in transmission. The SHG signal generated at the surface of the sample was collimated by the lens L2 and focused by the lens L3 on the entrance
slit of a spectrometer in front of which we inserted a colored glass filter F2. The
latter transmits the visible light and blocks the infrared excitation pulse. The spectrum transmitted by the spectrometer was recorded by a thermally cooled charge coupled detector (CCD).
The THz set-up we used to perform the THz time domain spectroscopy (TDS) has been described elsewhere.[21] In short, a THz beam consisting in a single-cycle THz wave is emitted in air ionized by the fundamental and the second harmonic of 50 fs pulses centered at =800 nm. After transmission through the sample, this wave is measured by electro-optical (EO) sampling in a 200 µm-thick <110> GaP crystal. This THz detection system records the temporal profile of the electric field of the THz pulses which makes it possible to recover the complex index of refraction of the studied sample on a 0.3–7 THz frequency range. However, this method implies to perform two measurements. We first record a reference waveform ER(t) without the sample and then a signal
waveform ESLS,HS with the sample in the LS and HS state, respectively. The Fourier components of the two signals are obtained through a Fourier transform and define the complex transmission function of the sample, equal to the ratio of the output amplitude spectrum to the input of the reference spectrum. The latter is directly related to the complex refractive index of the sample or to the frequency-dependent complex dielectric constant of the sample. It also makes it possible to retrieve the absorption spectrum of the sample.[21,22]
For the THz generation experiment, a 300 µm thick pellet was excited by the 160 fs pulses centered at =1.1 µm provided by the OPA. The THz wave was generated without focusing the exciting pulses. It was collected and focused on the detector (a Golay’s cell) by two 20 cm focal length, gold-coated, off-axis parabolic mirrors. To prevent any signal due to diffusion of the exciting beam, a silicon wafer and Teflon sheet were inserted in front of this detector. The THz wave generated by the sample was modulated by a chopper and the detector was connected to a lock-in amplifier. We checked that without the sample no signal was detected.
To run the SHG experiment the sample was held in a thermally controlled cold finger in which the temperature is set at T=290 K. To set the sample in the HT phase, it was heated up to 330 K. It was then slowly cooled down to T=290 K. As the sample switches from the LT phase to the HT phase its color turns from dark brown to light brown. To bring the sample back in LT phase, it is cooled for several minutes by means of a nitrogen jet and slowly heated back to T=290 K. During this process, the color of the sample switches from light brown to dark brown.
____________
[1] M. Liu, H. S. Quah, S. Wen, Z. Yu, J. J. Vittal, W. Ji, Chem. Mater. 2016, 28,
3385–3390.
[2] M. Liu, H. S. Quah, S. Wen, J. Wang, P. S. Kumar, G. Eda, J. J. Vittal, W. Ji,
J Mater Chem C 2017, 5, 2936–2941.
[3] R. Medishetty, J. K. Zaręba, D. Mayer, M. Samoć, R. A. Fischer, Chem Soc
Rev 2017, 46, 4976–5004.
[4] T. Nuida, T. Matsuda, H. Tokoro, S. Sakurai, K. Hashimoto, S. Ohkoshi, J.
Am. Chem. Soc. 2005, 127, 11604–11605.
[5] K. Ikeda, S. Ohkoshi, K. Hashimoto, Chem. Phys. Lett. 2001, 349, 371–375.
[6] S. Ohkoshi, S. Saito, T. Matsuda, T. Nuida, H. Tokoro, J. Phys. Chem. C
2008, 112, 13095–13098.
[7] A. Ould-Hamouda, A. Iazzolino, H. Tokoro, S. Ohkoshi, E. Freysz, Opt.
Mater. Express 2017, 7, 444.
[8] J. K. Zaręba, J. Szeremeta, M. Waszkielewicz, M. Nyk, M. Samoć, Inorg.
Chem. 2016, 55, 9501–9504.
[9] M. Ōtsu, Ed. , Chemical, Biological, and Nanophotonic Technologies for
Nano-Optical Devices and Systems, Springer, Berlin, 2010.
[10] R. W. Boyd, Nonlinear Optics, Academic Press, Amsterdam ; Boston, 2008.
[11] S. Ohkoshi, T. Nuida, T. Matsuda, H. Tokoro, K. Hashimoto, J. Mater. Chem.
2005, 15, 3291.
[12] S. Vidal, J. Degert, M. Tondusson, E. Freysz, J. Oberlé, J. Opt. Soc. Am. B
2014, 31, 149.
[13] S. Vidal, J. Degert, J. Oberlé, E. Freysz, J. Opt. Soc. Am. B 2010, 27, 1044.
[14] S. Vidal, J. Degert, M. Tondusson, J. Oberlé, E. Freysz, Appl. Phys. Lett.
2011, 98, 191103.
[15] Y. Zhang, J. Ortega, U. Baumeister, C. L. Folcia, G. Sanz-Enguita, C. Walker,
S. Rodriguez-Conde, J. Etxebarria, M. J. O’Callaghan, K. More, J. Am. Chem.
Soc. 2012, 134, 16298–16306.
[16] S. K. Kurtz, T. T. Perry, J. Appl. Phys. 1968, 39, 3798–3813.
[17] D. T. F. Marple, J. Appl. Phys. 1964, 35, 539–542.
[18] H. P. Wagner, M. Kühnelt, W. Langbein, J. M. Hvam, Phys. Rev. B 1998, 58,
10494.
[19] J. K. Zaręba, M. J. Białek, J. Janczak, M. Nyk, J. Zoń, M. Samoć, Inorg.
Chem. 2015, 54, 10568–10575.
[20] J. K. Zaręba, J. Janczak, M. Samoć, M. Nyk, Dalton Trans 2017, 46, 9349–
9357.
[21] B. Viquerat, J. Degert, M. Tondusson, E. Freysz, C. Mauriac, J. F. Létard,
Appl. Phys. Lett. 2011, 99, 061908.
[22] P. Mounaix, N. Lascoux, J. Degert, E. Freysz, A. Kobayashi, N. Daro, J.-F.