HAL Id: hal-00301729
https://hal.archives-ouvertes.fr/hal-00301729
Submitted on 26 Aug 2005HAL is a multi-disciplinary open access
archive for the deposit and dissemination of sci-entific research documents, whether they are pub-lished or not. The documents may come from teaching and research institutions in France or abroad, or from public or private research centers.
L’archive ouverte pluridisciplinaire HAL, est destinée au dépôt et à la diffusion de documents scientifiques de niveau recherche, publiés ou non, émanant des établissements d’enseignement et de recherche français ou étrangers, des laboratoires publics ou privés.
The transport history of two Saharan dust events
archived in an Alpine ice core
H. Sodemann, A. S. Palmer, C. Schwierz, M. Schwikowski, H. Wernli
To cite this version:
H. Sodemann, A. S. Palmer, C. Schwierz, M. Schwikowski, H. Wernli. The transport history of two Saharan dust events archived in an Alpine ice core. Atmospheric Chemistry and Physics Discussions, European Geosciences Union, 2005, 5 (4), pp.7497-7545. �hal-00301729�
ACPD
5, 7497–7545, 2005 Transport history of Saharan dust H. Sodemann et al. Title Page Abstract Introduction Conclusions References Tables Figures J I J I Back Close Full Screen / EscPrint Version Interactive Discussion
EGU
Atmos. Chem. Phys. Discuss., 5, 7497–7545, 2005 www.atmos-chem-phys.org/acpd/5/7497/
SRef-ID: 1680-7375/acpd/2005-5-7497 European Geosciences Union
Atmospheric Chemistry and Physics Discussions
The transport history of two Saharan dust
events archived in an Alpine ice core
H. Sodemann1, A. S. Palmer2,*, C. Schwierz1, M. Schwikowski2, and H. Wernli1,3
1
Institute for Atmospheric and Climate Science, ETH Zurich, Switzerland
2
Paul Scherrer Institute, Villigen, Switzerland
3
Institute for Atmospheric Physics, University of Mainz, Germany
*
now at: University of Tasmania, Tasmania, Australia
Received: 6 July 2005 – Accepted: 15 July 2005 – Published: 26 August 2005 Correspondence to: H. Sodemann (harald.sodemann@env.ethz.ch)
© 2005 Author(s). This work is licensed under a Creative Commons License.
ACPD
5, 7497–7545, 2005 Transport history of Saharan dust H. Sodemann et al. Title Page Abstract Introduction Conclusions References Tables Figures J I J I Back Close Full Screen / EscPrint Version Interactive Discussion
EGU
Abstract
Mineral dust from the Saharan desert can be transported across the Mediterranean towards the Alpine region several times a year. Occasionally, the dust is deposited with snowfall on Alpine glaciers and appears then as yellow or red layers in ice cores. Two such significant dust events were identified in an ice core drilled at the
high-5
accumulation site Piz Zup ´o in the Swiss Alps (46◦220N, 9◦550E, 3850 m a.s.l.). From stable oxygen isotopes and major ion concentrations, the events were approximately dated as October and March 2000. In order to link the dust record in the ice core to the meteorological situation that led to the dust events, a novel methodology based on back-trajectory analysis was developed. It allowed for the identification of source
10
regions, the atmospheric transport pathways, and wet deposition periods for both dust events. Furthermore, differences in the chemical signature of the two dust events could be interpreted with respect to contributions from the dust sources and aerosol scaveng-ing durscaveng-ing the transport.
The dust deposition during the October event took place during 13–16 October 2000.
15
Mobilisation areas of dust were mainly identified in the Algerian and Libyan deserts. A combination of an upper-level potential vorticity streamer and a midlevel jet across Al-geria first brought moist Atlantic air and later mixed air from the tropics and Saharan desert across the Mediterranean towards the Alps. The March event consisted of two different deposition phases which took place during 18–20 and 23–26 March 2000.
20
The first phase was associated with an exceptional transport pattern past Iceland and towards the Alps from northerly directions. The second phase was similar to the Oc-tober event. A significant peak of methanesulphonic acid associated with the March dust event was most likely caused by incorporation of biogenic aerosol while passing through the marine boundary layer of the western Mediterranean during a local
phyto-25
plankton bloom. From this study, we conclude that the whole sequence of mobilisation, transport, and deposition of mineral aerosol should be considered for a detailed under-standing of the chemical signal recorded in the ice core at Piz Zup ´o.
ACPD
5, 7497–7545, 2005 Transport history of Saharan dust H. Sodemann et al. Title Page Abstract Introduction Conclusions References Tables Figures J I J I Back Close Full Screen / EscPrint Version Interactive Discussion
EGU
1. Introduction
Dust plays a significant role in the global climate system. It influences the radiative properties of the atmosphere, plays a complex role in cloud formation, and is an im-portant source of nutrients in biogeochemical cycles (Prospero and Lamb,2003). The Saharan desert is the most important natural source of dust (Goudie and Middleton,
5
2001). Frequently, Saharan dust is ejected into the Mediterranean atmosphere (Moulin
et al.,1998). In some instances, Saharan dust has been transported as far as northern Scandinavia (Franz ´en et al.,1995). More commonly, Saharan dust may reach central Europe and in particular the Alpine region up to several times a year. Prodi and Fea
(1978, 1979) inferred Saharan dust events in the Italian Alps from air filter samples,
10
and identified typical synoptic situations which are associated with this dust transport pathway.
Precipitation that contains scavenged Saharan dust is known as “red rain” or “yel-low snow” in some areas. Along with the colour, the dust load strongly imprints upon the precipitation chemistry. Several investigations focused on the identification of the
15
source areas of dust from these chemical characteristics. By analysing “red rain” in northeastern Spain, Avila et al. (1997) detected differences in the mineralogical and soluble ion chemistry composition for different source regions in northern Africa. Dur-ing a large Saharan dust event in the Alps, Schwikowski et al. (1995) found charac-teristic mass concentrations of dust-related ions in aerosol and precipitation samples
20
to be consistent with mineralogical indicators and back-trajectory analysis. At higher elevation sites, scavenged Saharan dust may be deposited as snow, buried as distinct layers in firn and ultimately preserved in glaciers. Wagenbach and Geis(1989) used this fact to identify Saharan dust events in an ice core retrieved from a glacier in the Swiss Alps. Hence, given that the age of the ice can be determined accurately, ice
25
cores can be used as an archive of such Saharan dust events.
The chemical composition of the mineral aerosol can differ largely between individual dust events. Usually, these differences are attributed to characteristics of the various
ACPD
5, 7497–7545, 2005 Transport history of Saharan dust H. Sodemann et al. Title Page Abstract Introduction Conclusions References Tables Figures J I J I Back Close Full Screen / EscPrint Version Interactive Discussion
EGU
mobilisation areas of dust (Bergametti et al.,1989;Avila et al., 1997; Claquin et al.,
1999). However, a dust plume may also be chemically altered during its transport to the deposition site, for example by the uptake of predominantly marine compounds such as sodium (Na+) and chloride (Cl−) over the ocean (Schwikowski et al.,1995), or by predominantly anthropogenic pollutants, such as ammonium (NH+4), residing in the
5
boundary layer (BL) (Jones et al.,2003). Other aerosols, such as the exclusively ma-rine biogenic compound methanesulphonic acid (MSA, CH3SO3H) may even provide information on ocean-atmosphere interaction. It is therefore essential to consider the complete transport history of dust-laden air parcels to gain a detailed understanding of the chemical signal of a specific dust event in the ice core. This comprises three
10
distinct stages in the life cycle of a dust event, namely dust mobilisation at the source area, dust transport according to the specific meteorological situation, and finally dust deposition at the observation site. All three of these stages are characterised by spe-cific meteorological conditions and processes.
Back-trajectory analysis has been used as a tool for studying the transport history
15
of dust in a number of studies (e.g.Schwikowski et al., 1995;Avila et al., 1997;
Col-laud Coen et al.,2004;Bonasoni et al.,2004;Barkan et al.,2005). Most of these stud-ies, however, inferred dust source regions directly from the horizontal position of an air parcel several days before arrival. Here, we propose an extension to conventional back-trajectory analyses. Our new methodology is based on back-trajectories, yet in
20
addition makes use of meteorological information along the air parcels’ flight paths. By means of objective selection criteria, locations are extracted where dust mobilisation, chemical interaction, and wet deposition are likely to occur during dust transport, ac-cording to the specific meteorological conditions. This extended back-trajectory study provides a closer link between (i) the meteorological processes leading to mobilisation,
25
transport, and deposition of a dust plume, and (ii) the chemical signal at the deposition site, than would be possible with the use of backward trajectories alone. This approach can be considered as a first step towards explicit Lagrangian dust transport modelling. In this study, we reconstruct the transport history of two large dust events which
ACPD
5, 7497–7545, 2005 Transport history of Saharan dust H. Sodemann et al. Title Page Abstract Introduction Conclusions References Tables Figures J I J I Back Close Full Screen / EscPrint Version Interactive Discussion
EGU
were recorded in an ice core drilled at Piz Zup ´o in the Swiss Alps. The ice core sec-tion attributed to the year 2000 showed two episodes of pronounced concentrasec-tions of dust tracers (e.g. Ca2+). We interpret the chemical signatures of these two dust events by means of the extended back-trajectory analysis outlined above. Thereby, we aim to enhance the understanding of the chemical fingerprints left in the ice core by
5
specific meteorological processes. Today’s high-quality meteorological data and satel-lite observations provide an ideal opportunity to investigate how recent Saharan dust events become preserved in an ice core. Ultimately, a better understanding of these processes could provide important keys on how to interpret whole ice core records as archives of the frequency and amplitudes of past Saharan dust events.
10
2. Data
2.1. Ice core sites and analysis
In March 2002, the 43 m long Piz Zup ´o ice core, corresponding to ∼29 m water equiv-alent (w.e.), was retrieved from the high-altitude site Piz Zup ´o (46◦220N, 9◦550E, 3850 m a.s.l.) in the Swiss Alps (Fig.1). The drilling site was located on the saddle
15
between Piz Zup ´o and Piz Argient, and was exposed to advection from north-westerly and south-easterly directions.
The ice core was examined in the freezer (−20◦C) at the Paul Scherrer Institute prior to decontamination procedures. Length, diameter, density and visual features (dust layers and ice lenses) of the individual core sections were noted. Ice core
sec-20
tions were then cut into 4–5 cm sections using established techniques (Eichler et al.,
2000). The samples were analysed for a suite of anions and cations (F−, CH3COO−, CHOO−, CH3SO−3, Cl−, NO−3, SO2−4 , C2O2−4 , Na+, NH+4, K+, Mg2+, Ca2+) using ion chromatography. Furthermore, the oxygen isotope ratio, δ18O, was measured using stable isotope ratio mass spectrometry at the Paul Scherrer Institute. More details
25
on the procedures used for decontamination and analysis of these ice cores and the 7501
ACPD
5, 7497–7545, 2005 Transport history of Saharan dust H. Sodemann et al. Title Page Abstract Introduction Conclusions References Tables Figures J I J I Back Close Full Screen / EscPrint Version Interactive Discussion
EGU
dating of the Piz Zup ´o ice core record are given elsewhere (Palmer et al., 20051).
2.2. Precipitation data
Precipitation data from three automated weather stations located in the vicinity of Piz Zup ´o were used as observational indicators of wet deposition at the glacier site (Fig.1). The Swiss station Piz Corvatsch (46◦250N, 9◦490E, 3015 m a.s.l.) is located on a ridge
5
∼10 km northwest of Piz Zup ´o ∼800 m lower than the ice-core drilling site. At this al-titude, reliable precipitation measurements are difficult due to frequent snowfall, and some rain shadowing during southerly flow may occur. Still, with respect to timing and intensity, the precipitation registered here should compare reasonably with the precip-itation at Piz Zup ´o itself. The two stations P41 and P42 are located at Alpe Entrova
10
(1905 m a.s.l.) and Funivia Bernina (2014 m a.s.l.), respectively, on the southern (Ital-ian) slope of the Bernina massif. These weather stations are likely to be influenced by orographic shadowing and congestion, and hence can show different precipitation magnitudes and timings to Piz Zup ´o, depending on the flow direction. All half-hourly precipitation data were aggregated into 6 h periods centered around 00Z, 06Z, 12Z,
15
and 18Z for better comparison with the other meteorological data. 2.3. Satellite imagery
The concentration of chlorophyll a (chlo-a) at the sea surface is a proxy for the bio-genic contribution to organic aerosol in the marine BL (O’Dowd et al., 2004), which via oxidative processes also includes MSA (Huebert et al.,2004). Hence, in this study
20
we used composite Sea-viewing Wide Field-of-view Sensor (SeaWiFS) chlo-a prod-ucts processed with the OC4v4 algorithm. One-week composites of chlo-a averaged
1
Palmer, A. A., Jenk, T., Schwikowski, M., Saurer, M., Schwerzmann, A., L ¨uthi, M., Funk, M., and G ¨aggeler, H. W.: A new ice core record from Piz Zupo, South-East Switzerland, in preparation, 2005.
ACPD
5, 7497–7545, 2005 Transport history of Saharan dust H. Sodemann et al. Title Page Abstract Introduction Conclusions References Tables Figures J I J I Back Close Full Screen / EscPrint Version Interactive Discussion
EGU
over the periods 07–14 October and 13–20 March 2000 were acquired from the Sea-WiFS Project Homepage (see http://oceancolor.gsfc.nasa.gov/cgi/level3.pl). Gaps in the weekly composite maps due to clouds were filled with the respective monthly mean values. The OC4v4 algorithm is known to systematically overestimate chlo-a concen-trations in oligotrophic areas in the Mediterranean (Bosc et al.,2004). Therefore, we
5
applied the regional bio-optical algorithm proposed byBricaud et al.(2002) to the chlo-a mchlo-aps of both periods, which by mechlo-ans of chlo-an empiricchlo-al relchlo-ationship decrechlo-ases OC4v4 chlorophyll a concentrations below 0.4 mg m−3by a factor of up to 2.5.
In addition, visible SeaWiFS imagery was acquired for the visual identification of dust plumes leaving the African continent. Finally, half-hourly Meteosat infrared (IR)
10
imagery processed by MeteoSwiss were used for the identification of cloud patterns and potential precipitation areas during the two study periods.
2.4. Meteorological data
ERA-40 reanalysis data (Simmons and Gibson, 2000) from the European Centre for Medium-range Weather Forecast (ECMWF) were the basis of the meteorological
anal-15
ysis and the back-trajectory calculations. The data were used on the original model levels and interpolated onto a regular grid at 1◦×1◦ resolution. Considered primary variables include horizontal and vertical wind velocities, temperature, and specific hu-midity. From these quantities, secondary variables like sea level pressure, potential temperature and potential vorticity were calculated.
20
3. Identification of the dust transport history
In this section, a novel algorithm for the analysis of dust transport is described. The method is based on back-trajectories, but in addition makes use of meteorological infor-mation along the flight paths, which allows for a stronger constraint on the identification of mobilisation and wet deposition periods of dust than from the more indetermined
25
ACPD
5, 7497–7545, 2005 Transport history of Saharan dust H. Sodemann et al. Title Page Abstract Introduction Conclusions References Tables Figures J I J I Back Close Full Screen / EscPrint Version Interactive Discussion
EGU
argument of back-trajectories crossing over a potential source area. 3.1. Back-trajectory calculations
For March and October 2000, three-dimensional kinematic trajectories originating from Piz Zup ´o at an 6-h interval were calculated for 10 days backward in time by means of the trajectory tool LAGRANTO (Wernli and Davies,1997). Together with the location of
5
the air parcels, additional atmospheric variables, namely relative humidity, the mixing ratio of water vapour, and wind velocity were traced and stored every 6 h.
In order to account for the inherent uncertainty of trajectory calculations, the back-trajectories were calculated as ensembles arriving within a specific arrival domain. Hor-izontally, arrival points of trajectories were set up as a 5-point cross with one central
10
arrival point at the location of Piz Zup ´o glacier, surrounded by four arrival points with an offset of 0.5◦ in the E, W, S, and N direction, respectively. Vertically, arrival levels rang-ing from 800 to 410 hPa (about 2 to 7 km a.s.l.) at intervals of 30 hPa were chosen. In total, ensembles comprising back-trajectories from 70 starting points were calculated daily at 00Z, 06Z, 12Z, and 18Z.
15
From the back-trajectories, possible areas of dust mobilisation are extracted by means of objective selection criteria. Due to the setup of the trajectory calculations, only air parcels are considered which ultimately arrive at Piz Zup ´o. First, air parcels are selected exhibiting conditions suitable for dust deposition at the arrival site, then they are traced backwards to identify the areas of potential dust mobilisation. Besides,
20
we always consider the dust mobilisation locations identified from this methodology as “potential” dust source regions, and try to verify these locations with observed data wherever possible.
3.2. Dust deposition
In order to become incorporated into a glacier as a dust layer, mineral aerosol has to
25
ACPD
5, 7497–7545, 2005 Transport history of Saharan dust H. Sodemann et al. Title Page Abstract Introduction Conclusions References Tables Figures J I J I Back Close Full Screen / EscPrint Version Interactive Discussion
EGU
removed from the air parcels by wet deposition (precipitation scavenging) or by dry de-position mechanisms. Wet dede-position of dust is considered to be far more effective than dry deposition (Schwikowski et al.,1995). Dry deposition due to gravitational settling is largest close to the mobilisation region of the mineral aerosol, and quickly decreases as dust is transported away (Duce et al.,1991). Wet deposition however is not
depen-5
dent on the distance from the mobilisation site. In fact,Osada et al.(2004) showed for a site in Japan that significant layers of mineral aerosol in snow can only form by wet deposition, typically when dusty air masses merge with precipitation-bearing frontal systems. Hence, we assume that wet deposition is most important for forming dust layers in snow at our Alpine site as well.
10
Consequently, in our back-trajectory analysis, we only considered those trajectories which experienced wet deposition at the arrival site. Precipitation, and therefore wet deposition was assumed to occur when the relative humidity (RH) of an air parcel exceeded 80% (Fig. 2). This threshold value follows the cloud and precipitation pa-rameterisation scheme incorporated in the ECMWF model. In addition, all air parcels
15
of a trajectory ensemble that arrive below the uppermost “precipitating” air parcel were considered as experiencing below-cloud scavenging of mineral aerosol. Furthermore, potential removal of the dust load was considered for air parcels with prolonged pre-cipitation prior to arrival at Piz Zup ´o.
Independent confirmation of potential scavenging of the dust plumes along the flight
20
path and at the arrival site was obtained from visually examining the cloud structure in Meteosat visible and IR imagery. Gravitational settling of particles along the transport path was not considered quantitatively in this study. However, for the interpretation of our results it will be taken into account that the potential dust load is likely to decrease with increasing travel time.
25
3.3. Dust mobilisation
An objective algorithm was developed to extract locations along the backward trajecto-ries where dust mobilisation potentially occurred (Fig.2). Criteria considered as
ACPD
5, 7497–7545, 2005 Transport history of Saharan dust H. Sodemann et al. Title Page Abstract Introduction Conclusions References Tables Figures J I J I Back Close Full Screen / EscPrint Version Interactive Discussion
EGU
vant for the mobilisation of dust are (i) the presence of dry, suspendible soil material, (ii) sparse vegetation cover, (iii) sufficiently high wind velocities near the ground, and (iv) strong updrafts which are able to lift the suspended material to a sufficient altitude for long-range transport (Shao and Leslie,1997). These criteria are typically considered as relevant in large-scale dust transport models (Tegen and Fung, 1994; Mahowald 5
and Dufresne,2004).
According to our interpretation, criteria (i) and (ii) are fulfilled when an air parcel is located over an area in Africa north of 10◦N where the vegetation map from DeFries
and Townshend (1994) shows one of the categories “bare”, “shrubs and bare soil”, or “cultivated”. Criterion (iii) is met when the air parcel is sufficiently close to the ground to
10
pick up mineral aerosol, i.e. within the assumedly well-mixed BL, the top of which was defined here as the 800 hPa isosurface (∼1.9 km a.s.l.). Additionally, the wind speed at the location of the air parcel within the BL has to be greater or equal to a mobilisation threshold of 10 m s−1. Sufficiently strong updrafts (criterion iv) are accounted for im-plicitly by the fact that the trajectories ultimately all arrive at Piz Zup ´o. Accordingly, our
15
algorithm identifies potential dust uptake locations along a trajectory if all these criteria are fulfilled. The criteria were checked every 6 h along each 10-day trajectory. Thereby, a single trajectory can be associated with and hence carry dust from several potential dust uptake locations.
Sensitivity analysis of the selection criteria showed that the dust uptake regions
de-20
pend only quantitatively on the mobilisation wind speed and boundary layer height, while the overall patterns remain the same. Currently, the aim of the proposed method-ology is to provide a qualitative view of dust mobilisation and transport. Further dust-related processes would have to be included to provide quantitative answers from these Lagrangian modelling efforts (Sect.7).
25
3.4. Linking dust transport to the meteorological conditions
The meteorological situation determining the transport of dust parcels was examined from time series of maps of various meteorological fields. Upper-level potential vorticity
ACPD
5, 7497–7545, 2005 Transport history of Saharan dust H. Sodemann et al. Title Page Abstract Introduction Conclusions References Tables Figures J I J I Back Close Full Screen / EscPrint Version Interactive Discussion
EGU
(PV) on the 320 K isentropic surface was used to identify the larger-scale synoptic situation. Horizontal wind velocities at 200 and 500 hPa served to highlight influences of upper-level jets on dust mobilisation and transport. Flow and moisture fluxes in the lower troposphere were characterised by the vertically averaged horizontal moisture flux 5 F = 1 ps− pt Zps pt q· |v |d p (1)
(with q being the mixing ratio in g kg−1, v the horizontal wind vector) between pressure level pt=700 hPa and the surface (ps), and wind vectors at 700 hPa. Finally, sea level pressure (SLP) and equivalent potential temperature (θe) at 850 hPa allowed identifi-cation of the synoptic situation and airmass differences at lower levels. Vertical
cross-10
sections of these meteorological fields together with the positions of the identified dust trajectories were useful to investigate potential interactions between dust clouds and the marine BL at selected times.
4. Ice core chemistry of dust events
Examination of the ice core’s δ18O and chemical records (particularly NH+4) shows
15
clear seasonal variations with high values during summer and low values in winter. Counting these annual cycles implied that the Piz Zup ´o ice core spans the time period 1991–2001 (±1 yr). The site has a relatively large annual accumulation (2.6 m w.e.) which allows for a high resolution analysis of the ice core chemistry. Initial study of the Piz Zup ´o record for the year 2000 showed two large Ca2+peaks, one at the start of the
20
accumulation period and the other at the end of the year (Fig.3). A number of smaller excursions in the Ca2+ record are observed between the two large events, but are not further examined here.
The first ice core event at a depth of 7.1–7.3 m w.e. had elevated levels for most chemical ions, especially CH3SO−3, Cl−, NO−3, SO2−4 , C2O2−4 , Na+, NH+4, K+, Mg2+,
25
ACPD
5, 7497–7545, 2005 Transport history of Saharan dust H. Sodemann et al. Title Page Abstract Introduction Conclusions References Tables Figures J I J I Back Close Full Screen / EscPrint Version Interactive Discussion
EGU
Ca2+, and H+. This event shows remarkably high concentrations of MSA, NO−3, and NH+4, for all three species they are largest within the 11-yr period from 1991–2001 covered by the ice core. δ18O was relatively low during this event. Prior to this event the isotopic signature and the chemical species were typical of winter conditions. Following this event these indicators were characteristic of spring-summer with increased δ18O
5
values and elevated concentrations of anthropogenic species. The total suspended particle (TSP) record from nearby Jungfraujoch (not shown) was also examined and two strong episodes with TSP values >20 µg m−3observed for the two-day filters 17/18 and 23/24 March, indicating that either or both of these periods may be preserved in the Piz Zup ´o record.
10
The second event at a depth of 4.5–4.7 m w.e. had high concentrations of Na+, K+, Mg2+, Ca2+, Cl−and SO2−4 . This event shows virtually no MSA and low concentrations of NH+4 and NO−3. The isotopic and chemical signatures before and after this event were characteristic of early winter conditions following the decrease of anthropogenic input in summer. Yellow/brown particles were observed in the ice samples for this section
15
of the core. Reports of dust deposition in Southern Switzerland during 13–15 October 2000 include (1) Observation of “red rain” in the Ticino region on 13 October (personal communication from G. Kappenberger, 2002). (2) Abnormally high levels of Ca2+, CO2−3 , Cl−, Na+, K+, SO2−4 and Mg2+ in wet-deposition samples from the Swiss precip-itation measurement stations Robiei (46◦270N, 8◦310E) and Piotta (46◦310N, 8◦410E)
20
for the period 9–15 October (personal communication from M. Veronesi, 2002). (3) Ob-servation of yellow snowfall on the Basodino glacier (120 km W of Piz Zup ´o, 46◦250N, 8◦290E) for the period 13–15 October 2000 (personal communication from G. Kappen-berger). Therefore, the second dust event visible in the ice core most probably took place around 15 October 2000.
ACPD
5, 7497–7545, 2005 Transport history of Saharan dust H. Sodemann et al. Title Page Abstract Introduction Conclusions References Tables Figures J I J I Back Close Full Screen / EscPrint Version Interactive Discussion
EGU
5. Meteorological analyses
The general transport patterns during the two dust events are illustrated by a repre-sentative selection of back-trajectories that fulfil the criteria for dust mobilisation and deposition (Fig.4). The meteorological analyses presented here describe the specific synoptic situation associated with dust transport to central Europe, and in combination
5
with additional observational data provide an independent validation of the transport patterns extracted from the extended back-trajectory analysis.
During the October event (Fig.4a), there is a single dominant transport pathway that leads from the Sahara across the Ligurian Sea directly to the Alps. As is shown later, a major dust mobilisation phase occurred during 06Z 11–12Z 14 October, in a region
10
stretching from northern Mauritania across Algeria into Tunesia. The subsequent di-rect northward transport across the Mediterranean transferred the Saharan dust to the Alps where it was potentially deposited at Piz Zup ´o between 00Z 13 October–06Z 16 October. Note that along with the Saharan dust, the October 2000 event brought very heavy precipitation to the Alpine south side, and caused devastating floods which
de-15
stroyed the village of Gondo in southern Switzerland. For the more complex March event (Fig. 4b), the trajectories indicate a first minor dust phase (M1) (not shown) followed by two important episodes (M2, M3) characterised by different transport path-ways (see Table1and Fig.4b). During M2, dust was ejected across the African west coast, transported in a rather exceptional pathway over the eastern North Atlantic,
20
and reached about 60◦N before approaching the arrival site from northerly directions. In contrast, transport during M3 was again mainly northward, similar to the October event. In the next subsections, the meteorological evolution during the two events will be discussed in some detail, in order to elucidate the dynamical processes that were responsible for these particular transport patterns and for the differences between the
25
two dust events under consideration.
Three types of visualisations are used to characterise the synoptic-scale conditions during the dust events. First, isentropic PV charts with horizontal flow vectors (only
ACPD
5, 7497–7545, 2005 Transport history of Saharan dust H. Sodemann et al. Title Page Abstract Introduction Conclusions References Tables Figures J I J I Back Close Full Screen / EscPrint Version Interactive Discussion
EGU
where the velocity is >10 m s−1) depict the dynamical processes in the tropopause re-gion (see for instance Fig.5a). The tropopause is defined as the 2-pvu surface and it separates tropospheric (blue and beige colours, low PV) from the stratospheric air masses (red, yellow and green colours, high PV). Second, the state of the atmosphere in the lower troposphere is investigated with the SLP and 850 hPa equivalent potential
5
temperature (θe) fields (e.g. Fig. 5c). Third, Meteosat IR satellite images are shown for the European sector (e.g. Fig.5b). The exact domain for the satellite images is indicated by the white dashed frame in Figs. 5a, c. In addition, the actual position of all trajectories that fulfilled the criteria mentioned above for potential dust transport to Piz Zup ´o are superimposed on the meteorological maps at the respective time instant.
10
This permits us to follow a potential dust cloud along its path from the area of mobil-isation towards the deposition site, concomitantly with the large-scale meteorological development. Different colours have been used to demark the position during dust mo-bilisation (red in the upper-level, black in the low-level charts), dust transport (yellow in the upper-level, white in the low-level charts) and wet deposition (blue). Note that dust
15
mobilisation is only indicated for trajectories that eventually reach Piz Zup ´o therefore the red/black crosses do not give an overall picture of current dust mobilisation.
Electronic supplements (http://www.atmos-chem-phys.org/acpd/5/7497/
acpd-5-7497-sp.zip) to this paper are available, which provide insightful anima-tions of Figs.5 and 8 for the full periods of the March and October dust events (see
20
electronic supplements orhttp://www.iac.ethz.ch/staff/harald/sahara/). 5.1. Meteorological development during the October dust event
Before 11 October, potential dust mobilisation was identified sporadically and dispersed across the Sahara region. In the eastern North Atlantic an intense low pressure sys-tem developed and became situated over the British Isles at 12Z 11 October (Fig.5c).
25
The satellite image (Fig.5b) reveals a prominent cold frontal cloud band that extends from Poland over the Alps and Spain to the Azores. At upper levels the cyclone was
ACPD
5, 7497–7545, 2005 Transport history of Saharan dust H. Sodemann et al. Title Page Abstract Introduction Conclusions References Tables Figures J I J I Back Close Full Screen / EscPrint Version Interactive Discussion
EGU
accompanied by a high-PV air mass on the 320 K isentrope that, at that time, induces a strong southwesterly flow to the Alps (Fig.5a). Further south, strengthening low-level winds across the western Sahara led to dust mobilisation with some dust already en-tering the Mediterranean. During the next two days, a southwest-to-northeast oriented mid-level jet (with peak velocities of more than 30 m s−1between 500 and 800 hPa, not
5
shown) developed and led to intensification of dust mobilisation over Algeria.
Until 12Z 13 October the upper-level PV anomaly elongated meridionally and devel-oped into a so-called PV streamer that extended to Northern Africa (Fig. 5d). Along its eastern side, the streamer veered the flow from Algeria directly towards the Alps. Near the surface, a tongue with low θe was advected from the North towards Spain
10
and Morocco, and a tongue with high θefrom Africa over the Alps to the Baltic Sea. A sharp cold front, running parallel to the upper-level streamer demarked the separation between these strongly differing air masses (Fig.5f). It was associated with a relatively broad cloud band extending from Algeria over the Alps to northern Germany (Fig.5e). At that time, there had been heavy precipitation for more than 24 h along the Alpine
15
southside (Fig.6). Ahead of the upper-level streamer, a large dust plume had entered the central Mediterranean and some wet deposition already occurring in the Alps. The SeaWiFS visible image from 13 October (Fig. 7) indicates the presence of adjacent streaks of dry dusty and moist cloudy air masses that may have become mixed on their way to the Alps. At that time, dust mobilisation still continued near Tunesia.
20
During the next two days, until 12Z 15 October, the PV streamer broke up and evolved into a PV cut-off located over the western Mediterranean (Fig. 5g). It did not reach into northern Africa and the export of Saharan dust into the Mediterranean ceased. However, previously mobilised dust was transported on its eastern flank from S-SE directions towards the Alps where widespread wet deposition occurred. The
25
surface front became strongly deformed (Fig.5i) and a large-scale cloud system with embedded convection covered all of Italy and France (Fig. 5h). It appears to be re-sponsible for the more intermittent rainfall observed near Piz Zup ´o between 13 and 17 October (Fig.6). By 06Z 16 October, the last of the identified dust parcels have arrived
ACPD
5, 7497–7545, 2005 Transport history of Saharan dust H. Sodemann et al. Title Page Abstract Introduction Conclusions References Tables Figures J I J I Back Close Full Screen / EscPrint Version Interactive Discussion
EGU
at Piz Zup ´o. Thereafter, little precipitation was observed at the three stations until the end of the month.
5.2. Meteorological development during the March dust event
The first minor dust mobilisation phase in March 2000 (M1, cf. Table1) took place in response to a cyclonic system located over the Canary Islands. It first mobilised dust in
5
the border region between Algeria, Mali and Mauritania and led to the ejection of a dust plume into the Atlantic during 12Z 05–18Z 07 March. The cyclone is still visible on the satellite image from 12Z 11 March over southern Portugal (Fig.8b) associated with a small-scale upper-level PV cut-off (Fig.8a) and a weak signal in the SLP field (Fig.8c). The ejected dust parcels were picked up by the westerlies to the west of Ireland after
10
11 March and were advected across France towards the Alps. However, widespread rain occurred among the dust-laden air parcels during the last 72 h before arriving at the Alps. It is therefore unlikely that a significant amount of dust from phase M1 was deposited at the arrival site Piz Zup ´o during 12Z 14–06Z 15 March. Still, this principal transport pattern has already been described by Prodi and Fea (1978), and Goudie 15
and Middleton (2001) list numerous Saharan dust falls over the British Isles during the twentieth century, including an event in Oxfordshire on 13 March 2000 which was probably related to the M1 dust plume. In a Lagrangian dust transport study, Ryall
et al. (2002) also modelled Saharan dust transport to Great Britain among other days, on 13–14 March 2000.
20
A major dust mobilisation phase (M2) was identified from the trajectory analysis during 00Z 09–12Z 11 March, first in south-western Algeria and Mali, later also in Mauritania (Fig. 8a). As a hypothesis we mention that the high velocities in the BL in these areas might have been a consequence of the distortion and northward tilt of the African easterly jet due to the intruding stratospheric PV anomaly over Libya
25
(see Fig. 8a). During 12Z 10–06Z 12 March a large dust plume left Africa near the Capverde Islands (20◦N, 20◦W). This is confirmed by the SeaWiFS satellite imagery (Fig.9a) and by the 3rd-level product from SeaWiFS, the Aerosol Optical Thickness
ACPD
5, 7497–7545, 2005 Transport history of Saharan dust H. Sodemann et al. Title Page Abstract Introduction Conclusions References Tables Figures J I J I Back Close Full Screen / EscPrint Version Interactive Discussion
EGU
one-week composite (not shown). On 14 March the dust plume was picked up by a weak cyclone in the eastern North Atlantic (near 40◦N, 40◦E, see Figs.8d, f). The decaying cyclone was associated with a minimum in SLP, a uniform low-level temper-ature field and a small upper-level PV cut-off. This feature was essential to advect the Saharan dust northward into a pronounced upper-level ridge and jet-stream
sys-5
tem. Almost no clouds and rain formed in the vicinity of the dust plume until it passed Iceland to the north of a pronounced surface high-pressure system on 12Z 16 March (Figs.8g, i). At that time a strong northerly flow was established towards the Alps, as can be seen in the IR satellite image by the sharp transition between orographic clouds and cloud-free conditions south of the Alps and Pyrenees due to F ¨ohn (Fig.8h).
Dur-10
ing the following two days, this northerly flow advected the dust cloud rapidly towards Central Europe. Partial rainout occurred over Germany (see electronic supplement:
http://www.atmos-chem-phys.org/acpd/5/7497/acpd-5-7497-sp.zip). About 9 days af-ter mobilisation, dust plume M2 arrived at Piz Zup ´o during 12Z 17–12Z 19 March. Precipitation data close to Piz Zup ´o also indicate that wet deposition of the remaining
15
dust may have occurred during 17–18 March, although precipitation intensities were small and limited to high elevations and the slopes facing north (Fig.10).
A second major dust mobilisation phase (M3) occurred only a few days later. The main dust mobilisation during this phase took place on 00Z 22 March and was confined to a narrow band located across the Algerian desert (Fig.8j). Similarly to the October
20
event, the dust mobilisation appears to be closely related to a PV streamer reaching to northern Africa, which induced strong southerly winds on its eastern flank. As an interesting side remark it is noted that this PV streamer developed in a very different way compared to the streamer in the October event. The latter evolved due to narrow-ing of an upper-level trough. In contrast, in March a previous large streamer extendnarrow-ing
25
from the Black Sea over the entire Mediterranean broke up on 21 March near the Atlas mountains. The cut-off PV vortex rotated and moved slightly northward until it rejoined the stratospheric reservoir near Scotland at 00Z 22 March (Fig.8j). This “secondary streamer” (M3) led to the ejection of the dust plume into the Mediterranean during 18Z
ACPD
5, 7497–7545, 2005 Transport history of Saharan dust H. Sodemann et al. Title Page Abstract Introduction Conclusions References Tables Figures J I J I Back Close Full Screen / EscPrint Version Interactive Discussion
EGU
21–12Z 23 March. Its local PV maximum coincided with a weak surface cyclone west of Portugal (Fig.8l) that can also be identified in the IR image with a broad and fuzzy cloud structure in the warm sector (Fig.8k). The dust ejection into the Mediterranean is confirmed by the visible satellite image on 22 March (Fig.9b). During 12Z 23–12Z 26 March wet deposition took place at Piz Zup ´o in qualitative agreement with the cloud
5
structures in the IR images (see electronic supplement) and the scattered precipitation signals recorded in the Piz Zup ´o area during this time period (Fig.10).
5.3. Meteorology discussion
The meteorological description of the two dust events revealed remarkable similarities and differences between the considered phases of African dust export. First, direct
10
northward transport from the Sahara to the Alps occurred when a stratospheric PV streamer was stretching into northern Africa and induced anomalous southerly flow over the Mediterranean. In the October case, this streamer formed due to Rossby-wave breaking and disrupted to the west of the Alps (a similar event has been dis-cussed in detail byMorgenstern and Davies(1999)). In the earlier March case a first
15
streamer of type I (Appenzeller et al.,1996) that encircled a pronounced anticyclone over Central Europe, broke up and formed a cut-off that remerged near Scotland to form a secondary streamer. This difference in the formation history of the two western Mediterranean PV streamers is noteworthy and illustrates the complexity and variability of meteorological processes that can lead to large-scale dust transport to Central
Eu-20
rope. This aspect is further highlighted by the dust transport phase M2 in March 2000, where several seemingly independent meteorological features cooperated in order to transport dust from the western Sahara within almost 10 days across the Capverde Islands and the Azores to 60◦N and across Germany to Piz Zup ´o.
The configuration including an upper-level trough has already been noted byProdi 25
and Fea (1978,1979). Barkan et al.(2005) focused on dust transport to the Mediter-ranean during summer due to such a constellation. Alpert and Ganor (1993) high-lighted the importance of an upper-level jet on the formation of a dust storm in the
ACPD
5, 7497–7545, 2005 Transport history of Saharan dust H. Sodemann et al. Title Page Abstract Introduction Conclusions References Tables Figures J I J I Back Close Full Screen / EscPrint Version Interactive Discussion
EGU
Mediterranean. Notably, that flow configuration is reminiscent of the typical precur-sor structure for heavy precipitation on the Alpine southside (Massacand et al.,1998). Quasi-stationary PV streamers extending over France into the western Mediterranean can direct large moisture fluxes along their eastern side towards the Alps. In a climato-logical study covering 30 years, Martius et al. (2005)2 showed that streamer events in
5
Western Europe are frequently associated with heavy precipitation in the Alps. From our study, it becomes evident that particularly elongated streamers which even reach into northern Africa can also direct dry and dusty Saharan air masses towards the Alps. In some cases, the northward transport of dust and moisture occurs almost simultane-ously, as indicated by the severe flash flood event in Gondo on 13/14 October 2000 that
10
was followed by the most prominent dust event recorded in the Piz Zup ´o ice core. Note however, that this combined occurrence of heavy rain and Saharan dust in the southern Alps might be exceptional since (i) many PV streamers that produce heavy rain do not reach far enough into the desert to trigger the export of dust, (ii) not every southerly flow across the Mediterranean that carries Saharan dust is also advecting large amounts of
15
moisture from the Mediterranean. The latter is likely seasonally variable with enhanced frequency in autumn (Martius et al., 2005). It is therefore not possible to interpret the ice core’s dust signal as a direct record of extreme precipitation, or vice versa.
Upper-level PV streamers that extend into the African subtropics may also play a role for tropical-extratropical interactions. Thereby, tropical moisture is transported into
20
the subtropics where it leads to heavy precipitation in semi-arid zones (Knippertz et al.,
2003;Knippertz,2003). This moisture transport typically occurs in the middle tropo-sphere (700–400 hPa), possibly in similar mid-level jet structures as observed during the October event. Convective activity triggered near the right entry and left exit of the jet could further support uplift of desert dust and subsequent long-range transport in
25
northerly directions. Hence, such tropical-extratropical interactions could lead to the
2
Martius, O., Zenklusen, E., Schwierz, C., and Davies, H. C.: Episodes of Alpine heavy precipitation with an overlying elongated stratospheric intrusion: A Climatology, Int. J. Clim., submitted, 2005.
ACPD
5, 7497–7545, 2005 Transport history of Saharan dust H. Sodemann et al. Title Page Abstract Introduction Conclusions References Tables Figures J I J I Back Close Full Screen / EscPrint Version Interactive Discussion
EGU
formation of adjacent bands of moist cloudy and dry dusty air as seen in Fig. 7 and Fig.5e.
6. Chemical analyses and interpretation
The chemical record of the Piz Zup ´o ice core raises the question to what extent mete-orological information is recorded by the chemical composition. While some chemical
5
species are considered to reflect influences of the source region of dust, others are most likely incorporated by the dust plume somewhere along the transport pathway. These issues are further investigated in the following sections.
6.1. Dust source region signal
The extended back-trajectory method allowed for extraction of the locations where the
10
mobilisation criteria as defined in Sect.3.3were fulfilled. Probability density functions of these potential uptake locations are interpreted as potential source areas of Saharan dust for the individual events (Fig.11).
In October 2000 (Fig.11a), the identified source regions are rather widely dispersed in the northern Sahara. Yet, two regions with increased potential mobilisation are
ap-15
parent, one in Algeria along the axis of the previously mentioned mid-level jet, and one in western Libya. These northern mobilisation maxima together with the large distri-bution of weaker sources indicate that although the mineralogy of soils in the northern Sahara dominates, dust mobilised previously further south may be mixed into the dust plume transported to the Alps. This could lead to a blurred chemical source region
20
signal (Sch ¨utz and Sebert,1987).
In March 2000, dust source regions were identified separately for the dust phases M1, M2 and M3 (Fig.11b). The first two phases have dust sources in West Sahara, Mali, and Mauritania, while for the phase M3 source regions in Algeria and Libya dom-inate, as can be expected from the meteorological similarity to the October event.
ACPD
5, 7497–7545, 2005 Transport history of Saharan dust H. Sodemann et al. Title Page Abstract Introduction Conclusions References Tables Figures J I J I Back Close Full Screen / EscPrint Version Interactive Discussion
EGU
In the Piz Zup ´o ice core record, large peaks in the concentration of Ca2+ mark the October and March dust events (Fig.3). The Ca2+ concentration during the October event is by far the largest signal during the 11-yr record. It covers about 0.20 m w.e. in the ice core. The section identified as the March event in the ice core shows two peaks in Ca2+close to each other, a stronger one from 7.1–7.3 m w.e. and a smaller one from
5
7.0–7.1 m w.e. From mineralogical studies, it is known that soils in the northern Sahara are relatively rich (partly >15%) in calcite (CaCO3), while towards the south concentra-tions decrease (Sch ¨utz and Sebert,1987;Claquin et al.,1999). Accordingly, Ca2+and calcite are widely used as tracers of Saharan dust events over Europe (Wagenbach
and Geis,1989;Schwikowski et al.,1995;Avila et al.,1997). The high concentrations
10
of Ca2+found for the October and March events are hence in agreement with the promi-nent northern Saharan dust source regions identified by the extended back-trajectory analysis.
During February and March 2000, the Cloud and Aerosol Characterisation Ex-periment (CLACE-1) took place at the Jungfraujoch (JFJ) high alpine observatory
15
(46◦320N, 7◦590E, 3580 m a.s.l., Fig. 1). Throughout this campaign, several physical and chemical properties of aerosol arriving at JFJ during the dust phases M2 and M3 were recorded in real-time. Besides scattering and absorption coefficient mea-surements, single-particle composition spectra were acquired (Hinz et al.,2005). The duration and timing of the March dust phases at JFJ derived from CLACE-1
observa-20
tions agrees very well with the results from our trajectory analysis for Piz Zup ´o (Phase M2: 20Z 16–20Z 18 March, phase M3: 03Z 23–18Z 24 March). This could not neces-sarily be expected, because, as mentioned before, it is not straightforward to compare aerosol measurements with wet deposition fluxes (Osada et al.,2004). The CLACE-1 measurements thus provide independent evidence for the reliability of the results from
25
our trajectory study.
Single-particle element spectra measured during CLACE-1 allow the confirmation of the significant shift in source regions between phase M1/M2 and M3.Hinz et al.(2005) found differences in the intensity ratios of nitrate, phosphate, sulfate, silicon, titanium,
ACPD
5, 7497–7545, 2005 Transport history of Saharan dust H. Sodemann et al. Title Page Abstract Introduction Conclusions References Tables Figures J I J I Back Close Full Screen / EscPrint Version Interactive Discussion
EGU
and iron and their oxides. In particular, calcium and iron oxides were more abundant during phase M3. However, due to resuspension, the mineralogy of a mineral aerosol is not necessarily identical with the mineralogy of its source region (Sch ¨utz and Sebert,
1987; Claquin et al., 1999). Furthermore, changes in the mineralogical composition might occur during dust transport due to the preferential deposition of coarser particles
5
or dissolution of calcite. This could in particular be the case for long transport paths, such as for phase M2.
If an unequivocal chemical source region tracer were available, the source region identifications as in Fig.11could be corroborated more firmly. However, even though the interest in finding such a tracer has been persistently high in past studies, no
gen-10
eral solution to the problem has been established as yet (Sch ¨utz and Sebert,1987), with some regional exceptions (Bergametti et al.,1989). One way to improve the iden-tification of source regions from the chemical composition of mineral aerosol could be the analysis of rare earth elements, and in addition the87Sr/86Sr and143Nd/144Nd com-bined isotope ratios. However, for these trace elements, very few or even no data are
15
available from ice cores until now, while major ion data exist already from several Alpine ice cores.
The high concentration in other chemical species observed simultaneously with the large Ca2+ peak could provide clues on the transport path of the dust. The next section will provide further analyses along the hypotheses presented above.
20
6.2. Uptake of chemical species during transport
Several chemical species which show extraordinarily high values in the Piz Zup ´o ice core for the two dust events (Sect.4, Fig.3) are unlikely to originate from the source re-gion of the mineral aerosol. This includes typical sea spray components, such as Na+, Cl−, and partly SO2−4 , as well as MSA. MSA is formed by photo-oxidation of
dimethyl-25
sulfide (DMS), which is in turn released by marine phytoplankton near the ocean sur-face (Huebert et al., 2004). The chemical species NH+4, NO−3, and partly SO2−4 are tracers for polluted air masses (Schwikowski et al.,1995;Jordan et al.,2003). Hence,
ACPD
5, 7497–7545, 2005 Transport history of Saharan dust H. Sodemann et al. Title Page Abstract Introduction Conclusions References Tables Figures J I J I Back Close Full Screen / EscPrint Version Interactive Discussion
EGU
these chemical species have their strongest sources in the marine or anthropogenically influenced BL.
Accordingly, these chemical components are most likely scavenged by the mineral aerosol somewhere along its transport path. This scavenging can take place in several ways: (i) The chemical components are contained in BL air masses that are
trans-5
ported to the glacier independently from the dust transport, where they then undergo scavenging during wet deposition. (ii) The chemical components are scavenged by the mineral aerosol particles along their path through the BL, and subsequently deposited at the glacier adsorbed onto the mineral aerosol. (iii) The chemical components are al-ready contained in the air mass before dust mobilisation occurs, and scavenging takes
10
place during mobilisation and transport. A combination of these processes might be possible as well.
With respect to sea salt species, the ice core record shows only minor differences for the two dust events (Fig.3), the exception being Cl−, which is much larger for the Octo-ber than for the March event. The high concentrations of NO−3 and NH+4 during March
15
are also exceptional. Schwikowski et al.(1995) noted extraordinarily high scavenging efficiencies of Cl−, NO−3, SO2−4 , and NH+4 during snow falls associated with Saharan dust at JFJ, probably due to increased riming. In dust samples collected on a research aircraft off the Yellow Sea, Jordan et al. (2003) found elevated mixing ratios of NO−3 and NH+4 in air masses which had travelled over polluted areas. Hence, it seems
plau-20
sible that during both dust events contact or mixing with marine BL air occurred, while during the March event in addition polluted air masses interacted with the dust plume somewhere along the transport path.
A different explanation is required for the MSA signal in the ice core. While for the March event a large MSA peak similar to that of the anthropogenic pollutants can be
25
observed, MSA is virtually absent from the ice core record during October. The ques-tion arises at to what leads to the difference in MSA between the two dust events. This issue is addressed by considering the potential source regions of MSA during the two dust events. Since MSA resides in the marine BL as an oxidation product of DMS,
ACPD
5, 7497–7545, 2005 Transport history of Saharan dust H. Sodemann et al. Title Page Abstract Introduction Conclusions References Tables Figures J I J I Back Close Full Screen / EscPrint Version Interactive Discussion
EGU
which is exclusively produced by certain phytoplankton species, we use chlorophyll a concentrations at the sea surface obtained from remote sensing satellites as a proxy for the presence of MSA in the marine BL (Sect.2.3).
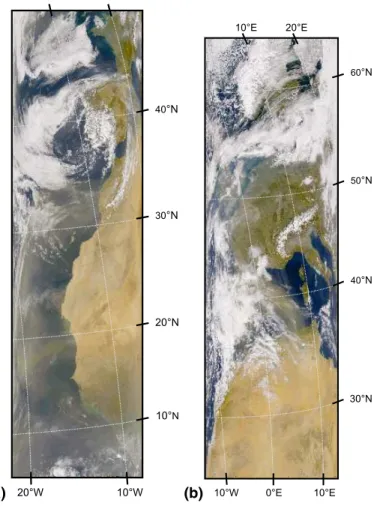
Overlaying the chlo-a maps with representative dust transport trajectories for the two dust events indicates potential for MSA uptake from areas of high phytoplankton
con-5
centrations (Fig. 4). During the week 7–14 October, areas of high concentration of chlo-a are confined to the North Sea and upwelling areas off the African west coast (Fig.4a). In these areas, concentrations of chlo-a reach 3–10 mg m−3. A composite for the week from 13–20 March (Fig.4b) shows a general southward shift of high phyto-plankton concentration areas, and an intensified maximum off the African west coast.
10
Importantly, the western Mediterranean now exhibits a centre of moderate concentra-tions of chlo-α between 0.3–1.0 mg m−3, compared to less than 0.1 mg m−3in October. This is an indication of the spring phytoplankton bloom that usually takes place in this area during March and April (Bosc et al.,2004). Most other areas of the Mediterranean show low concentrations of chlo-a at that time of the year (<0.2 mg m−3).
15
Time-series of vertical cross-sections as indicated in Fig.4b were inspected for the passage of the dust plumes across the potential source regions of MSA, and in order to identify the likelihood of an interaction between the dust plume and the potentially MSA-laden marine BL air masses (Fig.12). During the dust phase M2, the extended back-trajectory analysis indicates that the dust-laden air masses offshore the African
20
west coast were above the marine BL (Fig. 12a). The marine BL top is defined here by the strongest vertical gradient of water vapour mixing ratio. The dry Saharan air masses continuously remained above the very shallow marine BL and subsequently were slowly lifted during their northward transport. While crossing the potential source areas of MSA in the North Sea, the dust plume was still above the marine BL (850–
25
600 hPa, not shown). However, during the dust phase M3, a different picture emerges (Fig.12b). Here, the marine BL over the western Mediterranean is less clearly defined than off the West African coast. Some dust parcels appear to travel within moist areas of the marine BL. The air masses approach Piz Zup ´o directly across the chlo-a
maxi-ACPD
5, 7497–7545, 2005 Transport history of Saharan dust H. Sodemann et al. Title Page Abstract Introduction Conclusions References Tables Figures J I J I Back Close Full Screen / EscPrint Version Interactive Discussion
EGU
mum in the Gulf of Genova (Fig.4b). Hence, our back-trajectory analysis indicates that the large MSA peak in the ice core record for the March event was caused by aerosol scavenging while the dust plume interacted with the marine BL air during its passage over the spring maximum in the phytoplankton bloom in the western Mediterranean.
Additional evidence for this interpretation is again provided by single-particle
analy-5
ses during the CLACE-1 campaign in March 2000 (Hinz et al.,2005). Particles sam-pled at JFJ during 18 March (i.e. phase M2) were typically either of mineral or carbonic nature. Sulfur and nitrogen species were relatively rare. Particle spectra measured on 23 March (i.e. phase M3) on the contrary showed higher intensities of sulfur and nitrogen species (Hinz et al., 2005, Fig. 5). In addition, more mixed particle spectra
10
including carbonic species were present. Towards the end of the measurement cam-paign (24 March), Hinz et al. (2005) noted the strongest influence from polluted air masses. Their findings corroborate that during phase M2 relatively unaltered mineral dust was deposited at Piz Zup ´o while phase M3 brought chemically altered mineral aerosol particles, which had been exposed to BL air both over the Mediterranean and
15
northern Italy. From the back-trajectory analysis it is reasonable to assume that local pollution sources along the transport path, such as Genova or Milano, contributed to the anthropogenic signals.
Vertical cross-sections for the October event (not shown) show similar potential for interaction with the marine BL over the Mediterranean as during March. High
concen-20
trations of sea spray components (e.g. Cl−) in the ice core chemistry confirm that such interaction occurred (Fig. 3). However, as can be inferred from Fig. 4a, in October concentrations of chlo-a were substantially lower in the western Mediterranean than during March. This would also be expected from the phytoplankton seasonality in that area (Bosc et al.,2004). Therefore, the most likely explanation for the absence of MSA
25
in October is that concentrations of MSA in the marine BL were much smaller than in March.
ACPD
5, 7497–7545, 2005 Transport history of Saharan dust H. Sodemann et al. Title Page Abstract Introduction Conclusions References Tables Figures J I J I Back Close Full Screen / EscPrint Version Interactive Discussion
EGU
7. Discussion of the applied methodology
An assessment of the reliability and soundness of the new methodology applied here is required in order to draw dependable conclusions from this study, in particular as it combines data from different sources and with different spatial and temporal scales. The ice core from Piz Zup ´o represents a point sample that integrates over timescales
5
of a few days. Back-trajectory calculations, on the other hand, while having a higher temporal resolution, are limited by their spatial accuracy and representativeness, and are not straightforwardly related to a point sample. Some critical aspects related to the methodology are elucidated below.
The spatial uncertainty due to uncertainties in the wind fields and calculation
meth-10
ods is a central issue of back-trajectory methods. Past dust transport studies mostly relied on single back-trajectories, typically at different vertical levels (Schwikowski et al.,
1995;Avila et al.,1997;Ansmann et al.,2003). In this study, spatial uncertainty is taken into account by calculating ensembles of trajectories for each timestep (Sect. 3.1), rather than considering single starting points. However, spatial uncertainty increases
15
with the integration time of backward trajectories. The spatial spread of the ensem-ble gives an indication of the coherence of the flow and hence the reliability of e.g. a potential dust source region. The 10-day calculation time is therefore a compromise between the reliability of the calculations and the ability of the method to capture all rel-evant dust mobilisations. Note, however, that this method cannot account for analysis
20
errors in the wind field, e.g. due to sparse data coverage.
Sufficiently high wind velocity near the surface is a well-established criterion for dust mobilisation. Studies by Shao and Leslie (1997) and Schoenfeldt and von Loewis
(2003) indicate that if the 10 m wind speed exceeds 10 m s−1, wind shear near the surface becomes sufficiently strong to mobilise significant amounts of dust. The wind
25
speed considered by our methodology is taken at the position of an air parcel rather than at a fixed height of 10 m above ground, hence our mobilisation velocities may be biased high. However, observing the movement of Saharan dust over land and sea
ACPD
5, 7497–7545, 2005 Transport history of Saharan dust H. Sodemann et al. Title Page Abstract Introduction Conclusions References Tables Figures J I J I Back Close Full Screen / EscPrint Version Interactive Discussion
EGU
from satellites,Koren and Kaufman(2004) found velocities of 10 to 13 m s−1for whole dust plumes. We adopted a mobilisation threshold of 10 m s−1at the position of the air parcel. Turbulent processes within the atmosphere, in particular within the convective boundary layer, are not captured by off-line Lagrangian calculations. In fact, explicit dust mobilisation may be difficult to localise, as some dust is always present in the
5
atmosphere above the Saharan desert. For a large dust event to occur, however, it is still reasonable to assume a certain threshold velocity for enhanced dust mobilisation.
Our assumption for the boundary layer height (BLH) is well in the range typically observed and modelled for the Sahara. In a sensitivity study of the TOMS AI (aerosol index),Mahowald and Dufresne(2004) found boundary layer heights of around 1 km in
10
January and larger than 3 km in July. As we consider the months March and October only, a BLH of 1.9 km a.s.l. is a reasonable assumption. However, we do not account for the pronounced daily cycle in BLH in desert areas, with nighttime values as low as 200 m (Mahowald and Dufresne,2004). During the strong wind conditions required for the mobilisation of dust, however, nighttime BLHs should be larger than the low BLHs
15
produced by radiative cooling in steady air. In a number of LIDAR studies, the height of dust plumes leaving the African continent was typically observed to be at or above 1.5 km (Hamonou et al.,1999; Mattis et al.,2002;Leon et al., 2003). Off the African coast, dust layers were in general multi-layered, and reached up to 5 km above ground. Hence, long-range transport seems to begin at around 1.5 km height above ground.
20
Taking into account the underlying orography, our assumed BLH complies well with these observations.
Soil moisture is a factor that can be important for dust mobilisation (Ravi et al.,2004), but has not been considered in this study. Seasonal or short-term changes in precipi-tation may render some regions incapable to emit dust, while others may become more
25
productive than the annual mean. Also, different soil properties such as the ease of suspendibility have a large influence on the amount of dust emitted from a certain area, and lead to well-known “hot-spots” of dust emission (Goudie and Middleton,2001;
Ko-ren and Kaufman,2004). In addition, seasonality in vegetation cover is not accounted 7523
ACPD
5, 7497–7545, 2005 Transport history of Saharan dust H. Sodemann et al. Title Page Abstract Introduction Conclusions References Tables Figures J I J I Back Close Full Screen / EscPrint Version Interactive Discussion
EGU
for, as the data set byDeFries and Townshend(1994) was generated from one year of averaged NDVI (normalised difference vegetation index) satellite data only. The largest part of our potential source area is however bare soil and should not show significant seasonal vegetation changes.
Physical properties of the dust itself, such as size spectra, have not been taken into
5
account here. Size spectra are important for the dry deposition of heavier particles, and the ageing of mineral aerosol during transport. Typical settling velocities of long-range transported mineral aerosol are in the long-range of 0.001–0.02 m s−1, but may be significantly higher for large particles (Duce et al.,1991). Hence, for longer transporta-tion times, such as during phase M1 and M2, dry depositransporta-tion of larger particles is likely
10
to be more relevant than for the short transport paths observed during phase M3 and the October event. These influences are only taken into account in a very qualitative way in this study.
Wet deposition of mineral aerosol at Piz Zup ´o was identified with a relative humidity criterion, and confirmed by nearby precipitation with respect to timing. However,
undis-15
putable evidence that scavenging of mineral aerosol actually is taking place would re-quire additional information. Aerosol measurements from the nearby JFJ observatory provided valuable but limited evidence, as the two locations may experience a different timing of the dust events. In addition, as noted above, high aerosol concentrations are a necessary but insufficient criterion for the formation of dust layers in snow, as
20
precipitation is needed for efficient deposition (Osada et al.,2004). Finally, only direct analyses of precipitation chemistry could provide insight into the wet removal process that is actually taking place during a dust event (Schwikowski et al.,1995).
The qualitative methodology presented here can be considered as a first-order La-grangian dust transport model. It could be extended to a full dust transport model by
25
including parameterisations of further dust-related processes, in particular convection, coagulation, and gravitational settling of dust particles. Currently, however, in awaness of the limitations discussed above, it is essential that all estimates of source re-gions and transport pathways of dust in this study be interpreted as “potential” source