HAL Id: hal-01070557
https://hal.archives-ouvertes.fr/hal-01070557
Submitted on 1 Oct 2014HAL is a multi-disciplinary open access
archive for the deposit and dissemination of sci-entific research documents, whether they are pub-lished or not. The documents may come from teaching and research institutions in France or abroad, or from public or private research centers.
L’archive ouverte pluridisciplinaire HAL, est destinée au dépôt et à la diffusion de documents scientifiques de niveau recherche, publiés ou non, émanant des établissements d’enseignement et de recherche français ou étrangers, des laboratoires publics ou privés.
base: Evidence from Biotechnology and
Telecommunications
Jackie Krafft, Francesco Quatraro, Pier-Paolo Saviotti
To cite this version:
Jackie Krafft, Francesco Quatraro, Pier-Paolo Saviotti. The dynamics of knowledge-intensive sectors’ knowledge base: Evidence from Biotechnology and Telecommunications. Industry and Innovation, Taylor & Francis (Routledge), 2014, 21 (3), pp.215-242. �hal-01070557�
The dynamics of knowledge-intensive sectors' knowledge base:
Evidence from Biotechnology and Telecommunications
1Jackie Kraffta, Francesco Quatraroa,b, Pier Paolo Saviottic a) University of Nice Sophia Antipolis, CNRS GREDEG
b) BRICK, Collegio Carlo Alberto
c) INRA GAEL, and University of Nice Sophia Antipolis, CNRS GREDEG
ABSTRACT. In this paper we present a methodology to represent and measure knowledge which takes into account knowledge heterogeneity and its sectoral level theoretical and empirical implications in knowledge intensive environments. We draw on work on recombinant knowledge, extending the approach to include: the way the dynamics of technological knowledge creation evolves according to a life cycle; testing the existence of concepts such as technological paradigms; mapping the characteristics of the search process in the phases of exploration and exploitation during this technology life cycle; and detecting the differences in sectoral evolution that can be explained by the properties of the knowledge base. We use European Patent Office data (1981-2005) to propose some operational metrics for the knowledge base and its evolution in two knowledge intensive sectors: biotechnology and telecommunications. Our empirical results show that there are interesting and meaningful differences across sectors, which are linked to the different phases of the technology life cycles.
JEL Classification Codes: O3, L2.
Keywords: knowledge base, knowledge intensive sectors, variety, coherence, cognitive distance, technological classes, patents.
1
The authors wish to thank the three anonymous referees and the Editor Francesco Lissoni for their comments. We also thank Cristiano Antonelli, Ron Boschma, Davide Consoli, Aldo Geuna and Marco Valente for providing useful suggestions. We wish to acknowledge the funding of the Collegio Carlo Alberto through the IPER research project, as well as the support of CNRS through the GREDEG research centre. This work is an input to the PICK ME project funded by the European Commission (EU FP7, grant n°266959).
1 Introduction
There is complete consensus among economists and others in the social science disciplines that knowledge, as an essential input in innovation, constitutes a key component of economic growth and development. There is less agreement about the type of knowledge needed for innovation and the generation of growth and development. A contribution to this line of thinking is the literature on
recombinant knowledge, exploiting a key insight in Schumpeter (1912) and Usher (1954) that
innovations result from new, untried combinations of existing elements. Several studies propose that the knowledge base of a firm, sector, region, etc. emerges from a search process conducted across a knowledge space within which small knowledge components are distributed. The search process identifies bits of knowledge that can be combined to generate new technological knowledge (Weitzman, 1996, 1998; Fleming, 2001; Fleming and Sorenson, 2001; Sorenson et al., 2006). In principle, searches can be conducted across any areas of the knowledge space; however, the set of competences possessed by the economic agents, and the set of social and technological influences within which they operate, are likely to constrain their recombination activities to well defined areas of the knowledge space, thus shaping and providing some boundaries to their evolutionary paths.
The present paper concentrates on biotechnology and telecommunications, two knowledge intensive sectors. Extending the recombinant knowledge theoretical framework and using European Patent Office (EPO) data (1981-2005), we make three contributions to the literature. First, we propose measures describing the structure of the knowledge base and its evolution in each sector. Second, these measures allow us to identify the technology life cycle starting from a phase of discontinuity typically corresponding to the emergence of a technological paradigm, and continuing through a gradual maturation of the knowledge base with a corresponding shift towards more incremental types of innovation. Third, the use of these measures provides a more analytical interpretation of exploration versus exploitation as key concepts. We show empirically the existence of interesting and meaningful differences across sectors, which may be linked to the different phases of the industry life cycles.
The paper is organized as follows. Section 2 outlines the theoretical framework. Section 3 describes the methodology used for the empirical study, and defines the variables used to proxy for the
properties of the knowledge base. Section 4 presents the data. Section 5 discusses the empirical evidence. Section 6 presents the conclusions and suggests some avenues for future research.
2 Theoretical Framework
2.1 Properties of the knowledge base
The importance of knowledge as a potential determinant of growth has been widely acknowledged, but the number of contributions that address the dynamics of knowledge is rather small. The work on recombinant knowledge is the exception. It includes some important advances on the idea that knowledge is not a homogenous good. Rather it is cumulative and heterogeneous and is composed of different subsets dispersed in a technological space, more or less combinable depending on their location in this space. The creation of the knowledge base is the outcome of a search process that takes account of these different characteristics. It has been shown that search is generally more local rather than global, and based predominantly on the recombination of existing knowledge (Fleming, 2001; Fleming and Sorenson, 2001; Sorenson et al., 2006). More distant search in less familiar regions of the knowledge space is more difficult to manage, and requires appropriate competences (Antonelli, 2008). In the meantime, it is also more likely to lead to the creation of radical new technological knowledge, giving rise to discontinuities in evolutionary patterns (Nightingale, 1998; Katila and Ahuja, 2002).
In this paper, we extend the recombinant knowledge approach to consider knowledge as a structure the components of which are either concepts or variables. Since these components are linked by relations or connections knowledge can be considered a co-relational structure (Saviotti, 2004, 2007) and represented as a network. This opens the way to the use of network methodologies in the study of the evolution of knowledge. Some of the most promising recent network models (Gilbert et al, 2001, 2007; Blom et al, 2012) use organizations rather than elements of knowledge as nodes, even if the behaviour of such organizations is determined by their knowledge bases. Although applying these network models to our case would be very interesting, the required adaptation is outside the scope of the present paper. Human knowledge would thus be a very large network of which the knowledge bases of firms or of their aggregates (e.g. regions, sectors) would be small
knowledge bases of firms, or more daring, if more risky and costly, when carried out in more distant parts of knowledge space. The distance between the present knowledge base of a firm or a sector and the external knowledge which is the object of the search, which we call Cognitive distance, appears then here as a relevant property of knowledge: cognitive distance can be expected to affect positively search costs, and search is then likely to be local in most circumstances. However radically new combinations of more distant technological knowledge can entail greater opportunities although they are more difficult to attain. In that perspective, cognitive distance can allow us to detect the presence of discontinuities in knowledge.
Modern science and technology are characterized by an increasingly fine division of labour. New disciplines, sub disciplines and specialized fields are continuously emerging. As a consequence we expect knowledge to become increasingly differentiated in the course of time. A further relevant property of knowledge is then its variety, which we decline as related or unrelated variety. The former indicates the differentiation at a local level, typically corresponding to incremental modifications, while the latter involves more drastic and discontinuous changes in knowledge.
New advances in knowledge and technological applications require the combination of different types of knowledge. We can expect the introduction of radically new types of knowledge into a given knowledge base to make the combination more difficult. A learning process is then required to improve firms' capability to combine new and old pieces of knowledge. This capability, which we call coherence, is the third of our knowledge properties.
2.2 Pattern of evolution of technological trajectories
The above knowledge properties can allow us to map important concepts in the economics of innovation, such as radical product innovations (Freeman, 1982; Klepper, 1997), technological paradigms (Dosi, 1982), exploration and exploitation (March, 1991), competence disrupting technological change (Tushman and Anderson, 1986).
Figure 1 proposes a schematic representation of the relationships amongst the three concepts, i.e. coherence, cognitive distance and variety, as well as their expected links with the stages of the technological lifecycle.
>>> INSERT FIGURE 1 ABOUT HERE <<<
All these concepts imply indeed the existence of discontinuities that give rise to the emergence of new paradigms, and of subsequent phases of incremental innovations. In the initial phases, in which exploration dominates, search occurs in very far away regions of knowledge space thus giving rise to competence disrupting technological change. This search which entails a high degree of novelty and of uncertainty (Saviotti, 1996), is undertaken in the expectation that it can open important avenues of future development.
Once a technological trajectory is established by radical innovations exploitation will tend to dominate exploration, and search will be conducted through a process of organized search mainly within familiar areas of the knowledge space, resulting in lower levels of uncertainty. Simultaneously the variety of technological knowledge shifts from unrelated to related, and the focus of the search process focuses on a smaller number of profitable combinations. As the new paradigm matures, the bits of knowledge that are combined are likely to be characterized by lower levels of cognitive distance and higher levels of coherence.
This representation of knowledge can be used to provide an operational distinction between exploration and exploitation: the transition from the former to the latter occurs as cognitive distance falls, coherence rises and variety shifts from unrelated to related. Correspondingly search changes from random to organized.
3 Measuring the Knowledge Base
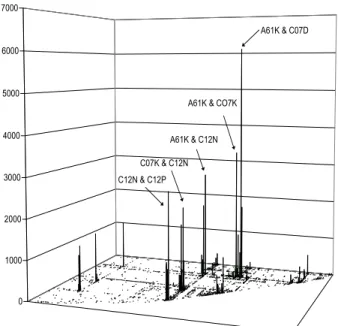
The general properties of the knowledge base can be investigated using different methodologies, including social network analysis or the calculation of indicators based on co-occurrence matrixes in which the rows and columns are bits of knowledge and the cells report the frequency with which each pair of technologies is observed. We need to identify proxies for bits of knowledge and the elements that constitute them. In this paper we use patent statistics to derive measures drawing upon co-occurrence matrixes.2 Each technological class i is linked to another class j when the same patent is assigned to both classes. The higher the number of patents jointly assigned to classes i and j, the stronger is this link. Since the technological classes attributed to patents are reported in the patent document, we refer to the link between i and j as their co-occurrence within the same patent document.3 In Figure 2 we provide a snapshot of a patent document showing how we use the information on technological classes to obtain our indexes. We next explain how knowledge characteristics are translated into computable variables.
>>> INSERT FIGURE 2 ABOUT HERE <<<
Measuring the knowledge base allows an elaboration of the relationship between changes in knowledge structure and the phases of exploration and exploitation that characterize the dynamics of technology life cycles. We are then able to examine the mechanisms by which knowledge is created and used in each sector, to compare and identify commonalities and differences.4 In what
2
The limits of patent statistics as indicators of technological activities are well known. The main drawbacks can be summarized in their sector-specificity, the existence of non patentable innovations and the fact that they are not the only protecting tool. Moreover the propensity to patent tends to vary over time as a function of the cost of patenting, and it is more likely to feature large firms (Pavitt, 1985; Griliches, 1990). Nevertheless, previous studies highlighted the usefulness of patents as measures of production of new knowledge (Acs et al., 2002). Besides the debate about patents as an output rather than an input of innovation activities, empirical analyses showed that patents and R&D are dominated by a contemporaneous relationship, providing further support to the use of patents as a good proxy of technological activities (Hall et al., 1986).
3
It must be stressed that to compensate for intrinsic volatility of patenting behaviour, each patent application is made last five years.
4According to OECD STI scoreboard (OECD, 2007), such sectors may be defined as “high technology and knowledge
intensive sectors”. Such classification draws upon a number of different indicators, like R&D intensity, the share of
human capital employed in science and technology based activities, patent intensity, technology trade, and so on and so forth. The data we use in this paper indeed show that their rate of patent production is clearly higher than that of the
follows we describe the metrics used to operationalise the concepts of variety, coherence and cognitive distance, and discuss their interpretation. Table 1 presents instead a synthetic definition of the three indexes.
>>> INSERT TABLE 1 ABOUT HERE <<<
3.1 Knowledge variety measured by the informational entropy index
Knowledge variety is measured using the information entropy index. Entropy measures the degree of disorder or randomness of the system; systems characterized by high entropy are characterized by high degrees of uncertainty (Saviotti, 1988). Information entropy has some interesting properties (Frenken and Nuvolari, 2004) including multidimensionality.
Consider a pair of events (Xl, Yj), and the probability of their co-occurrence plj. A two dimensional
total variety (TV) measure can be expressed as follows:
l j lj lj p p Y X H TV ( , ) log2 1 (1)Let the events Xl and Yj be citations in a patent document of technological classes l and j
respectively. Then plj is the probability that two technological classes l and j co-occur within the
same patent. The measure of multidimensional entropy, therefore, focuses on the variety of co-occurrences or pairs of technological classes within patent applications.
The total index can be decomposed into ‘within’ and ‘between’ parts whenever the events being
investigated can be aggregated into a smaller number of subsets. Within-entropy measures the average degree of disorder or variety within the subsets; between-entropy focuses on the subsets, measuring the variety across them. Let the technologies i and j belong to the subsets g and z of the
average industrial sector. We may consider this evidence sufficient for our purposes and proceed to study how our sectors create and use technological knowledge.
classification scheme respectively. If one allows lSg and jSz (g = 1,…,G; z = 1,…, Z), we can write:
g Z S l jS lj gz p P (1a)Which is the probability to observe the couple lj in the subsets g and z, while the intra subsets variety can be measured as follows:
g z S l jS lj gz 2 gz lj gz /P p 1 log P p H (1b)The (weighted) within-group entropy can be finally written as follows:
G 1 g Z 1 z gz gzH P RTV (2)Between group (or unrelated variety) can instead be calculated by using the following equation:
G 1 g Z 1 z gz 2 gz Q P 1 log P H UTV (3)According to the decomposition theorem, we can rewrite the total entropy H(X,Y) as follows:
G g Z z gz gz Q P H H TV 1 1 (4)When considering the International Patent Classification (IPC), the whole set of technological classes can be partitioned on the basis of macro technological fields. For example, two 4-digit technologies A61K and H04L belong respectively to the macro classes A and H. In our notation, H04L would be the technology l and H the macroset Sg. Similarly A61K would be the technology j
and A the macroset Sz. This procedure allows for assessing the variety of observed combinations of
technologies, i.e. the extent to which the sectoral knowledge base is made of a few very frequent combinations or on the contrary on a wide scope of equiprobable combinations.
The first term on the right-hand-side of equation (4) is the between-entropy, the second term is the (weighted) within-entropy. We can label between- and within-entropy respectively as unrelated
technological variety (UTV) and related technological variety (RTV), while total information
entropy is referred to as general technological variety (Frenken et al., 2007; Hartog et al., 2012). Within-group entropy (or related variety) measures the degree of technological differentiation within the macro-field, while between-group variety (or unrelated variety) measures the degree of technological differentiation across macro-fields.
3.2 The knowledge coherence index
We calculate the coherence of the knowledge base, defined as the average relatedness or complementarity of a technology chosen randomly within the sector with respect to any other technology (Nesta and Dibiaggio, 2003; Nesta and Saviotti, 2006; Nesta, 2008).
Obtaining the knowledge coherence index requires a number of steps. We describe how to obtain the index at sector level. First of all, we need to calculate the weighted average relatedness WARl of
technology l with respect to all other technologies in the sector. This measure builds on the measure of technological relatednesslj (Nesta and Saviotti, 2005, 2006). We start by calculating the
relatedness matrix. The technological universe consists of k patent applications. Let Plk = 1 if the
patent k is assigned the technology l [l= 1, …, n], and 0 otherwise. The total number of patents assigned to technology l is
k lk
l P
O . Similarly, the total number of patents assigned to technology j is
k jk
j P
O . Since two technologies can occur within the same patent, OlOj
, and thus the observed the number of observed co-occurrences of technologies l and j is
k lk jklj P P
J . Applying this relationship to all possible pairs yields a square matrix (n n) in which the generic cell is the observed number of co-occurrences:
nn n nj lj j n l J J J J J J J J J ln 1 1 1 1 11 (5)
We assume that the number xij of patents assigned to technologies i and j is a hypergeometric
random variable of the mean and variance: O O
1 2 K O K K O K l j lj lj (7)
If the observed number of co-occurrences Jij is larger than the expected number of random
co-occurrences ij, then the two technologies are closely related: the fact that the two technologies
occur together in the number of patents xij is not common or frequent. Hence, the measure of
relatedness is given by the difference between the observed and the expected numbers of co-occurrences, weighted by their standard deviation:
lj lj lj lj J (8)
Note that this measure of relatedness has no lower or upper bounds: lj
;
. Moreover, the index shows a distribution similar to a t-test, so that if lj
1.96;1.96
, we can safely assume the null hypothesis of non-relatedness of the two technologies i and j. The technological relatedness matrix ’ can be considered a weighting scheme to evaluate the technological portfolio in the technological region.Following Teece et al. (1994), WARl is defined as the degree to which technology l is related to all
other technologies j≠l in the sector, weighted by patent count Pjt:
l j jt l j lj jt lt P P τ WAR (9)Finally the coherence of the sector knowledge base at time t is defined as the weighted average of the WARlt measure:
l l lt lt lt t P P WAR R (10)Note that this index implemented by analysing the co-occurrence of technological classes within patent applications, measures the degree to which the services rendered by the co-occurring technologies are complementary, and is based on how frequently technological classes are combined in use. The relatedness measure τlj indicates that utilization of technology l implies use
also of technology j in order to perform specific functions that are not reducible to their independent use. This makes the coherence index appropriate for the purposes of this study and marks a difference from entropy, which measures technological differentiation based on the probability distribution of pairs of technological classes across the patent sample.
If the coherence index is high, this means that the different pieces of knowledge have been well combined or integrated during the search process. Due to a learning dynamics, the actors in the sector have increased capability to identify the bits of knowledge that are required jointly to obtain a given outcome. In a dynamic perspective, therefore, increasing values for knowledge coherence are likely to be associated with profitable technological opportunities, typical of the exploitation stage in the technological life cycle, in which search behaviours are driven mostly by organized search within well identified areas of the technological landscape. Conversely, decreasing values of knowledge coherence are likely to be related to the exploration stage in the technological lifecycle, when search behaviour is driven mostly by random screening across untried areas of the technological landscape in the quest for new and more profitable technological trajectories.
3.3 The cognitive distance index
We need a measure of cognitive distance (Nooteboom, 2000) to describe the dissimilarities among different types of knowledge. A useful index of distance can be derived from technological
proximity proposed by Jaffe (1986, 1989), who investigated the proximity of firms’ technological
portfolios. Breschi et al. (2003) adapted this index to measure the proximity or relatedness between two technologies.
Let us recall that Plk = 1 if the patent k is assigned the technology l [l= 1, …, n], and 0 otherwise.
The total number of patents assigned to technology l is
k lk
l P
O . Similarly, the total number of
patents assigned to technology j is
k jk
j P
O . We can, thus, indicate the number of patents that are classified in both technological fields l and j as: ∑ . By applying this count of joint occurrences to all possible pairs of classification codes, we obtain a square symmetrical matrix of co-occurrences whose generic cell Vlj reports the number of patent documents classified in both
Technological proximity is proxied by the cosine index, which is calculated for a pair of technologies l and j as the angular separation or uncentred correlation of the vectors Vlm and Vjm.
The similarity of technologies l and j can then be defined as follows:
n 1 2 j n 1 2 l n 1 l j lj V V V V S m m m m m m m (11)The idea behind the calculation of this index is that two technologies j and l are similar to the extent that they co-occur with a third technology m. Such measure is symmetric with respect to the direction linking technological classes, and it does not depend on the absolute size of technological field. The cosine index provides a measure of the similarity between two technological fields in terms of their mutual relationships with all the other fields. Slj is the greater the more two
technologies l and j co-occur with the same technologies. It is equal to one for pairs of technological fields with identical distribution of co-occurrences with all the other technological fields, while it goes to zero if vectors Vlm and Vjm are orthogonal (Breschi et al., 2003)5. Similarity
between technological classes is thus calculated on the basis of their relative position in the technology space. The closer technologies are in the technology space, the higher is Slj and the
lower their cognitive distance (Engelsman and van Raan, 1991; Jaffe, 1986; Breschi et al., 2003).
The cognitive distance between j and l can be therefore measured as the complement of their index of technological proximity:
lj lj 1 S
d (12)
Having calculated the index for all possible pairs, it needs to be aggregated at the industry level to obtain a synthetic index of technological distance. This is done in two steps. First we compute the weighted average distance of technology l, i.e. the average distance of l from all other technologies.
5
For Engelsman and van Raan (1991), this approach produces meaningful results particularly at a ‘macro’ level, i.e. for mapping the entire domain of technology. An alternative approach to calculating technological proximity can be found in Sorenson and Singh (2007).
l j jt l j lj jt lt P P d WAD (13)where Pj is the number of patents in which the technology j is observed. The average cognitive
distance at time t is obtained as follows:
l l lt lt lt t P P WAD CD (14)The cognitive distance index measures the inverse of the similarity degree among technologies. When cognitive distance is high, this is an indication of the increased difficulty or cost the firm faces to learn the new type of knowledge which is located in a remote area of the technological space. Increased cognitive distance is related to the emergence of discontinuities associated with paradigmatic shifts in the sector knowledge base. It signals the combination of core technologies with unfamiliar technologies.
4 The Data
The information on patent applications required analyzing the evolution of the knowledge base in biotechnology and telecommunications was drawn from the Espacenet database provided by the EPO. The initial dataset consisted of 2,659,301 items (EU and international applications) for the period 1978-2005. The analysis focuses on two subsets of patent applications, identified by merging the classifications set by the OECD and the Observatoire des Sciences et des Techniques. We adopt these classifications to establish some tentative boundaries for biotechnology and telecommunications sectors,6 although in some cases this excludes some important classes.7 We
6
The EPO database would allow for the analysis of complementary dimensions like geographical aspects or the type of applicants. While these issues would surely enrich the general picture, they go well beyond the scope of this paper and represent interesting directions for future research.
7This remark isconvergent, though different, from what Fleming et al. 2007 attribute as a deficiency to the 4 digit level which is however the level of analysis of most of the contributions in the field.
use the updated 2005 dataset; the addition of classes does not neglect time trends: any new technology is automatically integrated into the classifications at that time.
4.1 Descriptive statistics
Our search strategy is based on queries reporting the IPC classes that define the knowledge intensive sectors under study, resulting in 11 IPC classes for the biotechnology sector, and 16 for the telecommunications sector (see Appendix 1).8
Table 2 reports the patent applications count for each sector and the share in the whole dataset. Compared to telecommunications sector, biotechnology is defined by a higher number of classes and a higher patent share of the overall dataset.
INSERT TABLE 2ABOUT HERE
It can be assumed that the dynamics of technological knowledge in our sectors is marked by important specificities, including the (potentially obvious) specificity that knowledge production in knowledge intensive sectors is likely to be higher than in other sectors.
Although at a first glance our knowledge intensive sectors seem to show a common growth pattern, biotechnology differs from telecommunications in relation to number of patents (twice as many in biotechnology as telecommunications). Also, the rate of growth in number of patents is more evenly distributed in biotechnology than in telecommunications during the period studied.
Figure 3 shows the dynamics of technological classes in each sector. Since the dynamics of technological differentiation in the two knowledge intensive sectors is influenced by the dynamics of the patent stock, we show the 5-year moving averages of class counts.
8
Though the use of IPC classes to define sectors’ boundaries may present some drawbacks, as they are function-oriented (Corrocher et al., 2007), the merging of two classifications allows our study to be much more inclusive than many other studies, and reduce the risk of neglecting important classes.
INSERT FIGURE 3ABOUT HERE
The number of classes can be interpreted as an approximate measure of the differentiation or scope
of each sector’s knowledge base. It is interesting that within the same sector differentiation of the
knowledge base increases with the stock of patents.
5 Empirical results
In this paper we study the dynamics of knowledge generation in two knowledge intensive sectors: biotechnology and telecommunications. We map the knowledge bases of these sectors based on patents granted by the EPO during the period 1981-2002. We do not distinguish the different types of economic actors among patent applicants, but consider each sector as a whole.9 For each sector we measure key properties of the knowledge base, such as variety, coherence, cognitive distance, and analyse their evolution.
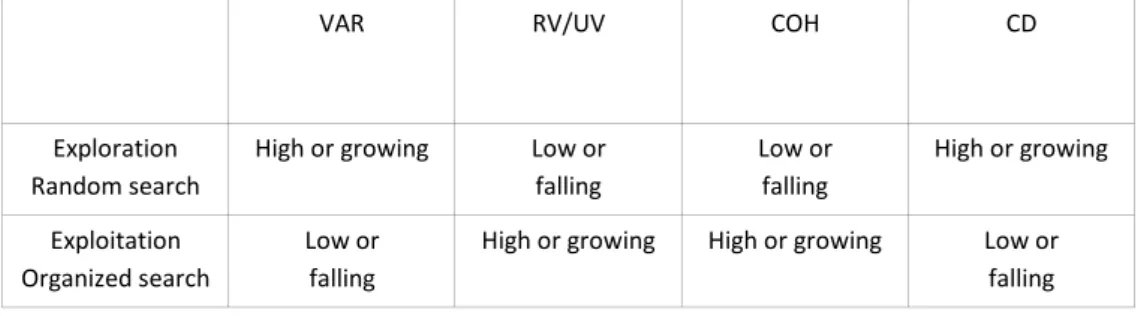
In order to provide guidance and advice on the interpretation of the empirical analysis, Table 3characterizes the expected relationships of the properties of the knowledge base during the phases of exploration (random search) and exploitation (organized search). VAR is overall variety, RV is related variety, UV is unrelated variety, COH is coherence and CD is cognitive distance.
>>> INSERT TABLE 3 ABOUT HERE <<<
Consistently with the conceptual framework articulated in Section 2, the nested dynamics of knowledge characteristics can provide a general representation of knowledge-intensive sectors suitable to analyze their dynamics. In this perspective, during exploration phases, one can observe low levels (or decreasing rates) of coherence of the sectoral knowledge-base and at the same time high levels (or increasing rates) of cognitive distance. In such a context, the concurring dynamics of
9
Related references in the field of innovation studies, see Libaers, Hicks and Porter (2012); Hicks and Hegde (2005); Fleming, Mingo and Chen (2007). These references focus on a firm level while our present contribution is at the sector level, but fruitful connections can be done on the way in which creativity emerges and diffuses.
variety are characterized by increasing levels, and a dominance of unrelated over related variety. By contrast, in exploitation stages the relationships amongst these variables are such that high levels of coherence are associated to low levels of cognitive distance, while variety is likely to be decreasing and related variety dominates over the unrelated one.
It is clear that exploration and exploitation in this framework are conceived as two poles of a continuum, which allows for the existence of different intermediate states, such that the transition to one state to another is smooth rather than discrete. This characterization can be nonetheless helpful to interpret the evolutionary patterns of knowledge-intensive sectors, like we do in the next sections by looking at the telecommunication and biotechnology sectors.
5.1 Random versus organized search
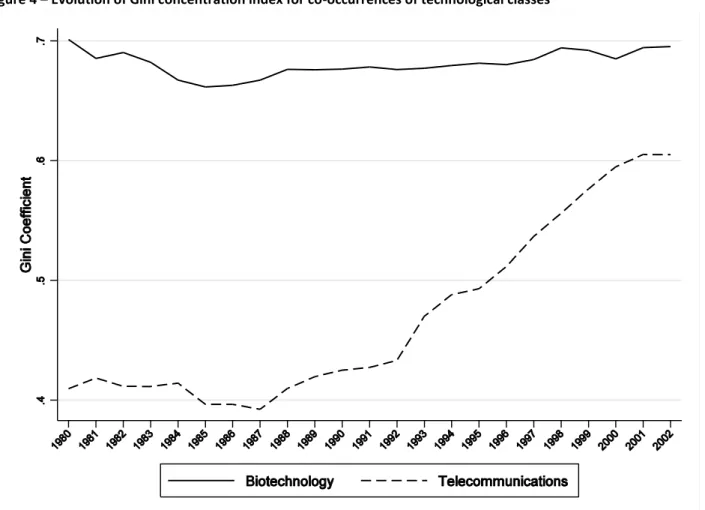
To analyse the transition from random to organized search, we construct a co-occurrence matrix of the technologies in the patents awarded to the knowledge intensive sectors in our database. Each patent is classified according to a primary and a number of secondary classes. The matrices are constructed by assigning frequencies to simultaneously occurring pairs of IPC classes. If there is a transition from random to organized search, we would expect a declining fraction of the off-diagonal cells to contain a growing share of the overall frequency of co-occurring technologies. In other words, there is a process of concentration of the technological choices made in the patents. Graphic representation of the co-occurrence matrix (Appendix Figures A1-A2) shows a growing share of few, and higher peaks amongst those representing all the possible technological combinations. We also checked for the existence of a transition from random to organized search using the more familiar Gini coefficient index for technological co-occurrences,10 starting with the relative frequency of co-occurrence of technological classes’ matrix, according to equation (1). The results of these calculations are reported in Figure 3.
10
We have calculated the relative Gini concentration index according to the formula
n 0 i i i Q) (P 1) (n 2 G where i
refers to the n-th technological co-occurrence, Q the observed share of each couple and P the share each couple would have had if the distribution would have been equiprobable.
INSERT FIGURE 4ABOUT HERE
The Gini coefficient is initially higher for biotechnology than for telecommunications. During the period of observation the coefficient shows a limited fall followed by a limited growth for biotechnology while it grows rapidly starting from an initial very low value for telecommunications The higher initial value of the Gini coefficient indicates that, at the beginning of the observation period, biotechnology had already reached a substantially higher level of concentration of technological combinations than telecommunications. For telecommunications, the level of technological concentration increased starting from 1987.
The results for both biotechnology and telecommunications are compatible with the existence of a transition from random to organised search. However, the timing and extent of the growth in technological concentration differ for the two sectors. It is precisely these differences that would remain hidden in concepts such exploration, exploitation or technological paradigms but that our methodology based on variety, coherence and cognitive distance measures can detect.11
5.2 The Evolution of Knowledge Bases in Knowledge Intensive Sectors
The notions of variety, coherence and cognitive distance are applied here to investigate the patterns of evolution of knowledge bases in biotechnology and telecommunications.
5.2.1 Biotechnology
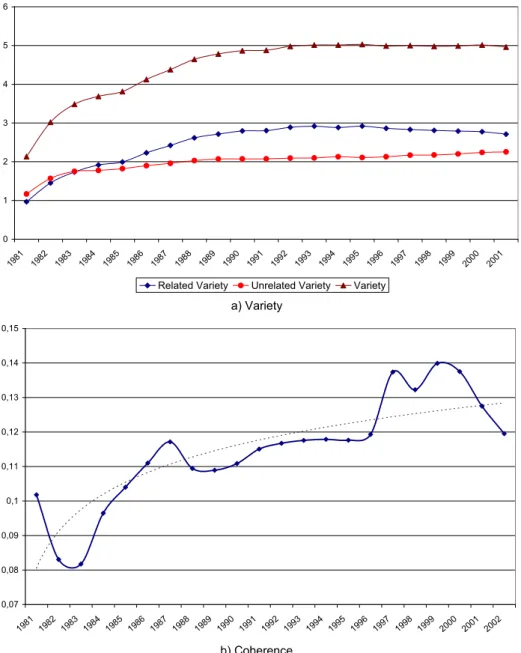
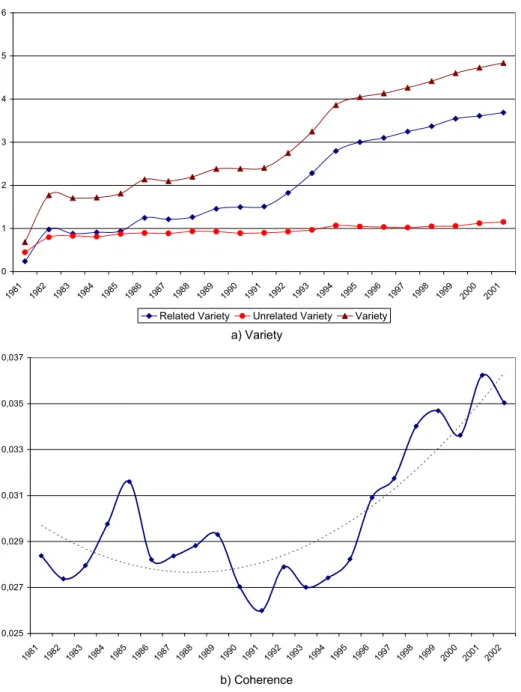
Figure 5 shows the evolution of variety (a), coherence (b) and cognitive distance (c).
11
At this point, we would like to mention that one problem will affect our interpretations: the duration of our period of observation. In order to be able to test the presence of a transition we would need to cover a period of time starting before the transition and ending after it. The first industrial applications of biotechnology started in the early to mid 1970s but our observations begin in 1981. Thus, we cannot decide whether in 1981 the transition had already occurred for biotechnology or whether biotechnology underwent no such transition since it always had such a high level of technological concentration. Similarly, based on their Gini coefficients, we can only suggest that telecommunications
INSERT FIGURE 5ABOUT HERE
Total variety grows at a falling rate for most of the period of observation, becoming stable in the early 1990s. After an initial period (1981-1983) dominated by unrelated variety related variety becomes dominant. However, after the mid 1990s the two seem to start converging. This suggests that in the early phases of the emergence of modern biotechnology most new knowledge was external knowledge, but after 1985, internal (to the sector) sources of knowledge became more important. Starting in the mid 1990s there is a trend towards convergence between related and unrelated variety likely caused by the emergence of a second generation of biotechnology linked to bioinformatics, a new type of competence from a different discipline. Further evidence about the
relationship among the variables can be found in Table 4, which shows the Spearman’s correlation
coefficients and the signs and strength of relationships.
INSERT TABLE 4ABOUT HERE
Figure 4b shows the dynamics of knowledge coherence where we can distinguish an overall trend with some deviations. Variety and coherence show overall positive trends. In 1982 and 1985, knowledge coherence shows two fast rises. The first of these deviations from the trend seems to be related to the related to unrelated variety ratio. In 1981-1982, when unrelated variety is higher than related variety, the coherence index falls. It begins to increase in 1983 and related variety overtakes unrelated variety. There is a rise in 1997 that cannot be explained in the same way. However, the two increases in knowledge coherence seem to coincide with the onset of absorption of two new generations of biotechnology, based on recombinant DNA and genomics, by incumbent firms (Saviotti and Catherine, 2008).12
12
In particular, the transition between the two generations led to a discontinuity in the pattern of inter-firm alliances. Within each generation, the number of alliances followed a life cycle, increasing first, reaching a maximum and then declining. Moreover, the competencies required in the two generations differed as bioinformatics was increasingly developed in the sequencing of genomes.
Cognitive distance (Figure 3, part (c)) decreases dramatically in the early years of the period observed and continues to fall until the first half of the 1990s when it becomes stable, although there are some cyclical fluctuations.
Biotechnology discussion
In the biotechnology sector, knowledge differentiation has increased measured by growth in variety accompanied by a trend towards increasing knowledge coherence and decreasing cognitive distance. These broad trends are marked by a change in the related to unrelated variety ratio, and by fluctuations in knowledge coherence and cognitive distance. If we take account of deviations from the trend in coherence, we see that the coherence index was falling at the beginning of the period of observation and began to increase when related variety overtook unrelated variety. The distinction between related and unrelated variety is here useful for the study of structural changes in knowledge as in the study of structural changes to economic systems (see Frenken et al., 2007; Saviotti and Frenken 2008).
In our current context the transition between the two generations of biotechnology produced contrasting trends: the first and second generation shared the same basic biological concepts, but the second generation required skills and competences related to concepts in bioinformatics which were new to biologists and came from another discipline. The first trend shows increased related variety and coherence; the second shows reductions in both. We observe (i) a tendency to convergence between related and unrelated variety beginning in the mid 1990s and (ii) a slowdown in the rate of growth of the coherence index between 1988 and 1996 followed by increased coherence beginning in 1997, due probably to the maturation of the second generation of biotechnology. We can summarize these events as follows:
- A drastic fall in the coherence of the knowledge base of biotechnology using firms, which
started probably in the late 1970s, slightly before the beginning of our period of observation, and continued up to 1983. This was due to the incorporation of completely new elements of knowledge in the knowledge base of biotechnology using firms and organizations
- A subsequent recovery of coherence due to the increased weight of related to unrelated
allowed them to improve their ability to integrate the new knowledge in their knowledge bases.
- Subsequent slightly falling levels of coherence within an increasing trend corresponding to
the emergence of a second generation of biotechnology involving the addition of new types of knowledge (bioinformatics) to the basic biological concepts introduced during the first generation.
5.2.2 Telecommunications
The evidence for telecommunications is different (Figure 6 a, b, c).
INSERT FIGURE 6 ABOUT HERE
Except for the earliest years (1981-1982) when all types of variety rose very rapidly, unrelated variety is virtually constant and growth in total variety is determined almost exclusively by related variety. Between 1991 and 1995 related variety seems to have undergone a transition which substantially increased its rate of growth. Following the previous reasoning this behaviour could be explained by radically new concepts introduced into telecommunications before the beginning of our period of observation, and a subsequent rise in variety due to the recombination of already known concepts and eventually by new forms of exploitation such as new types of industrial applications. This suggests that the telecommunications industry, pre-liberalization, was characterized by more discontinuities in the creation of knowledge than in the later period of liberalization and global competition. Furthermore, the Internet and mobile revolutions paradoxically may correspond to periods when recombination of existing knowledge dominated in the sector, despite being seen generally as periods of change and radical innovation.
The coherence index decreased gradually between 1981 and 1991 and shows an increase in line with the increase in the rate of growth of related variety. However, the rise in related variety is not incompatible with a rise in coherence. It is more difficult to explain the slow fall in coherence in the period 1981-1991. This may be related to the shift in technological paradigms, from circuit-switched technologies for basic services such as telephony and fax, to the new packet-circuit-switched technologies that provide advanced services such as the Internet, video-conferencing, video on
demand, Voice over IP, etc. (Fransman and Krafft, 2002; Krafft, 2004, 2007, 2010; Krafft and Salies, 2008; Quatraro, 2011). Note here that a rise in related variety does not necessarily lead to a fall in coherence, but is compatible with a rise or a small fall.
For telecommunications the cognitive distance index measuring knowledge cognitive distance is almost constant or falls slightly, with very pronounced deviations from the trend. Even in this case an increase in related variety does not necessarily involve an increase in cognitive distance. Table 3
presents the Spearman’s correlation coefficients and a synthesis of the relationships between
coherence, variety and cognitive distance.
Telecommunications discussion
Although the results for variety do not reflect the dominant view of the evolution of the telecommunications industry, we find some support for them in Fransman (2002, 2004, 2006, 2007) who provides an in-depth analysis of the history of the sector. In the early 1980s – and even before
– the national telecoms operators (at that time monopolists) were the leaders in research and design
of equipment and defence-related technologies. Their investment in R&D accounted for 15% on average, of their revenues (in 2012 it is 1-2%), and their patenting activity was driven mainly by development of scientific breakthroughs, in strategic competition at the international level. The
telecom operators’ laboratories (France Telecom’s CNET, Telecom Italia’s CSELT, BT’s Martlesham Laboratories in Europe, AT&T’s Bell Laboratories, NTT’s Electrical Communications
Laboratories overseas) included Nobel prizewinning researchers, and produced the Internet and mobile technology developments. The time of telecom liberalization, coupled with the Internet and mobile revolutions in the mid 1990s, resulted in developments aimed at commercial applications of the knowledge incorporated in patents registered by the research laboratories 10 or 15 years earlier. Thus, the more recent period has been dominated by new combinations of existing knowledge, compared to the pre-liberalization period which was characterized by the development of radically new knowledge. This result for variety, together with the results for integration and cognitive distance, can be interpreted as the impact of knowledge discontinuity that gave rise to modern telecommunications, namely convergence with information technology (IT) and the transition from analogue-electromechanical to digital-electronic technology, likely started long before the beginning of our period of observation. Rises in cognitive distance and decreases in coherence are
likely to have occurred during this early period. The developments during our period of observation were mostly incremental improvements to the knowledge base aimed at new industrial applications based on concepts that were part of the existing knowledge base of the telecommunications firms. Compared to biotechnology, telecommunications shows a less even trend towards increased knowledge variety and a bigger deviation of related and unrelated knowledge variety. This indicates that, during the period studied, the new knowledge being used in telecommunications was increasingly similar to the existing knowledge. This is confirmed by the almost constant value of the cognitive distance index. Furthermore, the relative rise in intra-group knowledge variety seems to indicate a progressive focus on new forms of knowledge within the technology. These trends can be interpreted as increased weight of exploitation relative to exploration in research activities in telecommunications (Antonelli et al., 2010).
5.3 General discussion
Our results show that biotechnology and telecommunications entered a mature phase although the timing of their entry differs. In this maturity phase, exploitation related activities tend to dominate over exploration activities. Our results support the existence of regular relationships amongst the properties of the knowledge base, and between these properties and exploration versus exploitation. For example, exploration tends to be associated with growing technological concentration, growing overall variety, and a dominance of unrelated on related variety, low or decreasing coherence, high or increasing cognitive distance. Exploitation is characterized by high technological concentration, a slowdown in the rate of growth of total variety, high or increasing related to unrelated variety ratio, high or increasing coherence, low or declining cognitive distance.
The present paper provides evidence of this transition in telecommunications and biotechnology, as well as evidence of differences between them. In both sectors variety increased for most of the period of observation. For both biotechnology and telecommunications, but especially the latter, growth in variety was dominated most of the time by related variety. This means that the growth of knowledge in biotechnology and telecommunications was due mostly to incremental changes. In the very early years of observation for biotechnology unrelated variety was higher than related variety and related variety dominated only from 1983. Unfortunately our patent time series does not cover
the whole period that would be required to observe the complete emergence and maturation of a new type of knowledge.
In biotechnology, the research leading to the creation of a new discipline (molecular biology) began in the 1930s and the critical events that catalysed the first industrial applications occurred only in the early to mid 1970s (1972 recombinant DNA, 1975 monoclonal antibodies). In order adequately to study the evolution of knowledge in biotechnology we would need data from the 1970s. Given this limitation we have to infer what likely occurred before the beginning of our period of observation. Based on the very low initial value of both variety and coherence and on the fact that coherence was still falling at the beginning of the period of observation, we expect unrelated variety to have been greater than related variety throughout the 1970s up to 1983. The 1970s was likely the period when the discontinuities in biotechnological knowledge due to the adoption of molecular biology would have emerged. In the 1980s the new knowledge began to be integrated into the knowledge base of biotechnology using firms. We can interpret this transition as the move from exploration to exploitation.
In the case of telecommunications, the emergence of a discontinuity is likely to have occurred even earlier with the result that dominance of related variety is likely to have started before the beginning of our period of observation. Telecommunications by the early 1980s had reached a phase in the technology life cycle where it was less dependent on fundamental research and was focused on applications, with some important overlaps with the electronics knowledge base. The most important recent development in telecommunications is convergence with IT and the birth of information and communication technology (ICT) and the info-communications industry. The critical events underlying the emergence first of IT and later ICT (the invention of the transistor, etc.) occurred in the 1950s. Moreover, knowledge in telecommunications during the period of observation was due largely to knowledge imported from electronics and IT and was highly application oriented. The new info-communications industry is based on existing knowledge (IP and mobile technologies) which did not find innovative application for some time. Packet-switch technologies, on which the Internet is based, emerged in the 1990s and generated a new set of commercial applications. While research laboratories were working on inventions, new applications for IP and mobile technologies were introduced with liberalization and contributed to gradual
changes in the knowledge base, evolving towards greater coherence of existing technological knowledge with more recent market applications.
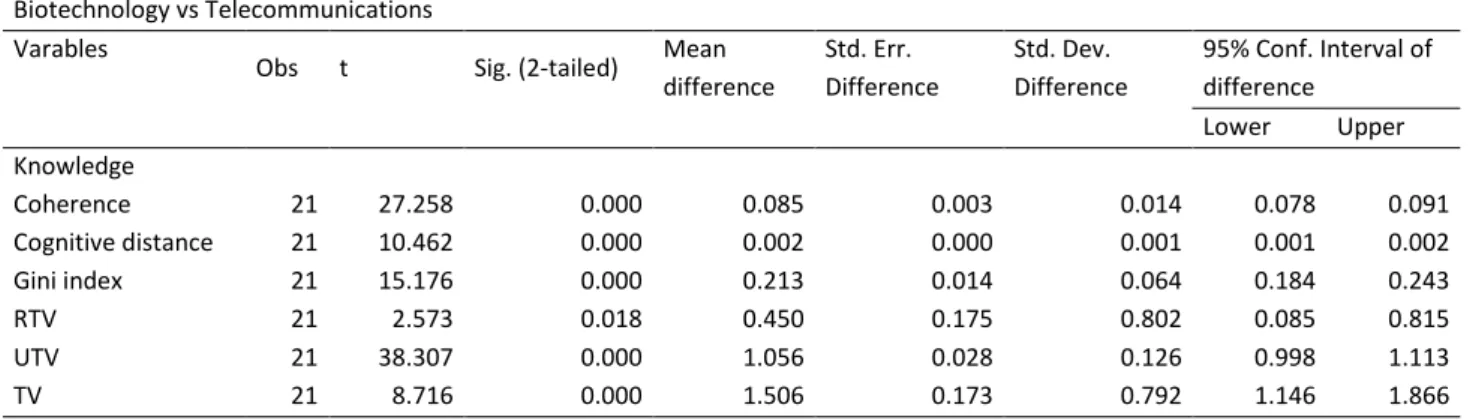
Table 5 presents the differences and similarities between the sectors with respect to the knowledge related variables allowing pair-wise mean comparison tests for each variable.
INSERT TABLE 5 ABOUT HERE
Finally, the distinction between related and unrelated variety is important. Since related variety is linked to more incremental types of change and unrelated variety to more radical change, we can expect coherence to decrease and cognitive distance to increase with an increase in unrelated variety but not necessarily with an increase in related variety. A process of growing knowledge differentiation occurs based on the set of concepts that caused the discontinuity. Thus, we see that an increase in related variety is compatible with an increase in coherence and a decrease in cognitive distance.
6 Conclusions
This paper provides a first exploration of the dynamics of technological knowledge creation in knowledge intensive sectors. We believe this type of research is important for the development of knowledge based economies and for society since it provides the tools required to represent and measure knowledge. Our results are promising but cannot be said to be either complete or definitive. We have mapped the evolution of technological knowledge in two knowledge intensive sectors. The three properties of knowledge introduced in this paper identify a common underlying mechanism combined with some sectoral specificities, related to the evolution of knowledge in the two sectors studied.
The emergence and the maturation of a knowledge intensive sector correspond closely to the exploration and exploitation phases. The properties of the knowledge bases analysed in this paper allow us to provide a more analytically accurate representation of the concepts of exploration and exploitation. It has been shown that there is not a one-to-one correspondence between the values of our knowledge base properties and the phases of exploration and exploitation: multiple patterns and
combinations of these properties can occur within either phase. Applying the three properties of the knowledge base makes analysis of the knowledge intensive sectors richer and more subtle and improves operationalization of the concepts of exploration and exploitation. We show also that the transition from random to organized search when a knowledge discontinuity emerges does not occur in a standardized way for all knowledge intensive sectors. Using our key properties we measured the extent of knowledge discontinuity, following its evolution and its effects on and how it is itself affected by the other properties. As expected, we found that the evolution of each knowledge intensive sector, while broadly compatible with a transition from random to organized search, presents some significant sectoral specificities. For example, the timing of the transition from the initial to the mature phase, the ratio of unrelated to related variety, the overall extent of cognitive distance vary considerably for the sectors studied. Thus, a technology life cycle must include the factors that determine the existence, duration and dynamics of technological knowledge.
These general conclusions need to be tested and articulated in more detail. Some avenues for future research include: (i) further exploration of the fine structure of technological knowledge creation process in the knowledge intensive sectors studied here, for instance, by relying more extensively on monographs and business history analyses; (ii) comparison with other sectors of different knowledge intensity, for example, in order to quantify more generally the relationships between our three properties; (iii) studying the impact of these processes of technological knowledge generation on industrial organization, including entry and exits, and relating technological knowledge creation problems with geographical issues13.
Although not definitive, the framework proposed in this paper may be helpful for analysing the effects of changing dynamics of knowledge bases across different stages of the technological life cycle at different levels. Immediate examples are the relationships between knowledge properties and economic performance at firm level (Nesta and Saviotti, 2005, 2006; Colombelli, Krafft, Quatraro, 2013 and 2014), at regional level (Quatraro, 2010, 2012), or country level (Antonelli et
al., 2010), as well as the establishment of links between the dynamics of knowledge properties and the evolution of skill compositions across sectors (Consoli and Elche, 2013).
7 References
Antonelli, C. (2008), Localized Technological Change. Towards the Economics of Complexity. Routledge: London.
Antonelli, C., Krafft, J., and Quatraro, F. (2010), “Recombinant Knowledge and Growth: The
Case of ICTs”, Structural Change and Economic Dynamics, 21(1), 50-69.
Blom M., Castellacci F, Fevolden A, Defense firms facing liberalization: innovation and export in an agent-based model of the defense industry, MPRA Paper No. 35702 (2012)
Breschi, S., Lissoni, F., and Malerba, F. (2003), ‘Knowledge relatedness in firm technological diversification’, Research Policy, 32, 69-97.
Colombelli, A., Krafft, J. And Quatraro, F. (2014), “High Growth Firms and Technological
Knowledge: Do gazelles follow exploration or exploitation strategies?”,Industrial and Corporate Change, 23, 261-291.
Colombelli, A., Krafft, J. and Quatraro F. (2013), “Properties of knowledge base and firm survival: Evidence from a sample of French manufacturing firms” Technological Forecasting
and Social Change, 80, 1469-1483.
Consoli, D. and Elche, D: (2013), “The evolving knowledge base of professional service sectors”, Journal of Evolutionary Economics, DOI 10.1007/s00191-012-0277-1.
Dosi G., 1982, “Technological paradigms and technological trajectories”, Research Policy, 11,
147–162.
Fleming, L. (2001), “Recombinant Uncertainty in Technological Search”, Management Science
47(1), 117-132.
Fleming, L., Mingo, S., and Chen, D. (2007), "Collaborative Brokerage, Generative Creativity, and Creative Success." Administrative Science Quarterly 52(3).443-475.
Fleming, L., Sorenson, O. (2001), Technology as a complex adaptive system: Evidence from patent data, Research Policy, 30(7), 1019-1039.
Fransman, M. (2002), Telecoms in the Internet Age. From Boom to Bust to… Oxford University Press: Oxford.
Fransman, M. (2004), ‘The telecoms boom and bust 1996-2003 and the role of financial markets’, Journal of Evolutionary Economics, 14(4), 396-406.
Fransman, M. (2007), The New ICT Ecosystem. Implications for Europe. Kokoro: Edinburgh. Fransman, M. (Ed.) (2006), Global Broadband Battles: Why the US and Europe Lag While Asia
Leads. Stanford: Stanford University Press.
Fransman, M., and Krafft, J. (2002), ‘Telecommunications’, in W. Lazonick (Ed.) IEBM Handbook of Economics. Thomson Learning: New York.
Freeman C., (1982), The Economics of Industrial Innovation, 2nd Edition, London, Frances Pinter
Frenken, K., Nuvolari, A. (2004), ‘Entropy Statistics as a Framework to Analyse Technological Evolution’, in J. Foster and W. Hölzl (eds), Applied Evolutionary Economics and Complex
Frenken, K., von Oort, F., Verburg, T. (2007), ‘Related Variety, Unrelated Variety and Regional Economic Growth’, Regional Studies, 41(5), 685-97.
Gilbert, Nigel, Pyka, Andreas, & Ahrweiler, Petra. (2001). Innovation networks - a simulation approach. Journal of Artificial Societies and Social Simulation, 4(3), 8.
Gilbert, Nigel, Ahrweiler, Petra, &Pyka, Andreas. (2007). Learning in innovation networks: Some simulation experiments. Physica A, 378, 100-109.
Grebel, T., Krafft, J., Saviotti, P.P. (2006), ‘On the Life Cycle of Knowledge Intensive Sectors’,
Revue de L'OFCE, june, 63-85.
Hartog, M., Boschma, R. and Sotarauta, M. (2012), “The Impact of Related Variety on Regional
Employment Growth in Finland 1993–2006: High-Tech versus Medium/Low-Tech”, Industry
and Innovation, 19, 459-476.
Hicks, D. and Hegde, D..(2005), “Highly Innovative Small Firms in the Markets for Technology”. Research Policy, 34 (5), 703-716.
Jaffe, A. (1986), ‘Technological Opportunity and Spillovers of R&D: Evidence from Firms' Patents, Profits, and Market Value’, American Economic Review, 76(5), 984-1001.
Jaffe, A. (1989), ‘Real Effects of Academic Research’, American Economic Review, 79(5), 957-70.
Katila, R. and Ahuja, G. (2002), “Something old, something new: a Longitudinal Study of
Search Behavior and New Product Introduction”, Academy of Management Journal, 45(6),
1183-1194.
Klepper, S. (1997), ‘Industry Life Cycles’, Industrial and Corporate Change, 6(1), 145-81.
Krafft, J. (2004), ‘Entry, Exit and Knowledge: Evidence from a Cluster in the
Info-communications Industry’, Research Policy, 33(10), 1687-1706
Krafft, J. (2007), ‘Telecommunications, the Internet and Mr Schumpeter’, in H. Hanusch and A.
Pyka (eds), Elgar Companion to Neo-Schumpeterian Economics. Edward Elgar: Cheltenham, U.K. and Northampton, Mass.
Krafft, J. (2010), “Profiting in the info-coms industry in the age of broadband: lessons and new
considerations”, Technological Forecasting and Social Change, 77(2), 265-278.
Krafft, J., and Salies, E. (2008), ‘The cost of switching Internet providers in the broadband
industry, or why ADSL has diffused faster than other innovative technologies: Evidence from
the French case’, Research Policy, 37(4), 706-719.
Libaers, D. Hicks, D. and Porter A. (2012), “A Taxonomy of Small Firm Technology
Commercialization”. Industrial and Corporate Change, 21(1), forthcoming.
Maggioni, M., Uberti, T.E. and Usai, S. (2011), “Treating Patents as Relational Data:
Knowledge Transfers and Spillovers across Italian Provinces, Industry and Innovation, 18, 39-67.
March, J. (1991), ‘Exploration and exploitation in organizational learning’, Organization Science, 2(1), 71-87.
Mowery, D. C. and Nelson R. R. (1999), Sources of Industrial Leadership. Studies of Seven
Mowery, D.C. and Rosenberg, N. (1998), Paths of Innovation. Technological Change in 20th
Century America. Cambridge University Press: Cambridge.
Nesta, L. (2008), ‘Knowledge and productivity in the world’s largest manufacturing corporations’, Journal of Economic Behavior and Organization, 67, 886-902.
Nesta, L. and Dibiaggio, L. (2003), “Technology strategy and knowledge dynamics: The case of Biotech”, Industry and Innovation, 10, 329-347.
Nesta, L., and Saviotti, P.P. (2005), ‘Coherence of the Knowledge Base and the Firm's
Innovative Performance: Evidence from the U.S. Pharmaceutical Industry’, Journal of
Industrial Economics, 53(1), 123-42
Nesta, L., and Saviotti, P.P. (2006), ‘Firm Knowledge and Market Value in Biotechnology’,
Industrial and Corporate Change, 15(4), 625-52.
Nightingale, P., 1998, “A cognitive model of innovation”, Research Policy, 27(7), 689-710. Nooteboom, B., 2000. Learning and innovation in organizations and economies, Oxford: Oxford University Press.
Quatraro, F., (2012), The Economics of Structural Change in Knowledge, London and New York, Routledge.
Quatraro, F., (2010), “Knowledge Coherence, Variety and Productivity Growth: Manufacturing
Evidence from Italian Regions, Research Policy, 39, 1289-1302.
Quatraro, F., (2011), “ICT Capital and Services Complementarities. The Italian Evidence, Applied Economics, 43, 2603-2613.
Saviotti P.P., Catherine D. (2008), ‘Innovation networks in biotechnology’, in H. Patzelt, T.
Brenner, D. Audretsch (eds), Handbook of Bioentrepreneurship. Springer (forthcoming).
Saviotti, P. P. (1988), ‘Information, variety and entropy in technoeconomic development’,
Research Policy, 17(2), 89-103.
Saviotti, P., and Frenken, K. (2008), ‘Export variety and the economic performance of
countries’, Journal of Evolutionary Economics, 18(2), 201-218.
Saviotti, P.P. (1996), Technological Evolution, Variety and the Economy, Edward Elgar: Cheltenham, U.K. and Northampton, Mass.
Saviotti, P.P. (2004), ‘Considerations about the production and utilization of knowledge’, Journal of Institutional and Theoretical Economics, 160, 100-121.
Saviotti, P.P. (2007), ‘On the dynamics of generation and utilisation of knowledge: The local character of knowledge’, Structural Change and Economic Dynamics, 18, 387-408.
Schumpeter, J., (1912), The Theory of Economic Development, Harvard University Press, Cambridge.
Sorenson, O., Rivkin, J.W., Fleming, L., 2006, “Complexity, networks and knowledge flow”, Research Policy, 35(7), 994-1017.
Sorenson, O. and Singh, J. (2007) “Science, Social Networks and Spillovers”, Industry and Innovation, 14, 219-238.
Teece, D., Dosi, G., Rumelt, G., and Winter, S., (1994), ‘Understanding Corporate Coherence: Theory and Evidence’, Journal of Economic Behavior and Organization, 23(1), 1-30.
Usher, A. (1954), History of Mechanical Inventions, Cambridge: Harvard University Press.
Weitzman, M. L. (1996), “Hybridizing growth theory”, American Economic Review, 86,
207-212.
Weitzman, M. L. (1998), “Recombinant growth”, Quarterly Journal of Economics, 113,
Table 1- Definitions of the variables
VAR Average degree of variety concerning the observed combination of technologies constituting the sectoral knowledge base. It is based on the informational entropy measure.
RV Related variety. It measures the average degree of variety of technological classes belonging to the same macro domains. It is based on the decomposition of the informational entropy measure.
UV Unrelated Variety. It measures the average degree of variety of the macro domains. It is based on the decomposition of the informational entropy measure.
COH Knowledge Coherence. It measures the average degree of complementarity amongst the technology constituting the sectoral knowledge base
CD Cognitive Distance. It measures the average degree of dissimilarity amongst the technology constituting the sectoral knowledge base
Table 2 – Overall distribution of patent applications across the sectors
# %
Biotechnology 321449 12.08
Telecommunications 115735 4.35
Table 3 - Relation between search patterns and the expected dynamics of the variables
VAR RV/UV COH CD
Exploration Random search
High or growing Low or falling Low or falling High or growing Exploitation Organized search Low or falling
High or growing High or growing Low or falling