HAL Id: hal-01203579
https://hal.inria.fr/hal-01203579
Submitted on 24 Feb 2017
HAL is a multi-disciplinary open access
archive for the deposit and dissemination of
sci-entific research documents, whether they are
pub-lished or not. The documents may come from
teaching and research institutions in France or
abroad, or from public or private research centers.
L’archive ouverte pluridisciplinaire HAL, est
destinée au dépôt et à la diffusion de documents
scientifiques de niveau recherche, publiés ou non,
émanant des établissements d’enseignement et de
recherche français ou étrangers, des laboratoires
publics ou privés.
Myocardial Infarct Localization using Neighborhood
Approximation Forests
Héloïse Bleton, Jan Margeta, Herve Lombaert, Hervé Delingette, Nicholas
Ayache
To cite this version:
Héloïse Bleton, Jan Margeta, Herve Lombaert, Hervé Delingette, Nicholas Ayache. Myocardial
In-farct Localization using Neighborhood Approximation Forests. Statistical Atlases and Computational
Modeling of the Heart (STACOM 2015), Oct 2015, Munich, Germany. �hal-01203579�
Myocardial Infarct Localization using
Neighbourhood Approximation Forests
H´elo¨ıse Bleton, J`an Margeta, Herv´e Lombaert, Herv´e Delingette, and Nicholas Ayache
INRIA Sophia-Antipolis, Asclepios Team, France
Abstract. This paper presents a machine-learning algorithm for the automatic localization of myocardial infarct in the left ventricle. Our method constructs neighbourhood approximation forests, which are trained with previously diagnosed 4D cardiac sequences. We introduce a new set of features that simultaneously exploit information from the shape and motion of the myocardial wall along the cardiac cycle. More precisely, characteristics are extracted from a hyper surface that represents the profile of the myocardial thickness. The method has been tested on a database of 65 cardiac MRI images in order to retrieve the diagnosed infarct area. The results demonstrate the effectiveness of the NAF in predicting the left ventricular infarct location in 7 distinct regions. We evaluated our method by verifying the database ground truth. Following a new examination of the 4D cardiac images, our algorithm may detect misclassified infarct locations in the database.
Keywords: Machine Learning, Neighbourhood Approximation Forests, myocardial infarction, wall thickness.
1
Introduction
Cardiac imaging is now routinely used for evaluating specific anatomical and functional characteristics of hearts. For instance, the localization of cardiac in-farcts requires contrast agent injection and a thorough examination of the my-ocardial wall thickness and its motion [3][4]. We propose to assist and automate this process with a system that automatically categorizes the localization of in-farcts in the left ventricle. We exploit information from existing databases of 4D cardiac image sequences, that already contain the infarct localization from previously diagnosed patients. In such context, 4D images should be compared in an image reference space.
One way to represent the population is with statistical anatomical atlases [2] that are constructed by combining all available subjects in a single average reference. In this paper, we favor a representation that considers all available sub-jects in a database. Here, we consider data that is classified along their recorded infarct localization. For this purpose, multi-atlas methods [5] could be used. However, they require costly image registrations [6]. Retrieval systems, instead, find images of subjects in a database that are close to a query image [7]. The information on the infarct location of the retrieved subjects may be relevant for establishing diagnoses in previously unseen subjects.
Content based retrieval systems require the notion of distances between im-ages [10]. They have been used in other areas such as neuro-imim-ages [11] or en-domicroscopy [8]. However, to the best of our knowledge, they were not applied for categorizing infarct locations in 4D cardiac images. This raises the question on how distances between 4D images should be defined. We suggest to learn this metric between subjects that belong to different categories of infarct lo-cations, using the Neighborhood Approximation Forests algorithm (NAF) [11]. This machine-learning approach approximates distances between new query im-ages and imim-ages in a database, via an affinity matrix between subjects. Decision forests have already been applied for processing medical images such as a fully automatic segmentation of the left ventricle [9]. Our method builds upon simple shape and motion features derived from binary segmentation that are fast to compute and based on a hyper surface representing the myocardial thickness along the cardiac cycle.
The contribution of this paper is the use of a distance learning approach for automatically categorizing the location of cardiac infarcts from 4D cardiac im-age sequences. We tested several features that are extracted from a novel hyper surface representation of the thickness profile. The next section describes our lo-calization method, and is followed by our results that evaluates the performance of the proposed features. We discuss on the differences found in our results and elaborate on future improvements of our infarct localization method.
2
Method
Our localization method consists of categorizing automatically the location of cardiac infarcts via a retrieval approach based on the Neighborhood Approxi-mation Forests (NAF). We now suggest feature representations that are specific for the localization of infarcts in 4D cardiac image sequences. The underlying assumption is that infarction affects the myocardial shape and motion since com-plex phenomena are often involved, such as wall thickening or chamber dilation [3].
2.1 Neighbourhood Approximation Forests
The NAF consists of an ensemble of binary decision trees designed for the pur-pose of clustering similar cardiac sequences together. Its automatic learning of image neighborhoods provides the capability of querying a training dataset of images, I, by retrieving the most similar images given a previously unseen im-age, J . Further details of the algorithm are described in [11]. Three phases are required: feature extraction, training and testing stages. We now describe how to apply them for the specific problem of locating infarcts in 4D images.
The learning process aims at finding the optimal shape and motion features for predicting the category of infarct location. Our training dataset contains 4D cardiac image sequences, each labeled with a category of infarct location, e.g., infarct is in septal or lateral area. Each 4D image should have an associated 4D segmentation mask of the left ventricular muscle. In our case, each binary
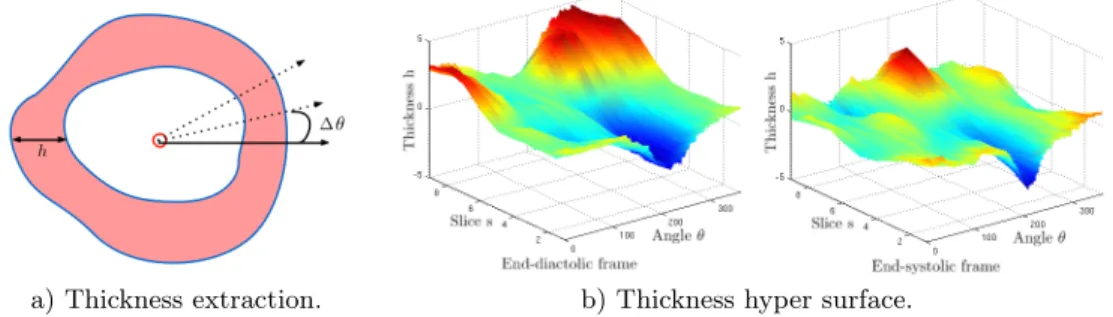
mask has been cropped with a bounding box centered on the left ventricle and oriented such that both ventricles are aligned horizontally along a left-right axis. Feature extraction A surface representing the thickness profile over the car-diac cycle is first extracted from 4D myocardial masks. The barycenter of the left ventricle mask is computed for each slice and each frame of the 4D mask. Rays are subsequently casted from the barycenter to the exterior of the mask, as illustrated on Fig. 4. The ray-binary mask intersection is used to evaluate the myocardial thickness at each angle. As a result, the myocardial thickness h(s, t, θ) is represented by a hyper surface, where the spatial coordinates are the corresponding slice s, the frame time t, and the angle θ.
The thickness profile is smoothed out by a Gaussian kernel filter (with a width of 0.4) to reduce possible segmentation errors. The thickness profile is also normalized in order to adjust its thickness values in a standardized common scale, such that the average thickness value over the 4D hyper surface is 0 and the standard deviation 1.
a) Thickness extraction. b) Thickness hyper surface.
Fig. 1. a) Thickness extraction along the myocardial mask in red, red circle shows the mask barycenter, h denotes the thickness and θ the angle of a casted ray. b) 4D thickness profile at end-diastolic and end-systolic frames, parameterized by h(s, t, θ), with the slice s, the frame time t, and the angle θ.
As the space and temporal resolutions are specific to each image, point sam-pling should be normalized. The slice position s is normalized between 0 at the apex, and 1 at the left ventricular base. The frame time t is normalized between 0 at diastole, and 1 at the end of the cardiac cycle. The angle is kept between 0 and 2π, starting from a reference in the lateral wall.
Below, we describe groups of features f (I) extracted from the thickness pro-files. In the following cases, h(s, t, θ) denotes the thickness, sampled on the slice s, the frame time t and the angle θ.
Feature 1: Raw thickness. The profile constitutes the input features for each tree:
f1(I) = {h(si, tj, θk)}i,j∈[0;1], and θ∈[0◦;360◦].
In other words, given a 4D image I, this feature representation consists of the list of surface heights. This should characterize infarcts as a function of my-ocardial thickness over space and time.
Feature 2: Raw thickness and thickness differences. This feature repre-sentation provides the raw thickness profile and the absolute difference of thick-nesses sampled between the frame t0 and each frame t:
f2(I) = {h(si, tj, θk), |h(si, t0, θk) − h(si, tj, θk)|}i,j∈[0;1], and θ∈[0◦;360◦].
This feature is similar to the first feature representation, however, the thick-ness difference is added. This should characterize infarcts as discrepancies in myocardial thickness over space and time.
Training phase During this phase, the forest is trained: parameters of each tree are fixed using the training set I and the distance measurement ρ(In, Im)
between each pair of images (In,Im). The distance metric ρ(In, Im) for a
regres-sion problem is defined as follows: ρ(In, Im) = |θa(In) − θa(Im)|, where θa(In)
denotes the angle that corresponds to the infarct location, as illustrated on Fig. 3a. A set of visual features f (In) is computed from each training image In.
Along the forest construction, each tree tests a randomized subset of f (In). A
tree is grown by finding at each node p, the optimal split of the dataset into two branches (IpLeft, IpRight) that best separates the incoming images Ip in compact
clusters. In the best case, cardiac images with similar infarct location should end in one leaf. In other words, the best threshold τp is found for each selected
feature fmp. The couple (parameters mp,threshold τp) are stored at each node
awaiting for the testing phase.
Obtaining the most compact partioning of Ipis also equivalent to maximizing
the information gain G (Eq. 1) at node p: (mp, τp) = arg max
m,τ G(Ip, m, τ ), (1)
where m is the set of features, and τ the set of potential thresholds, and G(Ip, mp, τp) = C(Ip) − |IpRight| |Ip| C(IpRight) − |IpLeft| |Ip| C(IpLeft), (2)
where the set of images IpLeft of the left child node is defined by the test
function Γ (mp, τp) applied on the images of the parent node, and similarly
for the definition of the right node. Moreover, the compactness is defined by C(A) = 1
|A|2
P
Ii∈A
P
Ij∈Aρ(Ii, Ij), and |A| is the number of images within a
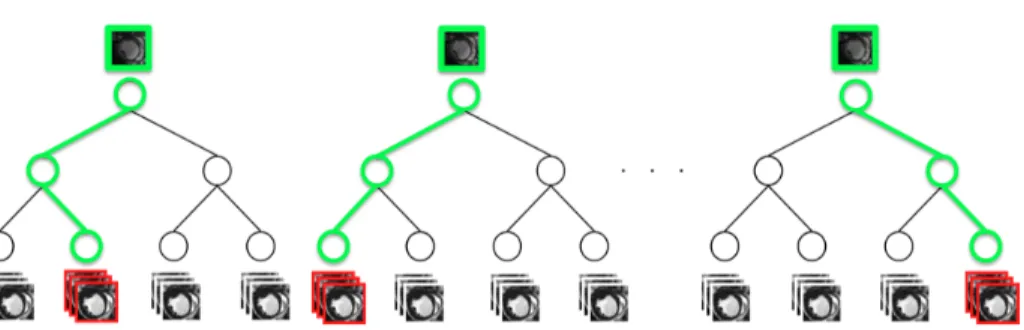
subset A. More details on the training phase of the NAFs can be found in [11]. Testing phase During the following phase, one testing cardiac image travels across all tree nodes using the trained decisions, starting from the root node and ending in one leaf. Each leaf contains the training images for which similar decisions were taken. Consequently, when a testing image reaches a final leaf, it is considered a neighbor of the training images already present in the same final leaf. An affinity matrix is built by repeating this neighborhood approximation for each tree by storing the affinities between all testing images and the training images, as illustrated in Fig. 2.
Fig. 2. The NAF testing phase. The trained NAF determines the most similar images (in the bottom/ in red) of the testing cardiac sample (in the top of each tree/ in green), by performing trained tests at each node.
Indeed, the NAF algorithm keeps a record of the most similar cardiac se-quences to a testing image Jj in a similarity matrix W , where rows correspond
to training images, and columns to testing images. For each tree, W (i, j) is in-cremented when Jj reaches the leaf node that also includes the training image
Ii [11]. In this paper, the resulting affinity matrix determine the angle, where
the myocardial infarct is approximatively located (refer to Fig. 3). The predicted angle on a testing image Jj, is based on the resulting similarity matrix such that:
θa(Jj) = P iW (i,j)θa(Ii) P iW (i,j)
3
Results
3.1 Dataset and settings
Cardiac images of patients with coronary artery disease and a left ventricle infarction were randomly selected from the Defibrillators to Reduce Risk by Magnetic Resonance Imaging Evaluation database (DETERMINE) included in the Cardiac Atlas Project (CAP) [1]. 65 4D left ventricular masks were obtained with the software CAP Client, made available by the Left Ventricular Segmenta-tion Challenge conducted for the Statistical Atlases and ComputaSegmenta-tional Models of the Heart Workshop (STACOM) in 2011. Each mask is annotated by addi-tional clinical information including the infarct location (anterior-septal, ante-rior, anterior-lateral, lateral, inferior-lateral, infeante-rior, inferior-septal).
3.2 Evaluation of infarct localization
We validated our approach by retrieving the neighbours and the predicted angle by forming a training set and a testing set from the expert-annotated database. Some of the cardiac images are duplicated to obtain balanced class distribution in the training set. Therefore, the database consists of 115 images that groups 7 types of infarct location together.
The 10-fold cross validation technique is used for estimating the accurate performance of our classifier. The set of 115 images is partitioned into 10 subsets: 1 subset is randomly chosen as the testing set while the 9 remaining subsets form
the training set. This method is repeated 10 times by varying the testing subset. Each infarct location in the dataset is labeled by an angle according to Fig. 3a. Left-ventricular regions cover large areas, spanning up to 60◦. Following the testing phase of the NAF method, the predicted angle of each testing image is compared to the expected angle of infarction.
We proposed two types of features to locate the infarct of unseen cardiac images. Our forest is composed of 100 trees where the maximal depth is 20. Results associated with each type of features are shown in Fig. 3b, where the average angle of each category is reported.
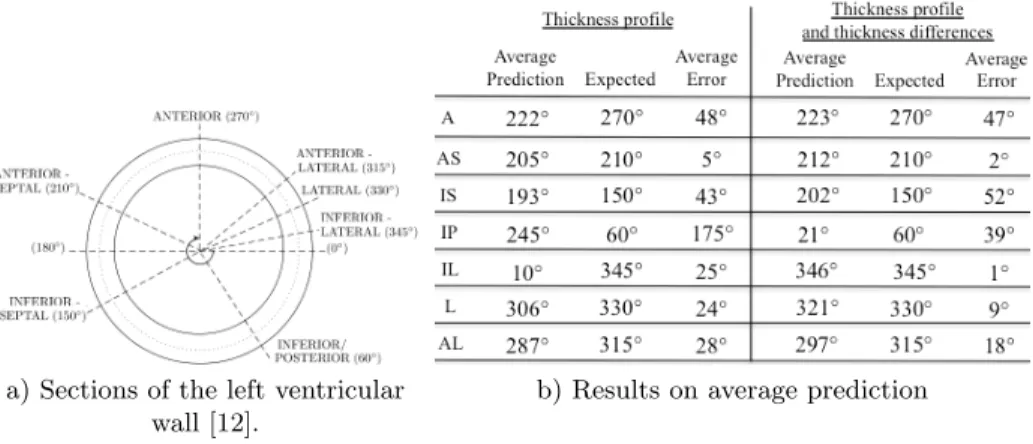
a) Sections of the left ventricular wall [12].
b) Results on average prediction of infarct location.
Fig. 3. a) Sections of the myocardial wall related to an angle, ranging from 0◦to 360◦. b) Results and comparison with the expected angle for each category: anterior (A), anterior-septal (AS), inferior-septal (IS), inferior-posterior (IP), inferior-lateral (IL), lateral (L), anterior-lateral (AL).
With the first type of features, which characterizes the thickness of the my-ocardium, the localization of seven areas lead to average angular errors between 5◦and 48◦, which are below the maximal span of each areas of 60◦. However, the inferior-posterior area lead to an average error of 175◦. This leads us to examine each 4D image labeled with inferior-posterior infarct, revealing potentially mis-classified infarct location, as seen on Fig. 4. The main drawback of this first type of features is that only the myocardial wall shape is taken into account, notably, only the wall thinning in the infarct area or the wall thickening in the opposite wall of the infarct. Indeed, considering only the minimal thickness is not enough to localize an infarct, as the thickness of the myocardial wall changes over time and possibly gets thinner at end-systole than in the infarct area.
Motivated by the previous results, motion information is combined to shape information in the features 2 by considering the difference of thicknesses over time. Following a myocardial infarction, the cardiac wall may not necessarily change over the cardiac cycle whereas the wall thickness of a healthy heart changes over time. Consequently, our second feature type that captures the thickness differences over time infarcts should indicate infarct as areas where the thickness is not changing over time.
With the second type of features, the infarct location is predicted with an average angular error of up to 52◦from the expected angle in all categories. This remains below the maximal span of each areas of 60◦. Our algorithm is able to locate the infarct location within the right area even if there are potential sources of error in the dataset. For instance, the database ground truth may be corrupted by misaligned binary masks if the septum is not perfectly located at 180◦as illustrated on Fig. 3a.
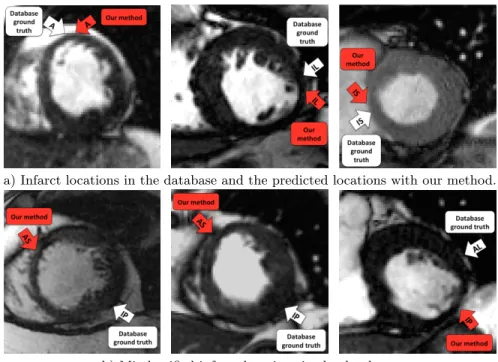
a) Infarct locations in the database and the predicted locations with our method.
b) Misclassified infarct locations in the database.
Fig. 4. The white arrows represent the database ground truth, whereas the red arrows show the infarct location that was predicted with our method. In Fig. 4b, our algo-rithm underlined a possible misclassification as the infarct seems located in another myocardial area.
4
Conclusion
We used our machine learning neighbourhood-based algorithm for detecting the infarct in the left ventricular wall. We propose 2 types of features for improving the infarct localization where shape and motion information have been taken into consideration. These features have been extracted from a hyper surface that represents the thickness profile and has been designed along the cardiac cycle. We learnt to approximatively locate the infarct by retrieving the corresponding angle from the undiagnosed images. The most relevant infarct location is based on an affinity matrix. Our approach may be relevant in assisting clinical diagnosis of left ventricular infarct and may sometimes detect misclassified infarct in a database. Future work will focus on evaluating local wall deformation fields to
better localize the infarct over the 3D cardiac volume. We could also consider to collect the myocardial thickness from 4D cardiac images instead of binary masks.
5
Acknowledgements
The authors wish to thank Alistair Young for providing the DETERMINE database. This research is partially funded by the ERC Advanced Grant Me-dYMAFunding.
References
[1] Fonseca, C., Backhaus, M., Bluemke, D., Britten, R., Chung, J., Cowan, B., Dinov, I., Finn, J., Hunter, P., Kadish, A., Lee, D. Lima, J., Medrano–Gracia, P., Shiv-kumar, K., Suinesiaputra, A., Tao, W., Young, A.: The Cardiac Atlas Project. An imaging database for computational modeling and statistical atlases of the heart. Bioinformatics, 27(16), 2288–2295 (2011)
[2] Perperidis, D., Mohiaddin, R., Rueckert, D.: Construction of a 4D statistical atlas of the cardiac anatomy and its use in classification. Medical Image Computing and Computer–Assisted Intervention–MICCAI 2005, 402–410 (2005)
[3] Medrano–Gracia, P., Suinesiaputra, A., Cowan, B., Bluemke, D., Frangi, A., Lee, D., Lima, J., Young, A.: An atlas for cardiac MRI regional wall motion and infarct scoring. In: Statistical atlases and computational models of the heart. Imaging and modelling challenges, 188–197 (2013)
[4] Wei, D., Sun, Y., Ong, S., Chai, P., Teo, L., Low, A. . Three-dimensional segmenta-tion of the left ventricle in late gadolinium enhanced MR images of chronic infarcsegmenta-tion combining long-and short-axis information. Medical Image Analysis, 17(6), 685–697 (2013)
[5] Rohlfing, T., Brandt, R., Menzel, R., Russakoff, D. B., Maurer Jr, C. R.: Quo vadis, atlas–based segmentation?. In Handbook of Biomedical Image Analysis, 435– 486 (2005)
[6] Heckemann, R., Keihaninejad, S., Aljabar, P., Rueckert, D., Hajnal, J., Hammers, A.: Improving intersubject image registration using tissue-class information benefits robustness and accuracy of multi-atlas based anatomical segmentation. Neuroimage, 51(1), 221–227 (2010).
[7] M¨uller, H., Michoux, N., Bandon, D., Geissbuhler, A.: A review of content–based image retrieval systems in medical applicationsclinical benefits and future directions. Int. J. Med. Inform., 73(1), 1–23 (2004).
[8] Andr´e, B., Vercauteren, T., Buchner, A., Wallace, M., Ayache, N.: A smart atlas for endomicroscopy using automated video retrieval. Medical Image Analysis, 15(4), 460-476 (2011)
[9] Margeta, J., Geremia, E., Criminisi, A., Ayache, N.: Layered spatio-temporal forests for left ventricle segmentation from 4D cardiac MRI data. In: Statistical atlases and computational models of the heart. Imaging and modelling challenges, 109–119 (2012)
[10] Swets, D., Weng, J.: Using discriminant eigenfeatures for image retrieval. IEEE T. Pattern Anal., (8), 831–836 (1996)
[11] Konukoglu, E., Glocker, B., Zikic, D., Criminisi, A.: Neighbourhood approxima-tion using randomized forests. Medical Image Analysis, 17(7), 790-804 (2013)
[12] Cerqueira, M., Weissman, N., Dilsizian, V., Jacobs, A., Kaul, S., Laskey, W., Pennell, D., Rumberger, J., Ryan, T., Verani, M.: Standardized Myocardial Seg-mentation and Nomenclature for Tomographic Imaging of the Heart. Circulation, 105, 539–542 (2002)