3
Université de Montréal
Study of Rgmc regulation by iron levels, anemia, inflammation and hypoxia
Par
Marco Salbany Constante Pereira
Programmes de biologie moléculaire Faculté des études supérieures
Mémoire présentée à la Faculté des études supérieures en vue de l’obtention du grade de maître
en biologie moléculaire
Fevrier, 2006 t
5%
Q5Lj
o
Zco&
Université
dl1
de Monfréal
Direction des bibliothèques
AVIS
L’auteur a autorisé l’Université de Montréal à reproduite et diffuser, en totalité ou en partie, par quelque moyen que ce soit et sur quelque support que ce soit, et exclusivement à des fins non lucratives d’enseignement et de recherche, des copies de ce mémoire ou de cette thèse.
L’auteur et les coauteurs le cas échéant conservent la propriété du droit d’auteur et des droits moraux qui protègent ce document. Ni la thèse ou le mémoire, ni des extraits substantiels de ce document, ne doivent être imprimés ou autrement reproduits sans l’autorisation de l’auteur.
Afin de se conformer à la Loi canadienne sur la protection des renseignements personnels, quelques formulaires secondaires, coordonnées ou signatures intégrées au texte ont pu être enlevés de ce document. Bien que cela ait pu affecter la pagination, il n’y a aucun contenu manquant.
NOTICE
The author of this thesis or dissertation has granted a nonexclusive license allowing Université de Montréal to reproduce and publish the document, in part or in whole, and in any format, solely for noncommercial educational and research purposes.
The author and co-authors if applicable retain copyright ownership and moral rights in this document. Neither the whole thesis or dissertation, nor substantial extracts from it, may be printed or otherwise reproduced without the author’s permission.
In compliance with the Canadian Privacy Act some supporting forms, contact information or signatures may have been removed from the document. While this may affect the document page count, it does flot represent any loss of content from the document.
Faculté des études supérieures
Ce mémoire intitulé
Study of Rgmcregulation by iron levels, anemia, inflammation and hypoxia
Présenté par:
Marco Salbany Constante Pereira Constante
a été évaluée par un jury composé des personnes suivantes:
Rejean Lapointe président-rapporteur Manuela Santos directrice de recherche Sylvie Mader membre du jury
III
Résumé
La surcharge génétique en fer, ou l’hémochromatose, peut être causé par des mutations au niveau du gène HFE, hémojuveline (HJV) et hepcidine. Des patients portant des mutations HFE ou HJV ont de faibles niveaux d’hepcidine, indiquant que ces protéines sont impliquées dans la régulation des niveaux basais d’hepcidine.
OBJECTIFS: Nous tentons d’élucider les conditions dans lesquelles l’orthologue de HJV chez la souris, soit la molécule Rgmc (repulsive guidance molecule C) pourraient influencer le métabolisme du fer. Nous
investiguerons la réponse de Rgmc aux divers modificateurs du métabolisme du fer: niveaux de fer, anémie, hypoxie et inflammation. RÉSULTATS: Nous avons trouvé que Rgmc, chez la souris, a un patron d’expression similaire à celui retrouvé chez l’humain étant exprimé dans le muscle squelettique, le coeur et les hepatocytes au niveau du foie. Ceci indique que le contrôle de la fonction de Rgmc, dans cet organe, est probablement médié par les hépatocytes. De plus, nous avons trouvé que l’expression hépatique de I’ARNm de Rgmc est régulée par l’inflammation et l’hypoxie, mais non par les niveaux de fer, la perturbation d’HFE ou l’anémie. Finalement, nous avons étudié les voies de régulation de Rgmc en réponse à l’inflammation et nous avons démontré que Rgmc se retrouve dans la voie de Tlr4, ceci étant similaire à ce qui a été trouvé pour hepcidine. Cependant, les voies de régulation de Rgmc et hepcidine dévient et alors que li-6 régule hepcidine, nous avons trouvé que Rgmc est régulé par Tnf-c.
CONCLUSION: La regulation de I’ARNm de Rgmc en réponse à l’hypoxie et l’inflammation induite par le LPS pourrait contribuer au contrôle de l’homéostasie du fer dans ces conditions. Des voies signalitiques differéntes régulent Rgmc et hepcidine en réponse au LPS suivant l’activation de Tlr4.
SIGNIFICATION: Ces résultats nous donne une idée considérable des voies régulatrices ayant un impact sur les changements du métabolisme du fer. Ces changements pourrait être pertinent pour expliquer l’origine de plusieurs pathologies affectant l’homéostasie du fer.
Mots Clés
Inflammation, fer, LPS, TIr4,Tnf-a, Il-6, Rgmc, hepcidine, hémojuveline, anémie des maladies chroniques, hémochromatose héréditaire, hémochromatose juvénile.
Abstract
Genetic iron overload. or hemochromatosis, can be caused by mutations in HFE, hemojuvelin (HJV) and hepcidin genes. Patients with mutations either on HFE or HJV have low hepcïdin levels, indicating that these proteins are implicated in the regulation 0fhepcïdin basal levels. OBJECTIVES: We intend to elucidate in which conditions the mouse ortholog of HJV, the repulsive guidance molecule c (Rgmc) may influence iron metabolism by investigating its response to the modifiers of iron homeostasis: iron tevels, anemïa, hypoxia and inflammation. RESULTS: We found that mouse Rgmc has the same pattern of expression as found in humans, being expressed in skeletal muscle, heart and liver, where it was expressed in hepatocytes. Additionally, we found that hepatic Rgmc mRNA expression was regulated by systemic inflammation and hypoxia, but flot by iron leveis, disruption of Hfe or
f32m, or anemia. Finally, we studied the Rgmc regulatory pathway in
response to inflammation and found that Rgmc is on the T1r4 pathway, similar to what is found for hepcidin. However, Rgmc and hepcidin regulatory pathways deviate and while Il-6 regulates hepcidin, we found that Rgmc is reguiated by Tnf-cc.
CONCLUSIONS: Rgmc mRNA regulation in response to hypoxia and LPS-induced inflammation may contribute to the contrai of iran homeostasis in these conditions. Hepcidin and Rgmc are regulated by different pathways in response to LPS after the common element of
T1r4.
SIGNIFICANCE: These findings provide important insights into the regulatory pathways impacting iron metabolism change, which may be relevant to disease settings affecting iron homeostasis.
Keywords
Inflammation, iran, LPS, T1r4, Tnf-Œ, Il-6, Rgmc, hepcidin, hemojuvelin, anemia of chronic disease, hereditary hemochromatosis, juvenile hemochromatosis
V
Index
RÉSUMÉ .111
INDEX V
LIST 0F FIGURES VII
LIST 0F TABLES VIII
ABBREVIATIONS IX
INTRODUCTION
CHEMIcAL PROPERTIES AND BIOLOGICAL FUNCTIONS 0F IRON 1
CELLuLR IRON BALANCE 5
Iron transport, uptake and storage 5
Iron regulatory proteïns and elements 9
THE SYSTEMIC IRON RECYCLING 13
IR0N ABSORPTION 16
HEPcIDIN 19
REGuixrIoN 0F IRON HOMEOSTASIS 20
Regulation of Iron homeostasis by iron stores 20
Regulation of iron homeostasis by erythropoietic demand 27
Regulation of iron homeostasis by Hypoxia 24
Regulation of iron homeostasis by the immune system 24
HEREDITARY HEMocHRoMATosts 28
Hereditary hemochromatosis- Type I 28
Mutations on HFE, a nonclassical majorhistocompatibilitycomplex
class I (MHC-I) molecule is the causative factor of type I HH 28
Hereditary hemochromatosis- Type II 32
OBJECTIVES AND SPECIFIC AIMS 35
OBJECTIvE: 35
Aim I — Characterization of Rgmc tissue and ce!! expression by
quantitative real-time polymerase chain reaction 35 Aim 2— Profiling of Rgmc liver expression in mouse models 0f
altered iron metabolism 36
Aim 3— Study Rgmc regulatory pathway in the LPS signaling 36
MATERIALS AND METHODS 38
ANIMALs 38
PRIMARY HEPATOCYTES ISOLATION AND CULTURES .39
LIvER MONONUCLEAR CELLS(LMCs) ISOLATION 41
RNA QUANTIFICATION 41
SERuM IRON AND TRANSFERRIN SATURATION MEASUREMENTS 42
MEA5uREMENT5 0F TISSUE IRON CONCENTRATION 43
STATI5TICAL ANALYSIS 43
RESULTS 44
AIM 1 - TISSUE ExPREssioN 44
Rgmc tissue and ce!,’ expression 44
AIM 2 — RGMc RESPONSE TO MODIFIERS 0F IRON HOMEOSTASIS 46
IronLevels 46
Hypoxia 51
Anemia 55
Inflammation 58
AIM 3— INFLAMMATORY PATHwAY 60
lime Course 60
Rgmc tepression by LPS is mUependent of Hfe 62
Rgmc regulation is 11r4-Uependent 63
In f-a downregulates Rgmc 65
II-61s flot required for Rgmc down-regulation in response to LPS. 68
DISCUSSION 71
RGMC REGULATION IN RESPOSE TO MODIFIERS 0F IRON HOMEOSTASIS ....73
Rgmc regulation in response to iron stores 73 Rgmc levels in Hereditary hemochromatosis 75 Rgmc regulation in response to anemia and hypoxia 75
Rgmc regulation in response to inflammation 77
Rgmc regulatory pathway in inflammation 78
FUTURE PERSPECTIVES 80
vii
Lïst of Figures
FIGURE 1 — IRON CATALYZED GENERATION 0F THE HYDROXYL RADICAL VIA THE
FENTON REACTION 3
FIGURE2 —TFTYFR-MEDIATED IRON UPTAKE 7
FIGURE3 — CONSENSUS IRE MOTIF 10
FIGURE 4 — RE5P0N5Es 10 IRON SUPPLY MEDIATED BY IRE-IRP
INTERACTIONS 12
FiGURE 5— SYsTEM1c 1RON RE-CYCLING 15 FIGURE6— INTESTINAL IRON ABSORPTION 18
FIGUREZ — PATHwAY5 FOR HEPCIDIN REGULATION 27
FIGURES— MECHANIsTIc MODELS FOR HFE FUNCTION 31 FIGURE 9 — HEM0JUvELIN AND THE MOUSE ORTHOLOG RGMc PROTIN
ALIGNMENT 34
FIGURE 10— MURINERGMcTISsuEANDcELLExPREssION 45 FIGURE 11 — HEPATIc RGMc MRNA EXPRESSION IN RESPONSE TO IRON
LEVELS AND IN HH MOUSE MODELS 50
FIGURE 12 — HEMAT0LOGIcAL INDICES AND IRON MEASUREMENTS IN MICE
SUBJECTED TO HYPOXIA 53
FIGURE 13 — HEPATIC RGMc MRNA EXPRESSION IN RESPONSE TO
HYPOXIA 54
FIGURE 14 — HEPATIc RGMc MRNA EXPRESSION IN RESPONSE TO
ANEMIA 57
FIGURE 15 — HEPATIc RGM0 MRNA EXPRESSION IN RESPONSE 10 SYSTEMIC
INFLAMMATION 59
FIGURE 16 — IRON PARAMETERS AND GENE EXPRESSION IN RESPONSE TO
SYSTEMIC INFLAMMATION OVER TIME 61
FIGURE 17 — HEPATIC RGMc MRNA EXPRESSION IN RESPONSE TO SYSTEMIC INFLAMMATION IN HEREDIIARY HEMOCHROMATOSIS MOUSE MODELS 62
FIGURE 18 — HEPATICRGMc REGULATION IS TLR4-DEPENDENT 64
FIGURE 19 — RGMcMRNA EXPRESSION IS DECREASED BY TNF-Œ, BUT NOT
IL-6 67
FIGURE 20 — /L-6 MICE DOWNREGULATE RGMc MRNA IN RESPONSE 10
ListofTables
TABLE I — HEMAT0L0GIcAL INDICES 0F MICE TREATED WITH A LOW, STANDARD
AND HIGH IRON C0NTANING DIETS 47
TABLE II — 1RON MEASUREMENTS IN MICE TREATED WJTH A LOW, STANDARD
AND HIGH IRON CONTAINING DIETS 48
TABLE III — IRON MEASUREMENTS N MICE WITH GENETIC IRON
OVERLOADING 49
TABLE IV — HEMAT0L0GIcAL INDICES IN PHL AND PHZ TREATED MICE 56
TABLE V— IRON MEASUREMENTS IN MICE PHL ANDPHZ TREATED MICE 56
TABLE VI — IRON MEASUREMENTS IN RESPONSE 10 SYSTEMIC
INFLAMMATION 58
TABLEVII — IRON MEASUREMENTS IN RESPONSE 10 SYSTEMIC INFLAMMATION
IN WILDTYPE AND TLR4-DEFICIENT MICE 65
TABLE VIII — IR0N MEASUREMENTS IN MICE TREATED WITH LPS OR A HIGH
ix
Abbrevïations
ACD —Anemia of chronic Uisease
ATP —Adenosine triphosphate
DCYTB — Duodenal cytochrome b
DM1 — Divalent metal transporter
[PC — Erythropoietin
FBS — Fetal bovine secum
FP1 — Ferroportïn 1
FTH — Ferritin heavy polypeptide
FTL — Ferritin light polypeptide
GPI — Glycosyl phosphatidylinositol
Hb — Hemoglobin
HCP — Heme carrier protein
HCT — Hematocrit
HH — Hereditary hemochromatosis
HIF — Hypoxia inducible factor
HJV — Hemojuvelin
HO — Heme oxygenase
IL— Interleukin
IRE — Iron responsive element
IRP — Iron regulatory protein
LPS — Lipopolysaccharide
MCV — Mean corpuscular volume
MHC — Major histocompatibility complex
mRNA— Messenger ribonucleic acid
NF-iB — Nuclear factor kappa B
NK— Natural killer
NIBI — Non-transferrin bound iron
OMIM — Online endelian inheritance in man PCR — Polymerase chain reaction
PHL — Phlebotomy
PHZ— Phenylhydrazine PS — Penicillin-Streptavidin
qRT-PCR — Quantitative real-time PCR RBC — Red blood celi
RGM— Repu lsive guidance molecule
RT-PCR — Reverse transcription-polymerase chai n reaction Tf— Transferrin
TfR —Transferrin receptor TLR — Toli-like receptor
TNF —Tumor necrosis factor
Note: Gene and protein symbols were written in accordance to international nomenclature conventions (1-3). Briefly, human gene and protein symbols are written in capitals and mouse equivalents are written with the first letter capital and remaining letters in underscore; genes are written in italic while proteins are normal case (e.g. RGMa refers to a human protein whereas Rgma refers to a mouse gene). Some exceptions exist (e.g. DMT1, which is aiways written in capitals).
INTRODUCTION
Chemïcal propedïes and biological fun ctïons of
Iran
Iron is involved in a wide array of metabolic functions in ail organisms
and is thus essentiai for normai oeil growth and proliferation. Ihis is
namely due to its capacity to form a variety cf coordination complexes with organic ligands in a dynamic and flexible mode which, along with its ability to switch between the ferrous (Fe2) and ferric (Fe3) states (of +772 mV at neutral pH (4)), allowed for the evolution of several, functionally diverse, iron proteins.
Many cf the iron proteins accommodate iron in the form cf heme and are generally designated as hemoproteins. The most abundant cf the
hemoproteins are the oxygen binding proteins hemogiobin and
myoglobin, present in great quantities in red biood ceils (RBC5) and muscle, respectively (5). Other hemoproteins include cytochromes and
enzymes, such as oxygenases, peroxidases, or nitric oxide synthases
Most non-heme iron proteins contain iron-sulfur clusters (6) and play
diverse roles ranging from electron transfer, transcriptional regulation
and structural stabilization to catalysis (4).
The iron feature of which the above proteins make use, i.e. the capacity
of iron to easily participate in oxidation-reduction reactions in conditions compatible with the constrains of the cellular environment, also account for the spontaneous reaction by which iron catalyses the formation of hydroxyl radicals (0H) from hydrogen peroxide (F1202), a process known as Fenton chemistry (7) (figure J). 0H readily reacts with DNA,
proteins and lipids inducing mutations and cellular stress (8).
The reactive essential for the Fenton reaction, H202, originates as a byproduct of enzymatic reactions or from the detoxification cf products
such as superoxide (02) by supetoxide dismutases and is usually
detoxified by catalase or glutathione peroxidase to H20 (9). H202 reacts with Fe2, which is weakly chelated by a variety cf ligands such as citrate, phosphate, carbohydrates, carboxylates, nucleotides,
nucleosides, polypeptides and phospholipids (10, 11). The impact of iron
toxicity through Fenton chemistry is evidenced by the reduction of cellular damage by the use cf iron chelators which prevents iron from reacting with H202 (8).
3
Detoxïflcatïon
Fenton-derived toxicïty
o.
2 Superoxide Dismutase Fe2 Lipid, EnzymaticH2o2
—• 0H , DNA and Actïvity Protein Catalasel Oxidation Glutathione peroxîdase H20 Fe2 + H202 Ite3’ + 0H + 0H(Equation for the Fenton reaction)
Figure I — Iron catalyzed generation of the hydroxyl radical via the Fenton reaction. H202 arising from the detoxification of superoxide by superoxide dismutase or from other enzymatic activities may be detoxified by catalase or glutathione peroxidase to H20 or participate in the genetation of hydroxyl radicals, a reaction catalyzed by iron as may be seen in the equation for the Fenton reaction.
The duality cf iron as an essentia) micronutrient and as a cellular toxic imposed the evolutïon cf highiy regulated systems for the celluiar iron
uptake and storage in a non-toxic form, which wiII be discussed in the
5
Cellular ïron balance
Iron transport, uptake and storage
The main source of iron for mammalian celis is from transferrin (Tf), a 79 kD protein divided into two evolutionary related lobes, the N-lobe (336 amino acids) and C-lobe (343 amino acids), which are linked by a short
spacer sequence (12). Each lobe contains two domains comprising a series cf Œ-helices, which overlay a central 13-sheet backbone (12). The domains interact to form a deep, hydrophilic iron-binding site which has
a ‘closed’ form with one Fe3 atom stabilized at neutral pH and an ‘open’ form when the pH is reduced to around 5.5 (5, 12).
Tf is synthesized mainly by hepatocytes (13) and is found in various body fluids including plasma, bile, amniotic, cerebrospinal, lymph and
breast milk (14). It has an half-hfe cf eight days and plasma concentration is relatively stable from birth, ranging from 2 to 3 gIL in humans (12).
From the 2-3gIL of Tf, that which has bound-iron (holo)-Tf has a higher affinity to the Tf receptors (TfRs) than non-iron-biding (apo)-Tf (12).
There are two TfRs. TfRI is expressed in RBCs, erythroid ceils,
hepatocytes, monocytes and the blood-brain barrier (12). TfR2 is expressed as
two
transcripts (Œ-TfR2 and 3-TfR2), with Œ-TfR2expressed predominantly on liver ceils and 3-TfR2 expressed at 10w
levels on a variety cf ceil types (15).
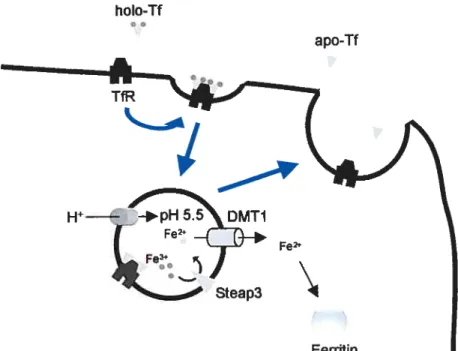
Figure 2 schematizes the process of Tf-bound iron uptake. Upon ïnteracti on cf Tf wïth TfR the Tf-TfR complex s internalized and
adenosine triphosphate- (ATP) dependent proton pumps acidify the endosomes te pH 5.5, inducing 1f to release the bound iron (5). The
recently identified ferrireductase Steap3 then reduces Fe3 te Fe2 (16), which is transported into the cytoplasm by the divalent metal transporter
1 (DM11) (17). The apo-Tf-TfR complex remains stable until the
endosome is recycled and transported back to the membrane, where
apo-Tf liberates from the TfR returning to the extraceliular environment (18-20).
it should be noted that not ail iron enters the celis through the Tf/TfR
system. A non-Tf bound iron (NTBI) uptake system also exists. NTBI is normally found in 10w levels in heaithy individuals. However, in
pathological conditions such as primary or secondary iran overload, NTBI levels are augmented.
To maintain cellular iron reserves in a non-toxic form, NIBI and TfR
7
hoto-Tf
apo-Tf
Figure 2 — TIITfR-mediated iron uptake. Holo-Transfemn (Tf) interacts
with Tf receptor, inducing its endocytosis. A proton pump acidifies the endocytic vesicle ta pH under 5.5, which induces the release of Fe3 from Tf. Fe3 is reduced by the ferrireductase Steap3 to Fe2 and is transported ta the cytoplasm by the divalent metal transporter I (DM11). Iran may then be incorporated into ferritin for storage. The 1f receptor is then recycled back to the membrane and apo-Tf s released ta the extracellular space.
TfR
Fe2e
Steap3
Ferritin is a sphecical sheli composed of 24 units 0f the ferritin light (FTL) or heavy (FTH) polypeptides capable of storing around 4500 atoms of iron in a ferrihydrite core (21). The polypeptides are very similar in structure. However, they have been shown to have different physiological properties. FTH is capable of iron binding, and has been
associated with ferroxidase activity, whereas the iron binding site in FIL has been replaced by a sait bridge (22). FIL is more stable than FTH and has been shown to promote the ferrihydrite nucleation (23). It is not clear yet how ferritin regulates iron incorporation and release or how each polypeptide participates in this regulation. Generally, ferritins with
high FIL percentage are associated with stable ferrihydrite containment
and are thus found in tissues associated with iron storage, such as the
liver. FIH-rich ferritins are believed to be implicated in iron detoxification through ferrous iron oxidation (24) and are found in energy demanding
tissues, such as the heart and brain.
Ceuar iron balance is therefore maintained by equilibrium between iron
uptake and storage. Although several factors may be implicated in this balance, cellular iron levels are central to the balance modulating the
9
Iron regulatory proteïns and elements
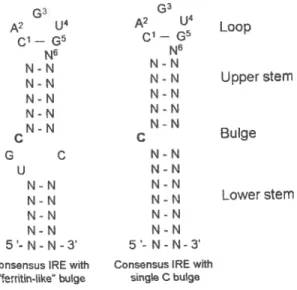
Iron regulatory proteins (IRPs) are messenger ribonuceic acid (mRNA) binding proteins with high affinity for hairpin secondary structures known
as “iron responsive elements’ (IREs) (25). IREs are present on the untranslated regions cf several genes coding for proteins implicated in
iran metabolism, including the 1fR and ferritin polypeptides (25). The nucleotidic sequence of the IREs is phylogenetically conserved in
vertebrates and some insects and bacteria. A typical IRE is composed
cf around 30 nucleotides and form a 5’-CAGUGN-3’ Ioop (the underlined
C and G interact by hydrogen bonding) and a stem with moderate
stability, interrupted by an unpaired C residue (25) (figure 3).
Two different IRPs bind IREs, IRP1 and IRP2 (25). Although structurally similar, the two IRPs are very differently regulated. IRP1 contains an iron-sulfur 4Fe-4S cluster that in 10w LI P levels loses one iron. This
Ieads to a change in the conformation cf the protein into the apo-IRPI
IRE-binding form, which has a 3Fe-4S cluster (26). IRP2, on the other hand, is regulated by iron-induced degradation and the amount cf bound IRP2 ta IREs directly correlates with the amount cf protein (27). In summary, IREs wiII predominantly have IRPs bound (bath IRP1 and IRP2) when cellular iron levels are Iow.
The IREIIRP system therefore allows for an intracellular iron-sensing mechanism, relaying its signaling by the control of translation and mRNA degradation. The presence cf IREs on the 5’UTR inhibits translation when lRPs are bound and IREs on the 3UTR augment mRNA levels by blocking degradation by RNases.
G3 G3
A2U4 A2U4 Loop
N6 N6 N-N N-N N-N N-N Upperstem N-N N-N N-N N-N NN N-N c - c Bulge G C N-N U N-N N-N N-N N-N N-N Lowerstem N-N N-N N-N N-N 5-N-N-3 5-N-N-3’
Consensus IRE with Consensus IRE with ‘entin-like” bulge single C bulge
Figure 3 — Consensus IRE motif. Two forms cf iron responsive
elements (IREs) are shown. On the left is represented an IRE similar to
the ferritin IRE, with a UGC on the 5’ end 0f the hairpin, with a single C on the 3’ end cf the bulge. On the right we see an IRE with a bulge with a single C at 5’ end cf the hairpin, as found on 1fR IREs.
11
A classical example of gene control by IRPs pertaïns to the iron storage
and uptake equilibrium. FTL and FTH have a 5’ IRE and TfR1 has five 3’
IREs (25). When LIP levels are 10w TfR1 mRNA wilI be protected from
degradation and translation of the ferritin polypeptides will be inhibited.
Conversely, high LIP levels wiIl release IRPs from the IREs, TfR1 mRNA
will be degraded and ferritin translation will be initiated.
As a result, high cellular iron levels elevate ferritin levels, providing a
safe storage place for iron and diminish 1fR levels, reducing ton uptake.
The inverse will be found in conditions of low LIP levels (see figure 4). The IRE/IRP system allows for the control cf intracellular iron levels. However, in mammals, cellular iron levels depend not only on the regulation cf iron uptake at the ceil membrane, but aIse on the availability cf iron in the body. Mechanisms for systemic iron regulation
RNAse RNAse +
TfRI 5Lr -jSL’iLiLî_IAAAA3’ AAAA 3’ tTfRI
Translation Translation initiation complex initiation complex
tferritin 5’___L_tzEEEEEJ_AAAA3’ 5’_—_I?-__[EEEEEE}—AAAA 3’ ferritin
Fïgure 4 — Responses to ïron supply mediated by IRE-IRP interactions. Iran regulatory proteins (IRPs) bind to iron responsive elements (IREs) in 10w iran conditions and leave IREs free in the presence of iran. IRPs bound ta IREs on the 3’ UTR (as taund in the Tf receptor 1 (TfR1) mRNA transcript), wiII block mRNA degradation by RNases. IRPs bound ta 5’ IREs (as found in ferritin) inhibit protein synthesis by perturbing the binding cf the translation initiation complex.
13
The systemic ïron recydllng
In mammals the major amount of iron is heme-bound, cf which iron
found in hemoglobin is the most common. It is therefore flot surprising
that most cf the iron in humans
is
found in erythrocytes (5). From the 3-5g of iron present in the human body. approximately 1.8 g is found in
hemoglobin in the erythrocytes, i.e. roughly 40% of the total body iron. Erythrocytes typically have a life span of 120 days (28). To compensate for senescent erythrocytes. over 200 billion new erythrocytes are
produced daily (29), making erythropoiesis the major iron-demanding process in the body.
To provide for erythropoiesis demand,
phagocyte senescent RBCs and heme
iron from heme. The free iron may
macrophages onto the bloodstream
Subsequentty the bone marrow uptakes
daily requirements (figure 5).
iron is recycled. Macrophage
oxygenase (HO) releases the then be exported from the to be bound to If (29). the Tf-bound iron to fulfill its
Proportionally, only a very slight amount of iron is taken up by the rema ining cells for physiological use, of which muscle ceNs are the major iron containing ceNs, in the form of myoglobin (17). The sole exception is that 0f the liver. Hepatocytes have very high amounts cf
storage compartment, supptying iran in times cf dietary iron deflciency (17).
Since most cf the body iran is recycled, the requirement of dietary iran is suaIty due ta iran tasses. These include iran lost through desquamation cf gastrointestinal ceils, bleeding and other mmcc tosses (17).
In summary, celis may be regarded as acceptors or donors. Virtually alt
the celis in the body are iron acceptors, with erythropoietic precursor cells and hepatocytes as the main iron-demanding celis. The celi types
that are considered ta be iron danors are 1) macrophages, after scavenging cf iran from hemoglobin; 2) hepatocytes, in conditions of
iran sparseness; and 3) enterocytes, respansible far absarbing Iran in the duadenum (see figure 5 for a schematic representation).
The recycling 0f iron implies that dietary iran requirements are anly
needed ta compensate for iran lasses and ta support body growth.
Given the nanexistence cf a cantralled iran excretion system, bady iran levels must be regulated at the level af iran absorption.
15
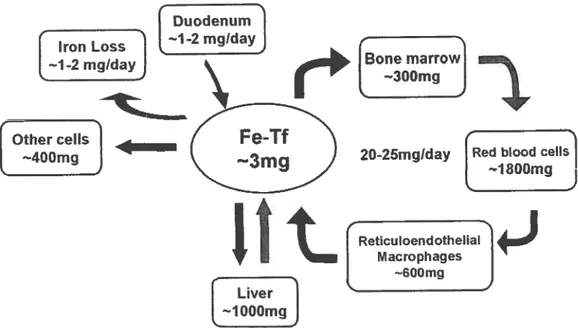
Figure 5 — Systemic ïron re-cycling. Iran lasses have ta be
compensated by iron absorption at the duodenum. Absorbed iran s released into the bloodstream where it is bound to Transferrin (Tf).
Erythroid precursors uptake the Tf-iran ta produce RBCs. Senescent RBCs are phagosized by the reticuloendothelial macrophages and the Iran is recycled back into the bloodstream. Hepatocytes store excess iran and supply it when body iran levels are reduced.
___________
t
Duodenum1
[ Iron Loss
1
Li-2 mg!JLjz2
mgIda’JI,..
tOther ceNs
1
Fe-Tf
L
-400mg_J —3mglit
f
Liver7
Li000mg]
[Bonemarroj I
20-25mglday tRed blood ceiisï
Iron absorption
As discussed, normally only s small amount of iron is absorbed daily from the diet. A tight regulation af this absorption is required since
excessive iron absorption can ultimately lead to iron overload.
Iron is absorbed mainly at the level of the duodenum, where it arrives in two forms from the diet: heme and non-heme iron. Non-heme iron is
present as iron hydroxides and saits and in iron-containing proteins such as ferritin. 0f the twa forms, heme Iran is the more bioavailable, with
levels 0f absorption from a meal containing heme of about 25%.
Heme-bound iron is uptaken by the recently identified heme carrier
protein 1 (HCP1) expressed in the apical region of epithelial cells in the
duodenum (30), and is not affected by other dietary components, with the possible exception of calcium (31).
Non-heme iron is much less bioavailable, with absorption rates from the diet 0f 1-15% (32). The absorption efficiency varies with other
components of the diet than may enhance or inhibit it. Examples of
promoters of iron absorption are ascorbic acid and citric acid (33). Among inhibitors are components such as phytic aclU, polyphenols (e.g.
17
Promoters of iran absorption mainly have the effect of converting fercic
iran ta fertous iran. In addition, Fe3 can be reduced by the
ferrireductase duodenal cytochrame b (Dcytb), present at the brush border membrane of duodenal enterocytes, enriching the amount of
Tuminal Fe2 (34). Fe2 is then uptaken by enterocytes by DMT1 directly
from the lumen, which efficiently transports Fe2, but flot Fe3(35). Inhibitors of iran absorption typically work by chelating iran or compete with iran for DM11 transport (e.g. calcium) (32, 35).
In the enterocyte iran may either be stored in ferritin or is exported by
ferroportin 1 (Fpl) ta the bloodstream ta complete the process af iran absorption. Fpl is most likely the only iran exporter in mammals, since
Epi knockout mice are embryonic lethal (36). After transport of the Fe2
across the enterocytic membrane by Fpl, the ferroxidase hephaestin
oxidizes iran to Fe3, which can then bind ta Tf (37).
The scheme in figure 6 illustrates the mechanisms involved in iran absorption.
The observation that in mice, Epi disruptian in the duadenum abrogates
iron export from the enterocytes suggests that iron absorption is mainly controlled by Fpl regulation (36). Recently it has been shown that Fpl
can be regulated bath at transcriptional and post-translational levels by
Fe3 %%\ Dcytb
Ferrîti n
(Fe3j If+
Fe3 Fe2Figure 6 — Intestinal iron absorption. Iron in the diet may be oxidized (Fe3), teduced (Fe2) or bound to heme. Fe3 must be reduced by the duodenal cytochrome b (Dcytb) to be transported across the plasma membrane by the divalent metal transporter I (DMTI) into the enterocyte. Heme is uptaken by a specific carrier, the heme carrier proteïn 1 (HCPJ) and its iron is scavenged by heme oxygenase (HO). Iron is then incorporated into ferritin for storage (the stored iron is eventually Iost by desquamation of the epithelial celis) or exported out of the enterocyte by ferroportin I (Fpl), oxidized by hephaestin (Hp) and bound to Tf for transport in the blood.
/
Fe2 Fe2Lumen
HpPlasma
19
Hepcïdïn
Hepcidin was recentiy discovered independentiy by three groups as a mouse peptide expressed in response to iran leveis and iipopolysaccharide (LPS) (39) and as a hurnan antimicrobial peptide of the 3-defensin famiiy found in urine (40) and biood — where it was designated LEAP-1 (liver expressed antirnictobiai peptide) (34). In ail reports the authors show that the peptide is highiy expressed in the liver. Mice deficient for hepcidin are iran overloaded (41) while converseiy, transgenic mice overexpressing hepcidin are severeiy anemic (42) further stressing the important raie of hepcidin in iron rnetaboiism.
A ciue onto the mechanism of action for hepcidin cornes from the observation that hepcidin interacts with the iron exporter Fpl inducing its internaiization and degradation (38), and reducing Fpl rnRNA expression (43). Lower protein Fpl levels would ultimately iead to reduced arnounts of iran being exported from the enterocytes into the circulation, therefore reducing iran absorption.
Coiiectiveiy, these observations strongly support the notion that hepcidin is a ngative regulator of iran absorption. In fact, hepcidin mRNA ieveis can be reguiated by iron, anernia, inflammation and hypoxia (44), four pathways reguiating iron homeostasis.
Regulation ofiron homeostasïs
Iron absorption is adjusted depending on the amount of stored iron, the erythropoietic demand, oxygen levels and inflammation (43). It was initiaiiy hypothesized that severai different regulators were implicated in the regulation of iron absorption in those conditions. The identification 0f hepcidin as a negative regulator of iron absorption, and the observation that its expression is reguiated in ail the above conditions (44) suggests that hepcidin is the common regulator in ail conditions. Figure 7
schematizes the hypothesized pathways regulating hepcidin in response
to iron leveis, erythropoietic demand, oxygen leveis, and immune
system activation.
Regulation of iron homeostasis by Iran stores
It s Iogical that the iron stores, or iran levels, should be one of the factors regulating iron absorption, and therefore hepcidin, in order to
avoid iron overioad or deficiency.
The iiver serves as an iron storage organ by uptaking excess iron and later distributing it when body iron ieveis are iow. Due to this function of iron storing and since the liver is the main site of hepcidin production, body iron stores sensing is believed ta take place in this organ.
21
Serum ferritin, If and soluble 1fR have ail been proposed as candidate signal ing molecules for the regulation of hepcidin in response to iran levels (45-47), howevet which moiecuie, if flot ail mentioned, and the
pathways leading to hepcidin regulation have stili ta be elucidated.
Regutatïon
of iron
homeostasîs
by erythropoietic
demand
Erythropoietin (EPO), which regulates RBC production is a glycoprotein mainly produced in the kidneys, but also synthesized in the liver and to a
lesser extent in the spleen, lung, testis and brain (48). EPO inhibits the apoptosis of erythrocytic progenitors in the bone marrow (49), allowing
for an increased number of matured hematopoietic ceils in the presence of high levels of EPO.
Tissue hypoxia is the main stimulus of EPO production and its levels
exponentially increase with decreasing blood hemoglobin (Hb)
concentration (50). EPO gene expression is not only stimulated when the 02 capacity of the biood decreases (usually correlating with the Hb
concentration), but aiso when the arterial p02 decreases (as found in high altitudes) (51).
There are severai reguiatory DNA sequences in the neighborhood of the EPO gene, but the key element is located within the so-called hypoxia
response element, which is bound by the hypoxia-inducible transcription factors (HIES). HIEs are dimers composed of one cx and one 13 subunit, There are at least three subtypes of the HIF-cx subunit (1, 2cx and 3u).
HIF-lcx/f3 is generally considered the primary mediator of hypoxia induced gene expression (48). HIF-lcx is regulated by oxygen
dependent degradation. Only in hypoxia is HIF-lcx enabled ta enter the nucleus and ta heterodimerize with HIE-113, inducing HIF-1-regulated genes, such as EPO.
In summary, erythropoietic demand, regulated by EPO, arises in two
main situations: decreased Hb levels as found in anemia, or decreased P02 levels, as found in hypoxia due ta environmental 10w oxygen levels,
such as found in high altitudes. The first is described below and the second is described in following section.
Anemia
Anemia is defined as a deficiency in hemoglobin and/or RBC levels linked ta poor tissue oxygenation. Patients commonly report a feeling 0f
weakness and fatigue and in cases of severe anemia, shortness 0f
breath. Etiologically anemia is caused by 1) decreased RBC production; 2) increased RBC destruction and/or 3) blood Ioss.
Decreased RBC production may arise, for instance, due ta Iow body iron
23
erythroid progenitors have insufficient hemoglobin synthesïs due to the
ow iran availability. RBCs produced in conditions of iron deficiency
typically have a smaller volume, as measured by the mean corpuscular volume (MCV), and is therefore morphologically classified as a
microcytic anemia (52).
Another fotm of anemia that is associated with impaired iron distribution ta erythroid precursors is the anemia of chronic disease (ACD). However, in contrast to iran deficiency anemia, patients with ACD do not
have decreased body iron levels. In addition, in contrast to iron
deficiency anemia, the pathogenesis of ACD is not only associated with impaired iton distribution to erythroid precursors, but also with increased RBC destruction and impaïred EPO production.
ACD may arise in individuals with chronic infections and cancer. The underiying pathogenesis induce secretion of high levels of pro inflammatory cytokines (53), which contribute to the development of the
anemia by inhibiting EPO production (54), increasing the rate of RBC phagocytosis by macrophages (55) and inhibiting the release of iron
from hepatocytes and macrophages through the upregulation cf hepcidin (56). The hepcidin-mediated decrease in iron release to the
serum is believed to be the main causative factor of the underlying
chronic hypoferremia in ACD, which leads to deficient iron delivery to
Regulation of iron homeostasïs by Hypoxïa
Subjecting mice to hypoxîa by housing in a hypobaric chamber resuits in
hepcidin downregulation. as found in anemia and consistent with the iron demand for erythropoiesis (44), and hepatocytes cultured in vitro
subjected to hypoxia decrease hepcidin expression (44).
However, other stimuli seem to be implicated in the increased iran absorption in response to hypoxia. An increase in erythropoietic demand induced by EPO is known to decrease hepcidin levels (57), but seems to produce littie or no increase in iron absorption (56, 59). The increase in iron absorption observed in hypoxia, afthough it is likely regulated by hepcidin to a certain level, seems to require other factors, such as H-6, since administration of Il-6 antibody to hypoxic mice halves the hypoxic
response of iron absorption (60). These additional factors support for an
hypoxia pathway separate from the erythropoietic pathway (61).
Reg ulation of iron homeostasis by the immune system
Iran is important in several aspects of immunosurveillance because of its growth-promoting role for immune celis and its interference with celi mediated immune effector pathways and cytokine activities (62-64).
25
Iron homeostasis and the adaptïve immune system
It has been demonstrated that iron deficiency as weB as won overload
can exert subtie effects on immune status by altering the proliferation and activation of T-, B- or natural killer (NK)-cells (53). Conversely, indirect evidence (Hfe, a nonclassical major histocompatibility complex
class I that has been implicated in iron sensing is directly recognized by
cytolytic CD8÷ T cells (65); higher iron levels are found in Hfe-/
recombinase-activating gene (Rag)1 -J- double knockouts than in either
cf the single knockouts (66); and 10w CD8+ peripheral T celI numbers
increases the tisk of severe hemochromatosis (67)) suggests that the
immune system could participate in iron homeostasis. Iron homeostasis and the innate immune system
Pathogens require iron for growth and replication. Since the amount cf
iran that is not protein-bound in serum and tissues is diminute (68),
bacteria have evolved several mechanisms for seizure and uptake 0f
protein-bound iron, ranging from production of iron sequestering molecules (siderophores), to importers of Tf and lactoferrin (69).
Conversely, the host has devefoped mechanisms to hinder iron availability for bacteria. One of these mechanisms is the reduction cf
Hepcidin expression is increased in response to inflammation by Il-6 and
Il-113 (71, 72) and, since it is has been shown that hepcidin inhibits Fpl
(38), the sole iron exporter in mammals, and it is capable of inducing hypoferremia, it has been hypothesized that the development of
27
Iron Stores Erythropoietïc
Hypoxic
Inflammatory
I
Iron Absorption
Figure 7 — Pathways for hepcidin regulation. Signaling of ïron stores
level Ieads f0 the regulation of hepcidin levels. The erythropoietic and hypoxic pathways are intertwined since Iow red blood ceils (RBCs) or
10w hemoglobin levels (Hb) in anemia induce tissue hypoxia, activating
HIEs and augmenting EPO production. II-6 and II-1f3 are produced in
response to inflammation and these regulate hepcidin. Dashed unes —
hypothetical pathways.
\
/V
Hereditary Hemochromatosîs
Hereditary hemochromatosis (HH) is an iron overloading disease
caused by mutations in Hfe (type I), hepcidin or hemojuvelin (type II),
transferrin receptor 2 (type III) and ferroportin I (type IV). In this study we will give emphasis to type I and II HH.
Heredftary hemochromatosis
-Type I
Type I hemochromatosis is an autosomal recessive disorder 0f iron metabolism (onhine mendelian inheritance in man (OMIM) 235200).
Patients absorb excessive amounts cf dietary iron, which leads to ton
overload. This excess iton accumulates mainly in the hiver, pancreas
and heart.
If left untreated, patients may develop iron-induced complications such as cirrhosis, diabetes or cardiomyopathy typicalhy occurring around the 5th
decade of hife.
Treatment usuahly consists of bleeding (phlebotomy) and patients rarely
devehop significant chinical symptomatology, having a hife expectancy similar to heahthy individuals (74).
Mutations on HFE, a nonclassical major histocompatibihity complex class
29
The HFE ancestral peptide bindïng groove is toc narrow to aflow classic
antigen presentation (75) and the function of HFE has net yet been established. However, the observation that HH type I patients and mice
deficient in Hfe have 10w basaI hepcidin levels (76) indicates that Hfe plays a role in the setting of adequate basal hepcidin expression levels, The low basal hepcidin levels are consistent with the excessive iron
absorption found in the patients, which leads to tissue iron overload. Two main mechanisms cf action cf HFE that may impact on hepcidin
expression levels have been proposed: the inhibition by HFE 0f the TfffR iron import system, and the free HFE signaling to extra- or intra
cellular partners.
tnhibïtïon ofTfITfR import
HFE interacts with 1fR (75) and competes with differric 1f for TfR binding (figure SA), suggesting that some of the effects of HFE on iron
homeostasis resuit from the inhibition cf Tf-mediated iron import by HFE
(77, 78) (79) (figure 8B).
Free HFE sïgnaling
Accumulating evidence suggests that the effect of HFE on iron
homeostasis may net be solely due to an inhibition of the If-mediated
iran import. Evidence supporting this hypothesis includes the facts that
concentrations cf Tf wel) be)ow those found in the blood (80), and therefore HFE woutd have very Iimited capacity to block Tf-mediated
iron uptake; 2) the W81A HFE mutant, which has 5000-fold Iower affinity for TfR1 binding than wildtype HFE (81), regulates Tf-mediated iron
uptake to the same extent as wildtype HFE in vitro (82) and; 3) HFE
iowers intracellular iron levels even in celis that Iack TfR1, providing
evidence for another mechanism of intraceflular iron level regulation,
probabty through control cf NTBI iron uptake (80) (figure 8C).
In addition, the recent observation that T ceils directly tecognize HFE
(83) indicates that HFE may have a role as a signaling molecule for the
adaptive immune system, which has the capacity to regulate iron homeostasis through the release of cytokines (figure 8C)
31
A
B
iC
holo-TfI
I
T ceil signalingf
TfR/HFEI
1
I
complexI
j
— _________ r TfR HFE 132m Inhibition ofTf-mediated iron Regulation of NTBI
uptake iron uptake/regulation
ofiron export
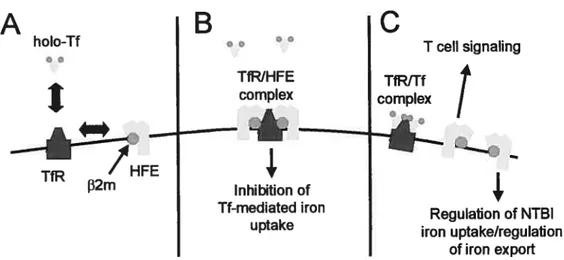
Figure 8 — Mechanistic models for HFE function. (A) HFE competes
with Tf for transferrin receptor (TfR) binding. It is believed that this competition resuits in (B) an inhibition cf Tf-mediated iron uptake by HFE or (C), the release cf HFE from 1fR, allowing I celi recognition of HFE or intracellular signaling leading to the regulation of NTBI iron uptake or iron export.
Hereditary hemochromatosïs
-Type II
Type Il HH is characterized by an earlier onset than type I HH and was
therefore also designated Juvenile Hemochromatosis (JH). It is
associated with a high lethality rate caused mainly by cardiomyopathy
by the 3rd decade of Hfe (84). JH has been found ta have twa causative
factors: loss of function mutations in hepcidin fOMIM 606464) (85) and hemojuvelin (HJV) (OMIM 608374) (86).
lnterestingly, JH patients with mutations in HJV have very 10w hepcidin levels (87). The low hepcidin levels in classical HH and JH provide for a common mechanism cf pathology and implicate HFE and HJV in hepcidin regulatian, however, the pathway leading ta this regulation stiil
has ta be discerned.
HJV is a soluble or glycosyl phasphatidylinositol (GPI)-anchored protein cf unknown function that has an Arg-Gly-Asp (RGD) domain and a partial von Willebrand factor type D damain and shows high similarity with human repulsive guidance molecules (RGM) a and b, two proteins invclved in axanal guidance (88). Due to this high similarity, the mouse ortholog of HJV is tecmed Rgmc
f
see figure 9 for an alignment cf HJV and Rgmc proteins). However. Rgmc. in contrast to Rgma and Rgmb, snot expressed in the nervaus system and does nat seem to be implicated in axonal guidance (89).
33
HJV has been shown to be expressed in the heart, skeletal muscle, liver, and fetal liver and absent from brain, colon, thymus, spleen, kidney, duodenum, placenta, lung, lymph. lymphocytes and bone marrow (86).
It is flot clear how HJV functions. As mentioned before, loss cf function
mutations leads to very 10w hepcidin levels, which seems to be the
causative factor for the iron loading, but it is not known how HJV is
implicated in hepcidin regulation.
This thesis centers on the control of Rgmc expression in mouse models cf altered iron homeostasis to elucidate in which conditions Rgmc may
** “ ** mRgmc MG- --QSPSPRSPHGSPPTLSTLTLLLLLCGQAHSQCKILRCNASflS5TLSLRGGGSPD1RGGCGG----LA 69 Mdv MGEPGQSPSPRSSRGSPPTLSTLTLLLLLCGMAIiSQCKILRCNAEYVSSTLSLRGGGSSGIRGGIGGRGGGVG 75 mRgmc SGGLCRALRSYALCTRRTARTCRGPLAPMSAVHGIEDLMIQHNCSRQGPTAPPPARGPALPGAGP PDPCDY 143 MJV SGGLCRALRSYALRRTARTCRGDLAPHSAVHGIEDLM1QflNC5RQGPTAF?PPRGPALPGAGS PDPCDY 150 mRginc EARFSRLHGRAPGPLHCASPGDPRVRSPHNQFMTCRVQGAWPLLDNDFLPVQATSSPVSEGANAT RKTTIIFK
219 HJV EGRFSRLMGRPPGFLMCA5FGDPHVR5PHMHFHTCRVQGAWPLLDNDFLFVQATSSPMAGANAT RKLTIIFK 225 ***t**t***************** * **** ********************* * mRgmc NNQECIOQKVYQAEVDNLPWEDGSINGGDRPGGS5LSIQTAGSMVEIRAAYIGTTTIIRQTAGQLSFSIRV 293 Mdv NNQECIDQKVYQAMVDNLPVAFEDGSINGGDRPGGSSLSIQTAtGNHVBIQAAYIGflhIIRQTAGQLSESIKV 300 ***** •**************t****************.*******************,*ttt** :**.**t**
mRginc AEDV FSAEQDLQLCVGGCPPSQRLSRSEPNRRGAIAIDTARRLCKEGLPVEOAYFQSCVPO SGDPNFW 369
MJV AFIN FSAEQDLQLCVGGCPPSQRLSRSERNRRGAITIDTARRLCKEGLPVEDAYFHSCVFD ISGDPNFTV 375 mRgtc
;****.***;;*fl*;***
.LVPLLSALFVLWLCFS 420 Mdv AAQAALBDAR2FLPDLRKLMLFPSDAGUPLSS LAPLLSGLFVLWLCIQ- 426
Figure 9 — Hemojuvelin and the mouse ortholog Rgmc protein alignment. ClustaIX was used for the alignment. Low scoring
Objectives and specïfic aims
Objective:
We intend to elucidate in which conditions HJV/Rgmc may influence iron metabolism by investigating its pattetn of expression in response to the modifiers cf iron homeostasis: iron levels, anemia, hypoxia and inflammation.
Aïm I
—Characterization of Rgmc tissue and ceil
mRNA
expression
by
quantitative
real-time
polymerase chain reaction.
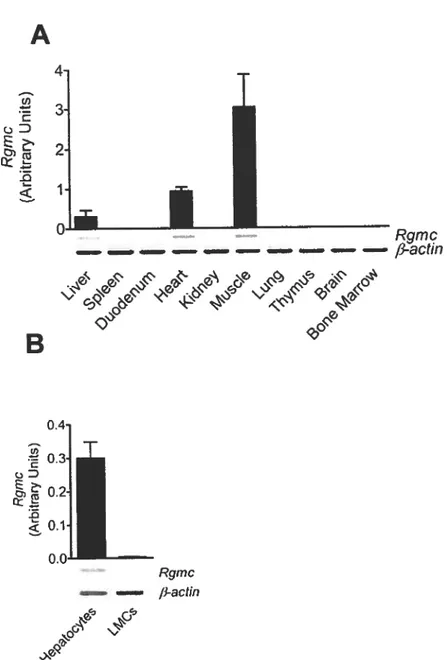
In humans, the Rgmc ortholog, H]V, has been shown to be expressed in the heart, skeletal muscle, liver, and fetal liver and absent from brain, colon, thymus, spleen, kidney, duodenum, placenta, lung, lymph, lymphocytes and bone marrow (86). To elucidate whether Rgmc has a similar pattern of expression in mice, we assessed Rgmc mRNA expression by quantitative real-time polymerase chain reaction (qRT PCR) in heart, skeletal muscle, liver, brain, thymus, spleen, kidney, dLloder.u m, lung and bone marrow. We also investigated whether Rgmc is expressed n hepatocytes or liver mononuclear cells.
Aim 2
—Profiling cf Rgmc liver mRNA expression in
mouse models of altered iron metabolism.
We decided to study Rgmc mRNA expression at the level of the liver, given the importance of this organ on iran homeostasis and as the main site of synthesis of hepcidin. Expression levels were measured by qRT PCR using mause models for the four modifiers of iran homeostasis: Iran levels, anemia, hypoxia and inflammation. To study Rgmc mRNA expression in response to iron levels, we used mouse models of nutritional iron loading and deficiency. Additionally we used the genetic iron overloaded mouse models of HH: Hfe and fi2m knockout mice. For the analysis of the effect of erythropoiesis on iron homeostasis, we used the models cf phenylhydrazine
f
PHZ)-induced hemolytic anemia and phlebotomy-derived anemia. Ta study the effect of increased erythropoiesis without anemia, as found in hypoxia, we subjected mice to 10% oxygen levels for 1, 3 and 5 days. Finally, we used LPS to modify iran homeastasis in response ta inflammation.Aim 3
—Study Rgmc regulatory pathway downstream
ofLPS.
We faund that Rgmc is markedly downtegulated in inflammation. We therefore perfarmed a time-caurse analysis af Rgmc regulatian and
37
studied the regulatory pathway in response to LPS treatment. We studied the capacity cf Toli-like receptor (TIr)4 deficient mice and Hfe
and fi2m knockout mice to regulate Rgmc mRNA expression in
response LPS. In addition, we investigated the regulatïon cf Rgmc in response to the infiammatory cytokines II-6 and tumor necrosis factor
Animais
Ail animal manipulations were carried out under Canadian Council on
Animal Care regulations and approved by the Animal Care Committee of the Centre Hospitalier de l’Universite de Montreal (CHUM). Hfe mice have been previously described (90). fl2m’, II-6’, C3H/HeJ and C3H/OuJ were purchased from Jackson Laboratories
f
Ben Harbor, Maine, USA). Except for the C3H mouse strains, ail animais were backcrossed over 10 generations with C57BI/6. Animais were tended forin light- and temperature-controlled environment and were given free
access to tap water and food — the commercial diet TD 2018 (Harian
Teklad, Madison, Wisconsin, USA) except otherwise stated.
Animal Treatments
For the inflammatory stimulus, 10 weeks-old mice were injected intra peritoneally with 5 mg/Kg E. cou LPS serotype 055:65 (Sigma-Aldrich, St. Louis, Missouri, USA) or 1 pg recombinant mouse Il-6 (3 hours before sacrifice) or Tnf-Π(6 hours before sacrifice) (Cederlane Laboratories Ltd, Hornby, Ontario).
39
b analyze iron homeostasis in response to iron Ieves, B weeks-old mice were subjected to an iron-deficiency diet (TD 80396; Harlan Teklad) or the standard commercia’ diet supplemented with 2.5% (wtlwt) carbonyl iron (Sigma-Aldrich) for two weeks.
To induce anemia through ph)ebotomy (PHL), 0.25 ml of btood was extracted by retro-orbital puncture from anesthetized mice. The procedure was repeated 24 hours later, and the animaIs were sacrifïced 16 hours after the last PHL.
Hemolytic anemia was produced by intra peritoneal administration of 40
mglkg body weight of PHZ (Sigma-Aldrich), once daily for 4 days and the mice were sacrificed at day 5.
Hypoxia was elicited by housing of mice in a closed chamber with controlled injection of N2 and 02 and with outward ventilation for removal
of excess CC2 and humidity. Mice were subjected to a 02 graduaI reduction 02 from 20.8% to 10% 02 over 6 hours and were subsequently housed at 10% 02 for 1, 3 or 5 days.
Prïmary hepatocytes isolation and cultures
Mice were anesthetized and the livers were perfused with HEPES buffer (Sigma-Aldrich) at 37 oc for 4 minutes at 10 milmin followed by a
perfusion with HEPES buffer supplemented with 0,14 UIml Collagenase D (Roche, Sainte-Foy, Quebec) at 37 oc for 7-8 minutes at 10 mi/min. Dissociated celis were isolated by gentie rubbing of the liver with a rubber policeman. Hepatocytes were peileted at 100 x g for 4 min at 4°C and washed twice with Wiiliams E incompiete medium (Invitrogen). Ihe washed hepatocytes were then resuspended in 25 ml of Williams incomplete media (Invitrogen) and layered onto a 50-ml conical tube containing 20 mi of Percoil (Sigma-Aldrich) (1 part lOx Hank’s balanced sait solution and 9 parts Percoll). The hepatocytes were mixed with Percoli by inverting five times and peileted by centrifugation at 300 x g for 10 min at4°C.
Finally, hepatocytes were washed once and were plated at 2.5 x i04 per cm2 onto type I collagen in Williams E medium with 10% fetal bovine serum (FBS) and 1% penicillin and streptavidin (PS). Two hours after plating, medium was changed and replaced with fresh medium. 20 hours after plating ceNs were treated with 20 ng/ml Il-6 or Tnf-Πor 100 ng/ml LPS for 24 hours.
41
Uver mononuclear ceils (LMCs) isolation
LMCs wete separated by centrifugation using the lympholyte density medium (Cederlane, Hornby, ON, Canada), following the supptiers’ instructions.
RNA quantification
Tissue samples were stored in RNALater (Ambion, Austin, Texas, USA) following the suppliers’ instructions. Total RNA was subsequently extracted with TRIZOL reagent (Invitrogen). Reverse transcription (RT) was performed with the Omniscript RI Kit (Qiagen, Mississauga, Ontario) using random hexamers (Invitrogen) and RNase inhibitor (Invitrogen) in the concentrations suggested by the supplier.
mRNA levels of Rgmc, /3-actin and hepcidin were measured by real-time PCR in a Rotor Gene 3000 Real lime DNA Detection System (Montrea! Biotech inc, Kirkland, Quebec) with the Quantilect SYBR+Green I PCR kit (Qiagen). Ail primers were designed using the Primer3 algorithm (91) so that they would flank at least one intron. The following primers were used in this study: /3-actin TGHACCAACTGGGACGACA-3’ and
5’-GGTGHGAAGGTCICAAA-3’; Rgmc
3’; hepcidin 5’-AGAGCTGCAGCCTHGCAC-3’ and
5-GAAGATGCAGATGGGGAAGT-3’.
Relative quantitation was performed using standard curves constructed from serial dilutions of PCR products and were attributed arbitrary concentrations. Alt standard curves generated were found to have excellent PCR amplification efficiency (90%-96%; 100% indicates that after each cycle the amount of temptate is doubled). as determined by their slopes. mRNA expression for each gene was determined by direct comparison with the standard curve of the specific target generated in each PCR run. Expression levels of the genes of interest were normalized to the housekeeping gene fi-a ctin.
Serum
ïron
and
transferrïn
saturation
measurements
Serum iron and total iron binding capacity (TIBC), and transferrin saturation were assessed by colorimetric assay with the Kodak Ektachem DT6O system (Johnson & Johnson, Ortho Clinical Diagnostics, Mississauga, Ontario).
43
Measurements of tissue iron concentration
Tissue samples were dried by incubating at 106 oc overnight and weighed ta determine the tissue dry weight. Tissues wete then ashed by incubating at 500 oc for 17h and iran was dissolved in 6N HCI. Iran levels were quantified by atomic absorption spectroscopy at the Geochemistry laboratory of the École Polytechnique de l’Université de Montréal.
Statïstïcal analysis
Student t test (unpaired, 2-tailed) was used for comparison between 2 groups. Multiple comparisons were statistically evaluated by one-way analysis of variance (ANOVA) followed by the Benferroni test.
Aim I
-Tissue Expression
Rgmc tissue and celi expression
The understanding cf the role cf Rgmc encompasses the study cf its tissue expression. We investigated the pattern of mRNA expression 0f Rgmc by qRT-PCR and found it expressed in the liver, heart and skeletal muscle (figure I OA) and absent from spleen, duodenum, kidney, lung, thymus, brain and bone marrow. This is in accordance to what has been previously described for mouse (89) and the human ortholog HJV (86). Therefore, as in human HJV mRNA expression, mouse Rgmc mRNA expression is found in the organs that are most affected in JH. Taking into account the importance of the liver in iron homeostasis, we concentrated our studies in this organ and evaluated mRNA production in hepatocytes and mononuclear ceils, separated using differential centrifugation in order to understand in which ceN population further in vitro experimentation on Rgmc regulation should be performed. We found Rgmc mRNA expression only in the hepatocyte fraction (figure lOB) indicating that Rgmc signaling is being mediated by the hepatocytes.
45
A
ci) cD h.B
0.4 0.3T
Rgtnc fi-actin 4, -,Figure 10 — Murïne Rgmc tissue and celi expression. Rgmc mRNA
expression was assessed using qRT-PCR (bargraphs) and classical RI
PCR (gel images) in several tissues (A), and in two liver ceil fractions obtained by differential centrifugation, separating the hepatocytes from
the remaining liver mononuclear celis (LMC) (B). Resuits are presented as means ± SEM (n=2-3).
Rgmc
Aim 2
—Rgmc response to modïfiers of iron
homeostasïs
Iron Levels
To assess how iron levels regulate Rgmc we next quantified Rgmc mRNA levels in 10 weeks alU C5ZBI/6 mice subjected to standard, low, or high iran diets fot two weeks.
We observed 2% dectease in Mean Corpuscular Volume (MCV) in the mice fed the low iron diet (table I), indicative that cell division in the bone marrow continues for longer than usual, resulting in smaller ceils, However the mice did flot developed anemia, as seen by analyzing RBC, Hb and HCT values. Mice fed with the high iran diet had slightly increased RBCs (7%), Hb (6%), HCT (9%) and MCV (4%).
47
Table I — Hematological indices of mice treated with a low, standard
and high iron containing diets. Red blood ceils (RBC), hemoglobin
(Hb), hematocrit (HCT) and mean corpuscular volume (MCV) 0f 10
weeks alU mice treated for twa weeks with a diet deficient in iran (-Fe), a standard laboratory diet (Std) or a diet with additional 2.5% w/w carbonyl
iron (+Fe). Resuits are presented as means ± SD (n=6 mice per group). Statistical analysis was pertormed by one way ANOVA followed by the Benferroni test. *p.<oos p<0,01, ***p<O 001 (compared to Std).
RBC Hb HCT MCV
Group (1 06/ml) fgIdl) (¾) (fL)
-Fe 9.5 ± 0.4 13.1 ± 0.5 42.4 ± 1.8 45 ± 0.8**
Std 9.2 ±0.2 13.2 ± 0.2 42.6 ± 0.8 46 ± 0.4
+Fe 9.8±0.2* 14.0±0.3 46.5±0.9 48±0.5**
Mice feU with the 10w iran diet decreased body stores, as may be
observed in the decrease of liver iran levels (43%) in comparison with
mice fed a standard iron diet (table li), indicating that mice did indeed
reduce the liver iran stores. However, this reduction in the lïver iran stores did flot influence circulating iran levels, since SI and TS
parameters do flot change, probably due ta the release of liver stored
iran into the circulation. Mice feU with the high iran diet became iran
overloaded as seen by the over two-fold increase in circulating iron
levels as well as liver iran levels, compared ta contraIs (table Il).
Rgmc mRNA levels, however, did flot differ among the mice subjected to the different diets (figure 1 lA), indicating that Rgmc regulation at the
mRNA level is not implicated in the control of iron homeostasis in
response to iron stores.
Table Il — lron measurements ïn mice treated with a low, standard and high iron containing diets. Serum iron (SI), transferrin saturation
(TS) and liver iton levels were quantified in 10 weeks old mice treated for two weeks with a diet deficient in iron (-Fe), a standard Iaboratory diet (StU) or a diet with additional 2.5% w/w carbonyl iron (+Fe). Resuits
are presented as means ± SD (n=6 mice per group). Statistical analysis
was performed by one way ANOVA foliowed by the Benferroni test.
***p<Q 001 (compared to Std).
SI 15 Liver Iron
Group (M)
(%)
(fig iron/g dry weight)-Fe 21±3 40± 2 124± 17***
Std 19±2 46± 5 221 ± 20
+Fe 394*** 109±15** 569±177***
Hereditary hemochromatosis
Based on the observation that mice lacking a functional Hfe protein have
lower than expected basal hepcidin levels (92), hepcidin has been
proposed to be in the Hfe pathway. In continuation with the hypothesis
that hepcidin is a downstream target cf Rgmc, we investigated whether
Rgmc levels in the primarily iron-overloaded fi2m and Hfe knockout
mice may explain the Iow basal hepcidin levels.
fi2m and Hfe’ mice have around 2-fold more liver and circulating iron
49
Liver Iran
(ig iron/g dry weight)
308 ± 40 726 + 1 48*** 738 ±227
compared with contraIs (table II). In spite of the high iron levels, these mouse models of HH displayed Rgmc levels akin to wildtype mice (figure 11 B), suggesting that abnormal Rgmc regulation in this mice is flot the causative factor for their Iow basal hepcidin levels in these strains.
Table III — Iron measurements in mice with genetic iron overloading. Serum iran (SI), transferrin saturation (TS) and Hver Iran
levels were quantifled in 10 weeks old wildtype (Wt), f32m’ or Hfe’ mice. Results are presented as means ± SD (n=6 mice per group).
Statistical analysis was performed by one way ANOVA followed by the Benferroni test. *p<O,O01 (compared to Wt).
SI TS
Group (1iM)
(%)
Wt 20±3 41±9
Hfe 45±3 96± 8
A
0.4 c.D .0 I zr = -Fe StUB
0.4 0.3 0.2 0.1 0.0 +FeFigure 1f — Hepatîc Rgmc mRNA expression in response to iron levels and in HH mouse models. Rgmc mRNA expression quantified by qRT-PCR and normalized to /3-actin in (A) 10 weeks old mice treated for
two
weeks with a diet deficient in iron),
a standard Iaboratory diet(LI)
or a diet wîth additional 2.5% w/w carbonyl iron(D);
(B) 10 weeks old wildtype(,
Hfe’(E)
or fi2m’(D)
mice. Resufts are presented asmeans ± SEM (n=6 per group). Statistical analysis was performed by
one way ANOVA.
51
Hypoxia
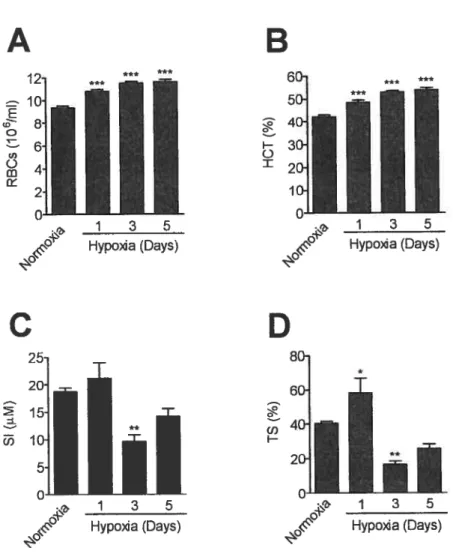
To investigate whether Rgmc mRNA levels are regulated by hypoxia, we subjected 10 weeks-old mice to 10% oxygen levels for 1, 3 or 5 days. Mice subjected to hypoxia elevated RBCs by 15% by day 1 ta a maximum of 25% increase by day 5 (figure 12A). HCT values were also elevated by day I to 15% and the maximum increase cf 27% was attained by day 5 (figure 12B). This increase of RBCs and HCT values in response to hypoxia are in accordance to what has previousiy been described (93) and indicate that the mice increased the erythropoiesis in response to the hypoxic stimulus.
TS increased 44% at day I and decreased to 40% of basal levels by day 3, returning to levels similar ta normoxic contrais by day 5 (figure
12D). SI behaved similarly. However, in contrast to TS, the slight increase by day 1 was not statistically different, there was a marked decrease to 51 % of normoxic controls by day 3. At day 5 SI leveis were similar to normoxic mice (figure 1 2C).
The increase cf TS at day 1 suggests a mobilization cf iran from storage to meet the erythropoietic demand and the TS and SI decrease by day 3 may reflect a reduction cf iron in the stores. By day 5 TS and SI start to stabilize and approach the levels found in normoxic control.
Rgmc levels were found upregulated 2-fold by day 1, after which it
decreases ta 146% cf basal levels by day 3 and to levels similar ta
normoxic controis by day 5 (figure 13) suggesting that Rgmc may play a role in the changes observed in iran metabolism during acute hypoxia.
53
Figure 12 — Hematological îndices and iron measurements in mice
subjected to hypoxïa. 10 weeks old mice were subjected to 10%
oxygen levels (hypoxia) for 1, 3 or 5 days. Controls remained in normoxic conditions (21% oxygen). Blood was extracted as described in materials and methods and the hematological indices of red blood ceNs
(A) and hematocrit (B) were measured. Serum iron (C), and transferrin saturation (D) were also quantified. Results are presented as means ±
SEM (n=5 per group). Statistical analysis was performed by one way ANOVA foNowed by the Benferroni test. *p<005 **p<OO1 ***p<0 001
(compared to normoxic group).
A
1 2 10 c6ail
2
2o
1 3 5 Hypoaa fDays)B
6 5g:0
Ï”
‘2 10 O 1 3 5 . Hypoxia (Days)C
D
51t CI)H 1 3 5 Hypoda (Days) 1 3 5 Hypoxia (Days)j
O.6Fïgure 13 — Hepatic Rgmc mRNA expression in response to hypoxia. Rgmc mRNA expression quantified by qRT-PCR and normalized to 16-actin in 10 weeks old mice subjected to 10% oxygen levels (hypoxia) for 1, 3 or 5 days. Controls remained in normoxic conditions (21% oxygen). Resufts are presented as means ± SEM (n=5 per group). Statistical analysis was performed by one way ANOVA followed by the Benferroni test. *p<005 **p<OO1 (compared to
normoxic group).
0.2-1 3 5 Hypoxia (Days)
55
Anemia
To assess how Rgmc may be important for iton homeostasis in anemia, we subjected 10 weeks-old C5ZBI/6 mice ta phlebotomy- and hemolytic derived anemias. In the phlebotomy-treated mice, successive bleedings lead ta a 3-fold reductïon of RBC numbers, Hb levels and HCT (table IV), whereas no significant changes were found at the levels of SI or TS (table V). In hemolytic anemia, the lysis of RBC led to s 3-fold lower RBC count and HCT and a 26% reduction on Hb (table IV). However, in contrast ta what was found in the phlebotomy model, a drastic increase in SI (3-fold) and TS (2-fold) is also found, probably due ta the release of the iran from the lysed RBCs into the bloodstream (table V). This data indicates that we were abte to induce anemia in bath of the mouse models.
Rgmc mRNA expression was found not ta change in either of the twa models (figure 14), suggesting that, in contrast to what was found in the model for hypoxia, changes in Rgmc mRNA expression are not implicated in the regulation of iran metabolism in response ta anemia.
Table IV— Hematological indices in PHL and PHZ treated mïce. Red
blood ceils (RBC), hemoglobin
f
Hb), hematocritf
HCT) and mean corpuscular volume (MCV) 0f 10 weeks alU mice phlebotomized fPHL) or with phenylhydrazine(PHZ)-induced anemia, as described in the material and methods section. Resuits are presented as means ± SD. Statistical analysis was performed by one way ANOVA followed by the Benferroni test. *p<0,001 (compared ta contrai).RBC Hb HCT MCV
Group N
f
106/mI) (gIdi)f %)
(fL)ContraI 6 9.3±0.3 13.7±0.5 42.3±1.8 46±0.8
PHL 5 3.2±0.3 5.1 ±0.6* 14.3±1.3*** 45±08
PHZ 6 2.9±0.2* 10.2±0.9*** 13.0±1.7 45±2.9
Table V — Iron measurements in mice PHL and PHZ treated mice. Serum iron (SI) and transferrin saturation (TS) in 10 weeks old mice phlebotomized
f
PHL) or with phenylhydrazine(PHZ)-induced anemia, as described in the methods section. Results are presented as means ± SD. Statistical analysis was performed by one way ANOVA followed by the Benferroni test. ***p<0 001 (compared to control).Si 15
Group N (pM)
f %)
Control 6 25 ± 3 58 ± 7
PHL 5 24±7 56±16
57 0.4
T
0.3 ,— . o D I 0.2 01-t—
PHZ PHL (n6) (n5)Figure 14 — Hepatic Rgmc mRNA expression in response to anemia. Rgmc mRNA expression quantified by qRT-PCR and
normahzed to /3-actin in 10 weeks old non-anemic control mice
$),
with phlebotomy-derived anemia (PHL)(E)
or with phenylhydrazine-inducedanemia (PHZ)
(D).
Resuits are presented as means ± SEM. Statisticalanalysis was performed by one way ANOVA. 0.0•
CtrI