HAL Id: inserm-01054534
https://www.hal.inserm.fr/inserm-01054534
Submitted on 9 Sep 2014HAL is a multi-disciplinary open access archive for the deposit and dissemination of sci-entific research documents, whether they are pub-lished or not. The documents may come from teaching and research institutions in France or abroad, or from public or private research centers.
L’archive ouverte pluridisciplinaire HAL, est destinée au dépôt et à la diffusion de documents scientifiques de niveau recherche, publiés ou non, émanant des établissements d’enseignement et de recherche français ou étrangers, des laboratoires publics ou privés.
marrow by intravoxel incoherent motion (IVIM) and
non-negative least square (NNLS) analysis.
Antoine Marchand, Eric Hitti, Frédéric Monge, Hervé Saint-Jalmes, Raphaël
Guillin, Régis Duvauferrier, Giulio Gambarota
To cite this version:
Antoine Marchand, Eric Hitti, Frédéric Monge, Hervé Saint-Jalmes, Raphaël Guillin, et al.. MRI quantification of diffusion and perfusion in bone marrow by intravoxel incoherent motion (IVIM) and non-negative least square (NNLS) analysis.: IVIM and NNLS in bone marrow. Magnetic Resonance Imaging, Elsevier, 2014, 32 (9), pp.1091-6. �10.1016/j.mri.2014.07.009�. �inserm-01054534�
MRI quantification of diffusion and perfusion in bone marrow by intravoxel
incoherent motion (IVIM) and non-negative least square (NNLS) analysis.
AJ. Marchand1, E. Hitti2, 3, F. Monge2, 3, H. Saint-Jalmes2, 3, 4, R. Guillin1, R. Duvauferrier1 and G. Gambarota2, 3
1 Department of Imaging, Rennes University Hospital, Rennes, France 2 INSERM, UMR 1099, Rennes, F-35000, France
3 Université de Rennes 1, LTSI, Rennes, F-35000, France 4 CRLCC, Centre Eugène Marquis, Rennes, F-35000, France
Running Head: IVIM and NNLS in bone marrow.
Corresponding author: Giulio Gambarota, Ph.D. Professor
INSERM, U1099
Université de Rennes 1, LTSI 35043 Rennes, France
tel: 02 23 23 48 49
email: gambarota@gmail.com
Word count: 5301
Number of figures and tables: 5 figures and 1 table Number of references: 51
Abstract
Object To assess the feasibility of measuring diffusion and perfusion fraction in vertebral bone marrow using the intravoxel incoherent motion (IVIM) approach and to compare two fitting methods, i.e., the non-negative least squares (NNLS) algorithm with the more commonly used Levenberg-Marquardt (LM) non-linear least squares algorithm, for the analysis of IVIM data.. Materials and Methods MRI experiments were performed on fifteen healthy volunteers, with a diffusion-weighted echo-planar imaging (EPI) sequence at five different b-values (0, 50, 100, 200, 600 s/mm2), in combination with a STIR module to suppress the lipid signal. Diffusion
signal decays in the first lumbar vertebra (L1) were fitted to a bi-exponential function using the LM algorithm and further analyzed with the NNLS algorithm to calculate the values of the apparent diffusion coefficient (ADC), pseudo-diffusion coefficient (D*) and perfusion fraction. Results The NNLS analysis revealed two diffusion components only in seven out of fifteen volunteers, with ADC = 0.60 ± 0.09 (10-3 mm2/s), D* = 28 ± 9 (10-3 mm2/s) and perfusion
fraction = 14 ± 6 %. The values obtained by the LM bi-exponential fit were: ADC = 0.45 ± 0.27 (10-3 mm2/s), D* = 63 ± 145 (10-3 mm2/s) and perfusion fraction = 27 ± 17 %. Furthermore, the
LM algorithm yielded values of perfusion fraction in cases where the decay was not bi-exponential, as assessed by NNLS analysis.
Conclusion
The IVIM approach allows for measuring diffusion and perfusion fraction in vertebral bone marrow; its reliability can be improved by using the NNLS, which identifies the diffusion decays that display a bi-exponential behaviour.
Introduction
Measurements of the water apparent diffusion coefficient (ADC) and tissue perfusion in vertebral bone marrow are of interest for investigations of a number of pathologies (1-3). Water diffusion provides a means for tissue microstructure characterization (4-7) and it has been shown that the water diffusivity in bone marrow allows to distinguish between benign and malignant lesions and to monitor myeloma infiltration (8, 9). Of relevance in clinical and research studies is also the assessment of bone marrow perfusion, for tumor response to therapy and for evaluation of compression fractures and metastasis (10-13).
Bone marrow consists of two tissue components: the yellow adipose marrow, which is composed mostly of fatty tissue and accounts for up to 80% of bone marrow in a healthy adult, and red marrow, which consists mostly of hematopoietic cells, but also contains up to 40% of fatty tissue (14). The large amount of lipids represents a confounding factor in the measurement of the water ADC (15) and tissue perfusion in bone marrow (16), thus it is preferable to employ fat suppression techniques.
Measurements of both ADC and tissue perfusion can be achieved with the MRI approach of the intravoxel incoherent motion (IVIM), introduced by Le Bihan more than two decades ago (17). The IVIM approach has been recently ‘rediscovered’ as an attractive method for assessing perfusion fraction in different organs (18-26). In IVIM measurements, images are acquired with different diffusion-sensitizing gradients (i.e., at different ‘b-values’) to measure tissue micro-capillary perfusion and water diffusivity using the signal decay at relatively small (0-100 s/mm2) and large (100-1000 s/mm2) b-values, respectively. The calculation of the perfusion fraction
within the IVIM model relies on the assumption that the diffusion signal decay is bi-exponential. To date, data analysis approaches based on the non-linear least squares algorithm have been investigated to extract the perfusion fraction from the bi-exponential diffusion decay (7, 27). However, in certain experimental conditions the low signal-to-noise ratio (SNR) as well as motion artifacts and other factors might affect the data quality and thus the signal decay might not necessarily display two diffusion components. As the knowledge of diffusion decay characteristics (specifically, the number of diffusion components) is a fundamental prerequisite for calculating the perfusion fraction, it is important to employ appropriate methods of data analysis. In this respect, the non-negative least square (NNLS) technique (28) could be of interest
for the analysis of IVIM data. In fact, the NNLS technique does not require a priori assumptions about the the number of components in a given decay and in recent years it has been extensively used to investigate the multi-exponential characteristics of transverse relaxation decays (29-34). Given the clinical interest in diffusion and perfusion measurements in vertebral bone marrow, and the challenges related to both data acquisition and analysis, the aim of this study was twofold: first, to assess the feasibility of measuring diffusion and perfusion fraction in vertebral bone marrow using the IVIM approach, combined with fat suppression; secondly, to compare two fitting methods, i.e., the NNLS with the more commonly used Levenberg-Marquardt (LM) non-linear least squares algorithm, for the analysis of IVIM data.
Materials and Methods
MR Imaging
All experiments were conducted according to the procedures approved by the local institutional review board. A group of fifteen healthy women volunteers (age between 18 and 30 years) was examined on a 1.5 T scanner (Siemens Healthcare, Erlangen, Germany). This population sample was chosen because women with regular menstruations have more red marrow than men and therefore higher bone marrow perfusion (). A urine pregnancy test was performed before inclusion and pregnant women were not included in the study. The body coil was used for transmission. The spine-coil and a phased array coil that was positioned on the torso of the volunteers were used for reception.
Multi-planar scout gradient-echo images and coronal T2-weighted short-TI inversion recovery (STIR) images were acquired prior to diffusion MRI. Diffusion-weighted echo-planar imaging (EPI) was performed at five different b-values (0, 50, 100, 200, 600 s/mm2) with a STIR module
to suppress the lipid signal. The STIR method was chosen because it provides robust fat suppression, though at the expenses of SNR. Other imaging parameters were: TR/TE = 10900/75 ms, inversion time TI = 170 ms, FOV of 312 mm ! 500 mm, slice thickness of 4 mm, 40 slices, matrix size of 269x384 and 2 averages, total scan time of 6 min 22 s. The diffusion sensitization gradients were applied along three directions and trace diffusion-weighted images were generated.The minimum b-value available (with the exception of the b-value = 0 s/mm2) was 50 s/mm2 and only b-values multiple of 50 s/mm2 were feasible. Vendor-supplied sequences were used for all measurements.
A dedicated Plexiglas™ support of a cradle-like shape was designed and built for the current study (Figure 1). During the MR experiment, the support was positioned on the spine coil. Four cylindrical phantoms (diameter = 3.5 cm, length = 40 cm) were integrated in this support. Two phantoms were filled with distilled water and the other two phantoms with distilled water and 25% Polyethylene glycol (PEG). These phantoms, employed to verify the performance of the experimental apparatus, allowed for the measurement of the signal decay in water and PEG, which is known to decrease mono-exponentially with increasing b-values.
Data Analysis
A region of interest (ROI) was drawn to encircle the first lumbar vertebra (L1) on the MR diffusion image at the b-value = 0 s/mm2. The mean signal intensity and standard deviation was
calculated at all b-values for the same ROI. The average area of the ROI over all volunteers was 1.8 ± 0.3 cm2. As a reference, ROIs were also drawn in the water and PEG phantoms to measure
the ADC of these substances.
Fitting multi-exponential decay curves is a notorious problem in MRI and in many other fields of science (36, 37). Here, we employed two methods: the NNLS and the LM non-linear least squares algorithm.. Within the NNLS framework (28), the signal intensity as a function of b-values is written as:
y(bi) = !j exp(-bi Dj) s(Dj) = !j Aij sj ; i = 1, 2, …N; j = 1, 2, …M [1]
where bi is the ith b-value, y(bi) the mean signal intensity of the ROI, s(Dj) the unknown
amplitude of the component with diffusion coefficient Dj, N the number of b-values, M the
number of allowed diffusion components and A is the matrix containing the exponential kernel functions. The amplitudes sj that minimize the least-squares misfit are determined by the
following equation:
!i (!j Aij sj - yi)2 + µ !i (!j Hij sj )2; i = 1, 2, …N; j = 1, 2, …M [2]
where µ is the regulizer parameter (29) and H is the identity matrix. Thus, the NNLS algorithm calculates the number of diffusion components in a given decay curve and provides the value of the diffusion coefficient and amplitude of each diffusion component. Using the NNLS results, the perfusion fraction was calculated as the normalized amplitude of the faster diffusion component. Furthermore, fits of the signal decay with b-values to a bi-exponential function were performed using a Levenberg-Marquardt (LM) non-linear least squares algorithm. The bi-exponential function was S = (f) exp(-bn·D*) + (1-f) exp(-bn·ADC) where f and (1-f) are relative
fractions of the amplitudes of the fast and slow diffusion components with diffusion values D* and ADC, respectively. It should be noted here that f represents the perfusion fraction and the ADC is the tissue diffusion coefficient that is typically measured with diffusion MRI.
The data analysis was performed with Matlab (MathWorks, Natick, MA, USA). Data are expressed as mean ± standard deviation.
Results
MR images of one volunteer are shown in Figure 2. On the MR coronal image (Figure 2, left) the location of an axial diffusion-weighted image (Figure 2, right) is illustrated by the horizontal line. The ROI for the analysis of the diffusion decay in the L1 vertebra is indicated on the axial image (Figure 2, right). The graph of Figure 3 shows an example of a fat-suppressed diffusion decay from an ROI in the vertebral bone marrow (L1) of one volunteer. The results of the NNLS analysis of the same diffusion decay are shown in Figure 4. The NNLS analysis revealed two diffusion components: a fast component with diffusion coefficient (D*) of ~ 20x10-3 mm2/s and a
slow component with diffusion coefficient (ADC) of ~ 0.7x10⁻³ mm2/s (Figure 4). The perfusion
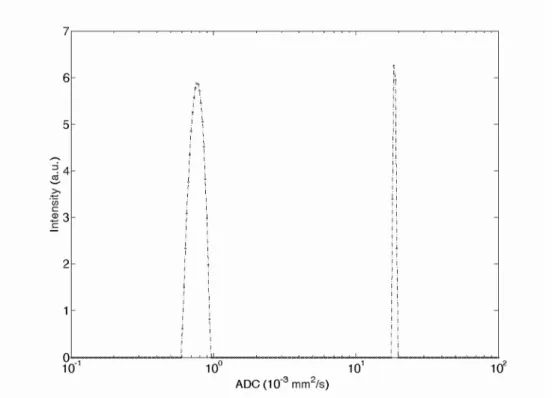
fraction calculated by NNLS analysis was 14 %. The NNLS analysis of the diffusion decay in the phantoms yielded a single component (Figure 5), with NNLS peaks at ~ 2.1x10⁻³ mm2/s and
~ 1.2x10⁻³ mm2/s for water and PEG, respectively.
The results of the NNLS analysis are provided in Table 1. For comparison purposes, the results of the bi-exponential fit performed with the LM algorithm are listed as well in the same table. The NNLS analysis of diffusion decays revealed two diffusion components in seven out of fifteen volunteers, with (mean ± standard deviation) ADC = 0.60 ± 0.09 (10-3 mm2/s), D* = 28 ±
9 (x10-3 mm2/s) and perfusion fraction = 14 ± 6 % (Table 1). The mean values obtained by the LM bi-exponential fit were: ADC = 0.45 ± 0.27 (10-3 mm2/s), D* = 63 ± 145 (10-3 mm2/s) and
perfusion fraction = 27 ± 17 %. It should be noted that in the experiments where the NNLS yielded two diffusion components (volunteer # 3, 5, 6, 8, 10, 12, 13) the NNLS-derived values of ADC, D* and perfusion fraction were similar to the correspondent LM-derived values. In all cases, NNLS analysis yielded a single component for diffusion decay in the water and PEG phantoms.
Discussion
In the current study, the feasibility of measuring the water ADC and perfusion in vertebral bone marrow was investigated on a 1.5 T clinical scanner with the IVIM approach, in combination with the NNLS data analysis. It is well established that MRI has become the modality of choice for abdominal imaging and in particular for assessing non-invasively a number of vertebral bone marrow disorders with T1, T2 and diffusion-weighted MR images. In addition, it has been shown that quantitative diffusion measurements provide an added value to the MR examination, especially in the case of longitudinal studies or group comparisons.
A relatively large range of values for the water ADC in vertebral bone marrow is found in the literature. This is mainly due to the inter-scanner variability and to the differences in pulse sequences -EPI, stimulated-echo (STE), fast spin-echo (FSE), line-scan diffusion imaging (LSDI)- used in each study (3, 7, 38, 39). In studies where the diffusion-weighted EPI sequence with fat suppression was employed, the measured values of the water ADC ranged from 0.23x10 -3 mm2/s (40) to 1.66x10⁻³ mm2/s (41), with most studies yielding values close to 0.50x10⁻³
(mm2/s), as in the study by Hatipoglu et al., (0.46 ± 0.03 10-3 mm2/s, (42)), by Griffith et al. (0.46
± 0.08 10-3 mm2/s, (3)), and by Yeung et al. (0.50 ± 0.09 10-3 mm2/s, (7)), for instance. The value of the water ADC of vertebral bone marrow measured in the current study is close to the values found in most of these studies.
In addition to quantitative diffusion measurements, perfusion measurements are of interest in bone marrow for investigations of osteoporosis, tumor, metastases and compression fractures. It has been recently shown that perfusion could also serve as a parameter of early response of myeloma to anti-angiogenic therapy (11). In most cases, perfusion in bone marrow has been measured with dynamic contrast-enhanced (DCE) MRI (1, 3) and only a limited number of studies have employed other approaches such as IVIM (7) and arterial spin labeling, ASL (11). In the IVIM study by Yeung et al., fat-suppressed diffusion-weighted images were acquired at ‘low’ (0-100 s/mm2) and ‘high’ (100-500 s/mm2) b-values to measure bone marrow perfusion
and diffusion of the third lumbar vertebra (7). The value of ADC found by Yeung et al. in the current study is in good agreement with the value of ADC found in the current study; however, values of the perfusion fraction were not reported by Yeung et al. because, as the authors explained, no reliable estimate could be made. In the current study, perfusion measurements
yielded reliable results -as assessed by NNLS analysis- only in seven out of fifteen subjects. Thus, the results of the current study confirm in part the findings of the work by Yeung et al., i.e., the low reliability of the IVIM approach for perfusion measurements in vertebral bone marrow, within the constraints of a clinical protocol.
The NNLS technique gives an important aid in the data analysis of signal decays, since it does not require a priori assumptions about the number of decay components.. The NNLS analysis has been extensively employed to investigate the multi-component characteristics of transverse relaxation (T2 and T2*) decays. Most of these studies have been focused on brain, for myelin quantitation (44-46). Other applications have included the analysis of the T2 relaxation decay in muscle (47, 48) and nerve (49).
In the current study, the values of perfusion fraction obtained by the NNLS and by the LM bi-exponential fit were 14 ± 6 % and 27 ± 17 %, respectively. As indicated by Le Bihan and Turner (50) the IVIM perfusion fraction is the fractional volume of capillary blood flowing in each voxel. Thus, taking a fat fraction of 0.3 for healthy young female (51), and a tissue NMR-visible water fraction of 0.8 (50), one can estimate an average value of capillary blood volume of ~ 7,8 mL/min/100 g and ~ x,x mL/min/100 g, obtained by the NNLS and by the LM bi-exponential fit, respectively. The value estimated by the NNLS is close to the value of blood volume of 5.9 ± 2.6 mL/100 mL found by Biffar et al. (16).
Furthemore, in subjects where the NNLS did not provide evidence for the presence of two components -Table 1, subject 15, 9, 7, 1, for instance- the perfusion fraction yielded by the LM bi-exponential fit was 50, 43, 57, 36 %, respectively, which in turn corresponds to a capillary blood volume in the range of 20 to 31 mL/100 g. These values of blood volume appear higher than the physiological range for healthy subjects (16).
It should be noted that simple range criterions could be used to discard the results of the LM bi-exponential analysis in healthy subjects, where typically the range of physiologically plausible values is known.. On the other hand, this might not be the case in pathological conditionsthus a method without a priori assumptions about the number of diffusion components, such as the NNLS, is relevant. In the current study, the bi-exponential behavior of the diffusion signal decay in the L1 was detectable in seven out of fifteen volunteers. In each experiment, diffusion signal decays were also measured in the water and PEG phantoms positioned next to the volunteers, to check the performance of the experimental apparatus in order to rule out that the bi-exponential
feature could originate from mis-adjustments. In all cases, the NNLS analysis yielded a single component for the diffusion signal decay in water and PEG. This suggests that the bi-exponential behavior observed in vivo in the vertebral bone marrow could not be ascribed to mis-calibrations or measurements pitfalls.
When comparing the different methods (DCE-MRI, IVIM and ASL) that have been employed for perfusion measurements in bone marrow, it can be stated that the advantage of both IVIM and ASL over DCE-MRI is that they do not require administration of contrast agent and therefore they are less invasive. Thus, both IVIM and ASL could be an attractive alternative to the more established DCE-MRI -though, at this stage, DCE-MRI measurements appear to be more robust than IVIM and ASL. It should be also noted, however, that due the large amount of lipids a quantitative measure of perfusion with DCE-MRI is more challenging in bone marrow than in other tissues and the lipid content needs to be known and taken into account in the data analysis for a proper interpretation of the DCE-MRI data (2).
IVIM measurements in vertebral bone marrow with the STIR fat suppression suffer from an intrinsic low SNR. On the other hand, due to the large fat content in the vertebra (60-80% of the total tissue), it is preferable to suppress the signal of fat in order to investigate the water diffusion and the perfusion fraction. As shown by Mulkern et al. (15), even small percentages of lipid within a voxel can drastically affect diffusion coefficient measurements in bone marrow; the same applies to perfusion, as shown by Biffar et al. (16). Further studies will be required in order to test IVIM measurements with lipid suppression techniques other than the STIR approach, which results in a significant loss of signal.
One limitation of this study is that the imaging protocol was designed for a clinically acceptable scan time and with a spatial coverage that is consistent with standard clinical protocols. This relatively large spatial coverage comes at the penalty of increased scan time and therefore a decreased number of b-values. Future studies will include a more detailed coverage of the water diffusion decay, i.e., the acquisition of additional b-values, especially small b-values, in order to improve the quantification of perfusion (52). Furthermore, there was a limitation on the choice of b-values in the pulse sequence used in this study. Recently, a new pulse sequence provided by the vendor allows for a more flexible choice of b-values that will significantly improve the sampling of the fast-decaying component. Overall, it should be stressed that additional studies will be necessary to improve the measurement reliability. Improvements in coil design, pulse
sequences, motion correction and fat suppression methods will contribute to ameliorate the diffusion decay curve and therefore increase reliability of the IVIM approach in vertebral bone marrow.
Conclusion
The IVIM approach allows for measuring diffusion and perfusion fraction in vertebral bone marrow. The NNLS method, which identifies the diffusion decays that display a bi-exponential behaviour, , provides an added value in the analysis of the IVIM data.
References
1. Biffar A, Dietrich O, Sourbron S, Duerr HR, Reiser MF, Baur-Melnyk A. Diffusion and perfusion imaging of bone marrow. Eur J Radiol. 2010 Dec;76(3):323-8.
2. Biffar A, Sourbron S, Dietrich O, Schmidt G, Ingrisch M, Reiser MF, et al. Combined diffusion-weighted and dynamic contrast-enhanced imaging of patients with acute osteoporotic vertebral fractures. Eur J Radiol. 2010 Dec;76(3):298-303.
3. Griffith JF, Yeung DK, Antonio GE, Wong SY, Kwok TC, Woo J, et al. Vertebral
marrow fat content and diffusion and perfusion indexes in women with varying bone density: MR evaluation. Radiology. 2006 Dec;241(3):831-8.
4. Dietrich O, Biffar A, Reiser MF, Baur-Melnyk A. Diffusion-weighted imaging of bone marrow. Semin Musculoskelet Radiol. 2009 Jun;13(2):134-44.
5. Herneth AM, Friedrich K, Weidekamm C, Schibany N, Krestan C, Czerny C, et al.
Diffusion weighted imaging of bone marrow pathologies. Eur J Radiol. 2005 Jul;55(1):74-83.
6. Maeda M, Sakuma H, Maier SE, Takeda K. Quantitative assessment of diffusion
abnormalities in benign and malignant vertebral compression fractures by line scan diffusion-weighted imaging. AJR Am J Roentgenol. 2003 Nov;181(5):1203-9.
7. Yeung DK, Wong SY, Griffith JF, Lau EM. Bone marrow diffusion in osteoporosis:
evaluation with quantitative MR diffusion imaging. J Magn Reson Imaging. 2004 Feb;19(2):222-228.
8. Baur A, Stabler A, Bruning R, Bartl R, Krodel A, Reiser M, et al. Diffusion-weighted MR imaging of bone marrow: differentiation of benign versus pathologic compression fractures. Radiology. 1998 May;207(2):349-56.
9. Messiou C, Collins DJ, Morgan VA, Desouza NM. Optimising diffusion weighted MRI
for imaging metastatic and myeloma bone disease and assessing reproducibility. Eur Radiol. 2011 Aug;21(8):1713-8.
10. Chen WT, Shih TT, Chen RC, Lo HY, Chou CT, Lee JM, et al. Blood perfusion of
vertebral lesions evaluated with gadolinium-enhanced dynamic MRI: in comparison with compression fracture and metastasis. J Magn Reson Imaging. 2002 Mar;15(3):308-14.
11. Fenchel M, Konaktchieva M, Weisel K, Kraus S, Brodoefel H, Claussen CD, et al. Early response assessment in patients with multiple myeloma during anti-angiogenic therapy using arterial spin labelling: first clinical results. Eur Radiol. 2010 Dec;20(12):2899-906.
12. Hawighorst H, Libicher M, Knopp MV, Moehler T, Kauffmann GW, Kaick G.
Evaluation of angiogenesis and perfusion of bone marrow lesions: role of semiquantitative and quantitative dynamic MRI. J Magn Reson Imaging. 1999 Sep;10(3):286-94.
13. Nosas-Garcia S, Moehler T, Wasser K, Kiessling F, Bartl R, Zuna I, et al. Dynamic contrast-enhanced MRI for assessing the disease activity of multiple myeloma: a comparative study with histology and clinical markers. J Magn Reson Imaging. 2005 Jul;22(1):154-62.
14. Ricci C, Cova M, Kang YS, Yang A, Rahmouni A, Scott WW, Jr., et al. Normal
age-related patterns of cellular and fatty bone marrow distribution in the axial skeleton: MR imaging study. Radiology. 1990 Oct;177(1):83-8.
15. Mulkern RV, Schwartz RB. In re: characterization of benign and metastatic vertebral compression fractures with quantitative diffusion MR imaging. AJNR Am J Neuroradiol. 2003 Aug;24(7):1489-90; author reply 90-1.
16. Biffar A, Schmidt GP, Sourbron S, D'Anastasi M, Dietrich O, Notohamiprodjo M et al. Quantitative analysis of vertebral bone marrow perfusion using dynamic contrast-enhanced MRI: initial results in osteoporotic patients with acute vertebral fracture. J Magn Reson Imaging. 2011 Mar;33(3):676-83.
17. Le Bihan D, Breton E, Lallemand D, Grenier P, Cabanis E, Laval-Jeantet M. MR
imaging of intravoxel incoherent motions: application to diffusion and perfusion in neurologic disorders. Radiology. 1986 Nov;161(2):401-7.
18. Le Bihan D. Intravoxel incoherent motion perfusion MR imaging: a wake-up call.
Radiology. 2008 Dec;249(3):748-52.
19. Luciani A, Vignaud A, Cavet M, Nhieu JT, Mallat A, Ruel L, et al. Liver cirrhosis: intravoxel incoherent motion MR imaging--pilot study. Radiology. 2008 Dec;249(3):891-9.
20. Yamada I, Aung W, Himeno Y, Nakagawa T, Shibuya H. Diffusion coefficients in
abdominal organs and hepatic lesions: evaluation with intravoxel incoherent motion echo-planar MR imaging. Radiology. 1999 Mar;210(3):617-23.
21. Döpfert J, Lemke A, Weidner A, Schad LR. Investigation of prostate cancer using diffusion-weighted intravoxel incoherent motion imaging. Magn Reson Imaging. 2011 Oct;29(8):1053-8.
22. Shinmoto H, Tamura C, Soga S, Shiomi E, Yoshihara N, Kaji T et al. An intravoxel incoherent motion diffusion-weighted imaging study of prostate cancer. AJR Am J Roentgenol. 2012 Oct;199(4):W496-500.
23. Delattre BM, Viallon M, Wei H, Zhu YM, Feiweier T, Pai VM et al. In vivo cardiac diffusion-weighted magnetic resonance imaging: quantification of normal perfusion and diffusion coefficients with intravoxel incoherent motion imaging. Invest Radiol. 2012 Nov;47(11):662-70.
24. Federau C, Maeder P, O'Brien K, Browaeys P, Meuli R, Hagmann P. Quantitative
measurement of brain perfusion with intravoxel incoherent motion MR imaging. Radiology. 2012 Dec;265(3):874-81.
25. Ichikawa S, Motosugi U, Ichikawa T, Sano K, Morisaka H, Araki T. Intravoxel
incoherent motion imaging of the kidney: alterations in diffusion and perfusion in patients with renal dysfunction. Magn Reson Imaging. 2013 Apr;31(3):414-7.
26. Liu C, Liang C, Liu Z, Zhang S, Huang B. Intravoxel incoherent motion (IVIM) in
evaluation of breast lesions: comparison with conventional DWI. Eur J Radiol. 2013 Dec;82(12):e782-9.
27. Patel J, Sigmund EE, Rusinek H, Oei M, Babb JS, Taouli B. Diagnosis of cirrhosis with intravoxel incoherent motion diffusion MRI and dynamic contrast-enhanced MRI alone and in combination: preliminary experience. J Magn Reson Imaging. 2010 Mar;31(3):589-600.
28. Lawson CL, Hanson RJ. Solving least squares problems: Englewood Cliffs, NJ: Prentice-Hall; 1974.
29. Whittall KP, Mackay AL. Quantitative interpretation of NMR relaxation data. J Magn Reson 1989;84:134-52.
30. Oh J, Han ET, Pelletier D, Nelson SJ. Measurement of in vivo multi-component T2
relaxation times for brain tissue using multi-slice T2 prep at 1.5 and 3 T. Magn Reson Imaging. 2006 Jan;24(1):33-43.
31. Reiter DA, Lin PC, Fishbein KW, Spencer RG. Multicomponent T2 relaxation analysis in cartilage. Magn Reson Med. 2009 Apr;61(4):803-9.
32. Zheng S, Xia Y. On the measurement of multi-component T2 relaxation in cartilage by MR spectroscopy and imaging. Magn Reson Imaging. 2010 May;28(4):537-45.
33. Bjarnason TA, McCreary CR, Dunn JF, Mitchell JR. Quantitative T2 analysis: the effects of noise, regularization, and multivoxel approaches. Magn Reson Med. 2010 Jan;63(1):212-7.
34. Hwang D, Chung H, Nam Y, Du YP, Jang U. Robust mapping of the myelin water
fraction in the presence of noise: synergic combination of anisotropic diffusion filter and spatially regularized nonnegative least squares algorithm. J Magn Reson Imaging. 2011 Jul;34(1):189-95.
35. Vande Berg BC, Lecouvet FE, Moysan P, Maldague B, Jamart J, Malghem J. MR
assessment of red marrow distribution and composition in the proximal femur: correlation with clinical and laboratory parameters. Skeletal Radiol. 1997 Oct;26(10):589-96.
36. Holmström K and Jöran Petersson J. A review of the parameter estimation problem of fitting positive exponential sums to empirical data. Appl Math Comput. 2002 Feb;126(1):31-61.
37. Istratov AA, Vyvenko, OF. Exponential analysis in physical phenomena. Rev Sci
Instrum. 1999 Feb;70:1233"1257.
38. Bammer R, Herneth AM, Maier SE, Butts K, Prokesch RW, Do HM, et al. Line scan
diffusion imaging of the spine. AJNR Am J Neuroradiol. 2003 Jan;24(1):5-12.
39. Oner AY, Aggunlu L, Akpek S, Tali T, Celik A. Diffusion-weighted imaging of the
appendicular skeleton with a non-Carr-Purcell-Meiboom-Gill single-shot fast spin-echo sequence. AJR Am J Roentgenol. 2007 Dec;189(6):1494-501.
40 Chan JH, Peh WC, Tsui EY, Chau LF, Cheung KK, Chan KB, et al. Acute vertebral body compression fractures: discrimination between benign and malignant causes using apparent diffusion coefficients. Br J Radiol. 2002 Mar;75(891):207-14.
41. Herneth AM, Philipp MO, Naude J, Funovics M, Beichel RR, Bammer R, et al. Vertebral metastases: assessment with apparent diffusion coefficient. Radiology. 2002 Dec;225(3):889-94. 42. Hatipoglu HG, Selvi A, Ciliz D, Yuksel E. Quantitative and diffusion MR imaging as a new method to assess osteoporosis. AJNR Am J Neuroradiol. 2007 Nov-Dec;28(10):1934-7. 43. Lenz C, Klarhofer M, Scheffler K. Feasibility of in vivo myelin water imaging using 3D multigradient-echo pulse sequences. Magn Reson Med. 2012 Aug;68(2):523-8.
44. MacKay A, Laule C, Vavasour I, Bjarnason T, Kolind S, Madler B. Insights into brain microstructure from the T2 distribution. Magn Reson Imaging. 2006 May;24(4):515-25.
45. Meyers SM, Vavasour IM, Madler B, Harris T, Fu E, Li DK, et al. Multicenter measurements of myelin water fraction and geometric mean T : Intra- and intersite reproducibility. J Magn Reson Imaging [Epub ahead of print]. DOI : 10.1002/jmri.24106
46. MacKay A, Whittall K, Adler J, Li D, Paty D, Graeb D. In vivo visualization of myelin water in brain by magnetic resonance. Magn Reson Med. 1994 Jun;31(6):673-7.
47. Gambarota G, Cairns BE, Berde CB, Mulkern RV. Osmotic effects on the T2 relaxation decay of in vivo muscle. Magn Reson Med. 2001 Sep;46(3):592-9.
48. Ploutz-Snyder LL, Nyren S, Cooper TG, Potchen EJ, Meyer RA. Different effects of
exercise and edema on T2 relaxation in skeletal muscle. Magn Reson Med. 1997 May;37(5):676-682.
49. Gambarota G, Mekle R, Mlynarik V, Krueger G. NMR properties of human median
nerve at 3 T: proton density, T1, T2, and magnetization transfer. J Magn Reson Imaging. 2009 Apr;29(4):982-6.
50. Le Bihan D and Turner R. The capillary network: a link between IVIM and classical perfusion. Magn Reson Med. 1992 Sep;27(1):171-8.
51. Kugel H, Jung C, Schulte O, Heindel W. Age- and sex-specific differences in the 1H-spectrum of vertebral bone marrow. J Magn Reson Imaging. 2001 Feb;13(2):263-8.
52. Lemke A, Stieltjes B, Schad LR, Laun FB. Toward an optimal distribution of b values for intravoxel incoherent motion imaging. Magn Reson Imaging. 2011 Jul;29(6):766-776.
Figure Legends
Figure 1. Plexiglas support for the water and PEG phantoms. The support consists of two
separate parts that can be adjusted to the anatomy of the patient. The cylindrical phantoms are integrated into the support. The schematic and a photo of a single element are shown on the top left panel and top right panel, respectively. The support is positioned on the spine coil and the volunteer lies supine on the support during the MR experiment.
Figure 2. Representative MR images of one volunteer. A coronal T2-weighted image (left) and
an axial diffusion-weighted image acquired at the b-value = 50 s/mm2 (right) are shown. In both acquisitions, a STIR-preparation module was used to suppress the lipid signal. The horizontal line on the coronal image indicates the position of the axial slice. The elliptical region of interest centered on the first lumbar vertebra (L1) is illustrated on the diffusion-weighted image.
Figure 3. Example of intravoxel incoherent motion (IVIM) data acquired on one volunteer. The
fat-suppressed diffusion decay from an ROI in the vertebral bone marrow (L1) and from an ROI in the noise are shown. As indicated by the curvature of the decay on the semi-log plot, the diffusion signal in bone marrow displays a bi-exponential behavior with a fast-decaying component for b-values between 0-100 s/mm2 and a slow-decaying component for b-values between 100-600 s/mm2. The NNLS analysis of this diffusion decay is shown in Figure 4.
Figure 4. The NNLS spectrum of a fat-suppressed diffusion decay from an ROI in the vertebral
bone marrow (L1) of one volunteer.The NNLS spectrum is plotted on a logarithmic scale with diffusion values equally spaced between 10-1 and 102 (x10-3) mm2/s. The NNLS spectrum
exhibits two peaks at ~ 0.7x10⁻³ mm2/s and ~ 20x10-3 mm2/s, with a perfusion fraction of 14%.
The diffusion coefficient of the slow component (~ 0.7x10⁻³ mm2/s) is consistent with the water
ADC value of vertebral bone marrow. Similarly, the value of diffusion coefficient of the fast component (~ 20x10-3 mm2/s) is consistent with pseudo-diffusion values related to tissue
Figure 5. The NNLS spectra of the diffusion decay in the water (top) and Polyethylene glycol
(PEG, bottom) phantoms. A single diffusion peak is observed in water at ~ 2.1x10⁻³ mm2/s and
Figure 1. Plexiglas support for the water and PEG phantoms. The support consists of two
separate parts that can be adjusted to the anatomy of the patient. The cylindrical phantoms are integrated into the support. The schematic and a photo of a single element are shown on the top left panel and top right panel, respectively. The support is positioned on the spine coil and the volunteer lies supine on the support during the MR experiment.
Figure 2. Representative MR images of one volunteer. A coronal T2-weighted image (left) and
an axial diffusion-weighted image acquired at the b-value = 50 s/mm2 (right) are shown. In both
acquisitions, a STIR-preparation module was used to suppress the lipid signal. The horizontal line on the coronal image indicates the position of the axial slice. The elliptical region of interest centered on the first lumbar vertebra (L1) is illustrated on the diffusion-weighted image.
Figure 3. Example of intravoxel incoherent motion (IVIM) data acquired on one volunteer. The
fat-suppressed diffusion decay from an ROI in the vertebral bone marrow (L1) and from an ROI in the noise are shown. As indicated by the curvature of the decay on the semi-log plot, the diffusion signal in bone marrow displays a bi-exponential behavior with a fast-decaying component for b-values between 0-100 s/mm2 and a slow-decaying component for b-values between 100-600 s/mm2. The NNLS analysis of this diffusion decay is shown in Figure 4.
Figure 4. The NNLS spectrum of a fat-suppressed diffusion decay from an ROI in the vertebral
bone marrow (L1) of one volunteer.The NNLS spectrum is plotted on a logarithmic scale with diffusion values equally spaced between 10-1 and 102 (x10-3) mm2/s. The NNLS spectrum exhibits two peaks at ~ 0.7x10⁻³ mm2/s and ~ 20x10-3 mm2/s, with a perfusion fraction of 14%.
The diffusion coefficient of the slow component (~ 0.7x10⁻³ mm2/s) is consistent with the water
ADC value of vertebral bone marrow. Similarly, the value of diffusion coefficient of the fast component (~ 20x10-3 mm2/s) is consistent with pseudo-diffusion values related to tissue
Figure 5. The NNLS spectra of the diffusion decay in the water (top) and Polyethylene glycol
(PEG, bottom) phantoms. A single diffusion peak is observed in water at ~ 2.1x10⁻³ mm2/s and
Table 1. Values of ADC, D* and perfusion fraction of vertebral bone marrow obtained by the
bi-exponential curve fit (Bi-exp) and the non-negative least square (NNLS) analysis in fifteen volunteers. The bi-exponential curve fit was performed using the Levenberg-Marquardt non-linear least squares algorithm. The NNLS analysis provided a bi-exponential behavior in seven out of fifteen volunteers. In the last row, the mean values and standard deviation are indicated.
Bi-exp ADC (10-3 mm2/s) Bi-exp D* (10-3 mm2/s) NNLS ADC (10-3 mm2/s) NNLS D* (10-3 mm2/s) Bi-exp Perfusion Fraction (%) NNLS Perfusion Fraction (%) 1 0.01 3.01 36 * 2 0.64 -- ** * 3 0.48 22.34 0.49 22.50 16 16 4 0.74 44.36 43 * 5 0.55 22.35 0,56 22.56 17 17 6 0.57 25.73 0.58 25.90 12 12 7 0.67 63.02 57 * 8 0.76 18.67 0.77 18.75 18 18 9 0.01 2.76 33 * 10 0.44 29.88 0.56 29.78 14 14 11 0.01 3.57 16 * 12 0.67 41.79 0.67 43.11 2 2 13 0.59 39.19 0.58 39.30 21 21 14 0.60 566.03 50 * 15 0.11 2.99 50 * 0.45 ± 0.27 63 ± 145 0.60 ± 0.09 28 ± 9 27 ± 17 14 ± 6
* Volunteers where NNLS did not provided two components.