HAL Id: hal-02061780
https://hal.archives-ouvertes.fr/hal-02061780
Submitted on 8 Mar 2019
HAL is a multi-disciplinary open access
archive for the deposit and dissemination of
sci-entific research documents, whether they are
pub-lished or not. The documents may come from
teaching and research institutions in France or
abroad, or from public or private research centers.
L’archive ouverte pluridisciplinaire HAL, est
destinée au dépôt et à la diffusion de documents
scientifiques de niveau recherche, publiés ou non,
émanant des établissements d’enseignement et de
recherche français ou étrangers, des laboratoires
publics ou privés.
Influence of kinetics on DDT simulations
Omar Dounia, Olivier Vermorel, Antony Misdariis, Thierry Poinsot
To cite this version:
Omar Dounia, Olivier Vermorel, Antony Misdariis, Thierry Poinsot. Influence of kinetics on DDT
sim-ulations. Combustion and Flame, Elsevier, 2019, 200, pp.1-14. �10.1016/j.combustflame.2018.11.009�.
�hal-02061780�
Any correspondence concerning this service should be sent to the repository administrator:
[email protected]
To link to this article : DOI:
10.1016/j.combustflame.2018.11.009
URL :
https://doi.org/10.1016/j.combustflame.2018.11.009
This is an author-deposited version published in:
http://oatao.univ-toulouse.fr/
Eprints ID: 22929
O
pen
A
rchive
T
oulouse
A
rchive
O
uverte (
OATAO
)
OATAO is an open access repository that collects the work of Toulouse
researchers and makes it freely available over the web where possible.
To cite this version: Dounia, Omar and Vermorel, Olivier and Misdariis,
Antony and Poinsot, Thierry
Influence of kinetics on DDT simulations.
(2019) Combustion and Flame, 200. 1-14. ISSN 0010-2180
Influence
of
kinetics
on
DDT
simulations
O. Dounia
a,∗,
O.
Vermorel
a,
A.
Misdariis
a,
T.
Poinsot
ba Centre Européen de Recherche et de Formation Avancée en Calcul Scientifique (C.E.R.F.A.C.S), France b Institut de Mécanique des Fluides de Toulouse (I.M.F.T), France
Keywords: DDT Detailed chemistry Flame acceleration Detonation onset DNS
a
b
s
t
r
a
c
t
DeflagrationtoDetonationTransition(DDT)isanintricateproblemthathasbeentacklednumerically, un-tilrecently,usingsingle-stepchemicalschemes.Thesestudies(summarizedinOranandGamezo,2007)
[1]showedthatDDTistriggeredwhenagradientofreactivityformsinsideapocketofunreacted ma-terial.However,recentnumericalsimulationsofhydrogen/airexplosionsusingdetailedreaction mecha-nisms(Libermanetal.,2010;Ivanovetal.,2011)[2,3]showed thatdetonationwavescanemergefrom theflamebrush,unlikewhatwasusuallyseeninthesingle-stepsimulations.Thepresentworkfocuses onchemistrymodelinganditsimpactonDDT.UsingtheidealizedHotSpot(HS)problemwithconstant temperaturegradient,thisstudyshowsthat,inthecaseofhydrogen/airmixtures,themulti-stepchemical descriptionisfarmorerestrictivethanthesingle-stepmodelwhenitcomestothenecessaryconditions forahotspottoleadtodetonation.Agasexplosionscenarioinaconfinedandobstructedchannelfilled withan hydrogen/airmixtureisthen considered.Inaccordancewith theHSanalysis, theZeldovich’s (1970)mechanism[4] isresponsibleforthe detonationinitiationinthesingle-step case,whereas an-otherprocess,directlyinvolvingthedeflagrationfront,initiatedDDT inthecomplexchemistrycase.In thelatter,ashockfocusingeventleadstoDDTintheflamebrushthroughPressurePulse(PP) amplifica-tion.
1. Introduction
Mining, process and energy industries suffer from billions of dollars ofworldwidelosses every yearduetogas explosions. In addition to these costs, explosion accidents are often tragic and lead to severe injuriesand fatalities. Thesedamages vary signifi-cantly froman a ccident toanother, depending on the explosion scenario. Asound knowledge ofexplosion physics is thereforeof vital importance for the prediction of hazard potentials and the implementationofefficientpreventivemeasures.
Gasexplosionshavebeenstudiedexperimentally[1,5], theoret-ically [4,6–11] and numerically[1,12–14]. Theyoccur when a re-active mixture is subjectedto an external sourceof energyfrom which a combustion wave emerges. This reaction wave can have twopossiblepropagationmodes[15,16]:supersonicinthecaseof detonationandsubsonicinthecaseofdeflagration.Thedirect ini-tiationofdetonationhasbeenstudiedexperimentallyand theoreti-cally[17–20]andisonlypossibleifasufficientenergyisdeposited quasi-instantaneously.Inmostcases,thisconditionisnotmetand adeflagrationemergesfromtheignitionsource.
∗ Corresponding author.
E-mail address: [email protected] (O. Dounia).
Deflagrations are intrinsically unstable and tend to accelerate continuously afterignition[16].ThisFlame Acceleration(FA) pro-cessiswellunderstoodthankstoextensiveexperimental (summa-rized intheCiccarelli andDorofeevreview paper[5]),theoretical
[6–8] andnumerical[12,13]works anddependson thedegree of confinementandobstruction encounteredby theflameduring its propagation.FAcaneitherresultinfastdeflagrationsorcreatethe appropriate conditions for the Deflagration-to-Detonation Transi-tion (DDT). Understanding DDT is crucial because it often leads to an escalation in the hazard scenario. Years of theoretical and numerical efforts, have been devoted to exploring the different mechanisms that can initiate DDT. Despite this, a first principle description ofthe relative importance of these mechanisms, and thepossibleinterplayamongthem,isstillincomplete.
During flameacceleration,thereaction frontactslikea piston
[15]moving thereactantsahead ofit.As aresultofthe displace-ment flow, compression waves/shocks are formed ahead of the flame.Thus,apropagatingdeflagrationwaveusuallyconsistsofthe reactionfrontfollowingaprecursorcompressionwave/shock.This deflagration-shock complex has been tackled by many investiga-tors[9,10,16].Theyshowedthat:(1)theprecursorshockis,in gen-eral,fasterthatthedeflagration;(2)oncethedeflagration reaches a critical speed, equal to the sound speed of the burned gases, there exists apath alongwhich adeflagration can reacha
veloc-Fig. 1. Sketch of the Gravent explosion channel geometry [26] . A series of 7 obstacles are evenly placed at the top and bottom plates of the channel. The constant spacing S is equal to 300 mm and the blockage ratio is Br = 2 h/H = 30% . From the last obstacle to the end plate, the channel is unobstructed allowing detonation propagation without perturbation. Distances are in millimeters.
ity equalto that ofthe precursorshock, forming a self-sustained detonationwave(orCJdetonation).Thispathisreferredtoasthe generalizedHugoniotcurvebyTroshin[11]andbasicallydescribes all the successivesolutions forthe double discontinuity problem during DDT.In otherwords, accordingto thissimpleapproachto DDT,atransitiontodetonationmustoccuronceacertainflame ve-locityisreached. Itdoes not,however,givea detaileddescription ofthetransitionitself.
A breakthroughindetonation researchoccurredwhen Oppen-heimandUrtiew[9,21],laterbackedupbythesimulationsofOran and Gamezo[1],showedthat the detonationonset isnot simply the result of the coalescence between a flame and a shock. In-steaditwasobservedthatthereactantstrappedbetweenthe lead-ing shockandthedeflagration areheatedandcompressedtothe point whereenough energyisaccumulatedandan explosioncan occur. Theseobservationsareconsistentwiththemechanism pro-posedbyZeldovichetal.[4]andlaterobservedexperimentallyby Leeetal.[22].Consider areactive mixtureexposed to agradient ofinductiontime
∇τ
I,whichmaybeagradientoftemperatureorpressureorreactantsconcentration[23].Areactionwaveemerges from the point of lowest induction time
τ
I and its propagationspeed dependson
∇τ
I. Fora steepinitial gradient,aweak shockformsandquicklydetachesfromthereactionwavewhichproceeds asanormalflame.Conversely,forasmallinitial
∇τ
I,themixtureissimplyuniformlyignitedwithoutshockformation.For interme-diatevaluesof
∇τ
I,thereactionwaveandthecompressionwavescan propagate inphase. Inthis case,the coherentenergy release causes thecompressionwaveto steepeninto ashock. The ampli-fication ofthe latterandits couplingtoa combustionwave later formsadetonation.
The presenceofobstacles intheflamepathisknown[1,24]to facilitateDDT.First,obstructionsenhanceFAthusproducingstrong shocksaheadoftheflame.Second,theseshockscaninteractwith theobstacles allowingshockfocusingatthecorners,shock reflec-tionsandcollisionsandshockflameinteractions.Theseevents cre-atetheappropriateconditionsforthedetonationonset.
This hasbeen the majortrend inDDT research until a recent paper ofKuznetsov etal.[25].Evaluating the Mach ofthe shock aheadoftheflamepriortoDDT,theyshowedthatthetemperature of thepreheat zone aheadof theflame(550Kfora stoichiomet-richydrogen/oxygenmixture)doesnotallowspontaneousignition. Therefore,theZeldovichmechanismcouldnotexplainDDTinthis case, whichraisedquestionsabouttheuniversalityofthe mecha-nism. Instead Liberman etal.[2]andIvanov etal. [3]performed numerical simulations withdetailedchemistrymodeling to show that thereexists another mechanism, different fromthe gradient of reactivity andinvolving the flame brush, that can explain the transitiontodetonation.
TheselastfindingssuggestthattheZeldovichmechanismisnot a universal triggerforDDT, andthat the scenarioleading to DDT maydependgreatlyonthechemistrymodelingusedinnumerical simulations. This motivatedthe present study, which focused on
theinfluenceofkineticsonDDTusingtwo-dimensional DNS.The configurationconsideredis basedontheGravent explosion chan-neldatabase[26].Theconfinedandobstructedchannel,presented inSection2,isfilledwithaquiescentstoichiometrichydrogen/air mixture. The 9S18R(9 speciesand 18 irreversiblereactions) and 3S1R(3speciesand1reaction)chemicalschemesusedinthis pa-per are presentedinSections 3.1and3.2.These mechanismsare firstcomparedusingthecanonicHotSpot(HS)casewithconstant temperaturegradientinSection3.4.Thisallowstoinvestigatethe requirements,intermsof temperatureandradius,forHS to trig-gerDDTusing3S1Rand9S18R, similarlytotheanalysisproposed byLibermanetal.[27,28].Theconclusionswillbeusedtoexplain theresultsofthesimulationsoftheBR30hS300channel,presented in Section 4. The impact of the chemistry modeling on the DDT mechanismisanalyzedinSection4.3.
2. Numericalsetup
The 2D direct numerical simulations presented in this paper are performed using the DNS/LES solver for the fully compress-ible multispeciesNavier-Stokes equationsAVBP,co-developped by CERFACS and IFPEN [29]. A centered continuous Taylor–Galerkin schemethird-orderinspaceandtime(TTGC[30])isused.
To investigate DDT in obstructed and confined channels, the BR30hS300 configuration of the Gravent database [26] is chosen (Fig.1).ThechannelisH=60mmhighandL=5400mmlong.7 obstaclesareevenlyspacedalongthetopandbottomwallsofthe channelwithaconstant blockageratioBr=2h/H=30%,whereh andHaretheheightofan obstacleandthechannel, respectively. The spacing S between the obstacles axis is equal to 300 mm. From the last obstacle (X=2.05m) to the closed end wall (X=5.4m),the section ofthechannel isconstant allowing deto-nationpropagationwithoutperturbation.Athree-dimensionalDNS ofa channel thislarge is not affordable.Only atwo-dimensional longitudinal slice of the BR30hS300 configuration is therefore considered.Notethat2D simulationsofDDTarestilllargely used nowadays [1] to explore the mechanisms involved in DDT. All obstaclesandwallsaretreatedasno-slipadiabaticboundaries.
UsuallyanAdaptiveMeshRefinement(AMR)isusedwhen sim-ulating DDT in large channels. While this strategy is useful to maintain reasonable computational costs, it requires an a priori knowledgeonthekeyingredientsimpactingtheproblem,thereby increasing theresolution intheregions wherethese mechanisms activate.Here,anotherstrategy,basedonmultiplemeshes,isused (seeFig.2). Eachgrid isstepwisehomogeneous andcomposed of two zones:(1)a refined section,4.5Slarge, wherethe resolution isuniform
1x
f ine=20µ
m,therebyallowingtocapturethe defla-gration front (350–450µm thick),the detonationfront (half reac-tionthickness:153µm)aswellastheflowstructures;(2)acoarser grid,startingatleast2S=600mmaheadofthe combustionwave, witha uniformandlargerelement size1x
coarse=120µ
m.WhenFig. 2. Illustration of the interpolation procedure between the different meshes used for the present simulations. The interpolation from mesh to mesh is performed when the flame is separated by a distance of two spacings 2 S from the end of the fine section of the mesh. t Interp (1 → 2) denotes the time when the interpolation, from the first
mesh to the second, is performed.
Fig. 3. Left: One dimensional hydrogen/air laminar flame speed s L at atmospheric conditions for various equivalence ratios φ. (Solid line) 9S18R mechanism [31] ; experi-
mental data: ( ¤) Berman [38] , ( ◦) Dowdy et al. [39] , ( ▽ ) Egolfopoulos and Law [40] , ( △ ) Iijima and Takeno [41] , ( : ) Takahashi et al. [42] . Right: Influence of temperature and chemistry on the induction time τI and the excitation time τE for φ= 1 and P = 1 atm . τI from experiments: ( ¤) Slack and Grillo [43] and ( ◦) Snyder et al. [44] . T 9cS and T 3cS
are the ignition threshold temperatures for the 9S18R and 3S1R mechanisms, respectively.
endoftherefinedsectionreaches2S(Fig.2(b)),apiecewiselinear interpolation of the solution is performedto anothermesh with the same characteristics asthe previous one exceptthat the re-finedsection nowstartsjustbehindtheflametail(Fig.2(c)).This interpolation is performed 3times during the flame propagation in theobstructed region without anynoticeablenumerical noise. Itallowstocorrectlycapturethecombustionwavesaswellasthe flowstructuresfaraheadoftheflame.
Thechannelisfilledwithaquiescentmixtureofhydrogenand air atatmospheric conditions.It is ignitedat theleft closedend usinga semi-spherical5mm radiushot kernel.Thisinitialization procedure was employed in other gas explosion studies ranging from venting deflagrations [12,14] to DDT [1,13]. Among all the equivalence ratios considered in the experiments, the case cor-responding to stoichiometric hydrogen/air andshowing DDTwas selected.
3. Chemistrymodeling
The objective of the present paper is to study the influence ofthe kineticsmodeling onDDT. Todoso, asingle-step reduced chemistry, which is the classical approach for DDT simulations, is confronted to a multi-step mechanism. Besides the chemical scheme,thenumericalsetupisthesameforallsimulations.
3.1. Detailedchemistry
Themulti-stepmechanismchosentomodelhydrogen/air chem-istry isthemechanismderivedby Boivinetal.[31],composed of 9speciesand18irreversiblereactions.Thismechanismisreferred toas9S18Rinthefollowing.9S18Risvalidatedagainst experimen-tal dataforatmospherichydrogen/airlaminarflamespeedssL for
a wide rangeofequivalenceratios
φ
∈[0.4..1.5]inFig.3(left).The mechanism predicts sL withvery good accuracyat stoichiometry,whichcorrespondstothecaseconsideredfortheDDTsimulations presentedinSection4.
3.2. One-stepreducedchemistry
Until very recently,themostcommonapproach inDDT simu-lations hasbeen the use of reduced single-step mechanisms [1]. Themethodologytoderivesuchchemistriesusingonlyone trans-ported species isdetailed in [32]. The same procedure was later used by Wangetal.[33]to derive aone-reaction mechanismfor hydrogen/air flames, takinginto account the reaction order. This strategywas selectedtodevelopthesingle-stepchemistry,named 3S1R,usedinthesimulationspresentedinSection4.
3S1R is designed to reproduce both the flame and the det-onation global features. Two fictive species S1 and S2 are used,
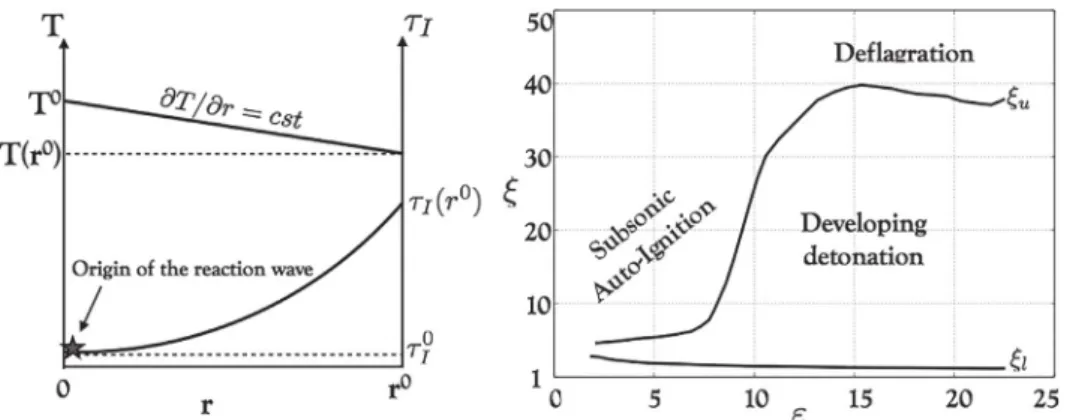
Fig. 4. Left: A sketch of the hot spot (HS) of radius r 0 with constant temperature gradient. The reaction wave emerges from the point of minimum ignition time τ
I . Right:
The ξ−εdiagram shows the detonation peninsula [35] : DDT is possible between the upper branch ξu and the lower branch ξl .
the products. This allows to mimic the hydrogen oxidation re-action. S1 and S2 have the same molecular weight W equal to
the average molecular weight of an hydrogen/air mixture at sto-ichiometry, i.e. W=0.021kg/mol. Therefore Wis constant across theflame.Thereactantssharethesamespecificheatcapacitiesat constant pressure Cp andconstant volumeCv so that thespecific
heat ratio
γ
is constant across the flame front. The Lewis num-ber of the species LeSk is set to unity. The reaction rate of theirreversible reaction is modeled using an Arrhenius formulation: ˙
ω
=A(
ρ
/W)
1.5YS1
(Y
S2)
0.5exp(−Ta/T)
. Theset oftarget parameters are:• The laminar flamespeed sL andthe adiabatic flame
tempera-ture Tb: they allow the reduced mechanismto reproduce the
effectofreactantsconsumptionandgasexpansionontheflame propagationduring theFAphase. sL andTbare imposedequal
totheoneobtainedwiththe9S18Rmechanismat
φ
=1. • TheChapman–JouguetdetonationspeedDCJ andthehalfdeto-nationthickness
δ
dgivenbytheZNDmodelforthedetonationstructure.
δ
d can belinked tothedetonation cellsizeviaem-piricalrelations[1].
To match these targets, a set of parameters can be tuned: the specific heatratio
γ
,the chemicalenergyreleaseQ,the pre-expon ential factor A and activation temperature Ta. Theval-ues
γ
=1.17andQ=43.28RT0/M [J/kg] resultinthedesiredtar-gets: Tb=7.13T0 and DCJ=1993m/s, T0=300K being the fresh
gas temperature and M the mean molar mass of the mixture. Computing the 1D laminar flame in AVBP and the theoretical ZND model using the selected values of
γ
and Q, the chem-ical parameters A and Ta are determined so that sL=2.43m/sand
δ
d=153µ
m. The reaction rate model then readsω
˙ =3.9× 10⁷(
ρ
/W)
1.5YS1
(Y
S2)
0.5exp(−46.36T
0/T
)
kg/m3/s.3.3. Influenceofchemistryonignitioncharacteristictimes
DDT involvesspontaneous ignition.Therefore,the influenceof the chemicalscheme ontheinductiontime
τ
I andtheexcitationtime
τ
Ehastobeinvestigated.τ
Iisdefinedasthetimeforwhichan homogeneous mixturemustbe maintainedatagiven temper-ature andpressure before exothermic reactions activate.After
τ
I,the heat release rapidly blows up and
τ
E is defined asthe timenecessary forthe heat release to go from 5 to 100% of its peak value.
τ
I andτ
E obtainedwith 9S18Rand3S1Rare displayedinFig.3(right)fortemperaturesintherange[600..1400]Kand atmo-spheric pressure(
φ
=1). Theτ
I dependanceon temperatureob-tained withthe 9S18Rmechanismisingoodagreement withthe experimentaldata.TheignitionthresholdTc isdefinedhereasthe
temperature below which the induction time needed before ig-nition ishigher thanthe longesttime scale offlame propagation
intheBR30S300configuration
τ
f=L/sL≈2.2ms.Thismeansthatwhenthe temperatureofthe reactants isbelowTc, anypoint on
the fresh mixture can be burned by the flame before it can ig-nite. The ignition threshold Tc
9S≈950K obtained with the
nine-step scheme agrees reasonablywell with the experimental data. Conversely,theinductiontimesobtainedusingthereduced mech-anismareordersofmagnitudesmallerthantheexperimentaldata, whichcoincides withtheconclusions ofIvanov et al.[3] regard-ing
τ
IobtainedwithreducedchemistriesforstoichiometricH2/O2mixture. Note that, with 3S1R, the mixture can be ignited even forlow temperatures,about300KlowerthanTc
9S.Like
τ
I,τ
Eob-tained with 3S1R are much lower than the ones obtained with 9S18R. Theimpact ofthese findings onDDT willbe discussed in
Section3.4.
Itis importanttonote that even though detailedmechanisms canreproduceaccuratelybothsL and
τ
Iforconditionsofpressurelowerthan3–5bar,theysufferfromalackofcalibrationdatafor thehigherpressureconditionsoftenencounteredduringDDT.This issuehasbeenmentionedbyanumberofinvestigators(see[34]).
3.4.InfluenceofthechemistrymodelingonacanonicDDTproblem Inthissection,acomparisonbetweenthetwochemicalmodels isperformedwithregardtoDDTcausedbytheZeldovich mecha-nism[4].ThelatterhasbeendesignatedbyaseriesofDNS[1]as a sufficient condition for DDT onset. The canonic HS problem, sketchedinFig.4(left)isconsideredinthefollowing.
3.4.1. Thehotspotproblemandthedetonationpeninsula
According to Zeldovich and co-workers, a detonation can emergefrom ahot spot, i.e. a region characterized by a gradient ofinductiontime
∇τ
I[4].Insidethehotspot,acombustionwaveforms at the point of minimum
τ
I. If∇τ
I is too steep, a shockforms and separates from the combustion wave. The latter pro-ceeds as a deflagration. On the other hand, if
∇τ
I is too small,theentirehotspotisigniteduniformly.Foranintermediaterange of
∇τ
I however, acoupling betweenthe shockandthecombus-tionwaveispossible.Apositivefeedbackbetweenthetwowaves eventuallyleadstotheformationofadetonationfront.
BradleyandKalghatgi[35]characterizedthegradientof induc-tiontime
∇τ
I neededtotrigger DDT.Inside thehot spot, bothareactionwaveandacompressionwaveareformed.Toallowa res-onancebetweenbothwaves,thereactionwavevelocityuI=dx/d
τ
Imustneither betoo highnortoolow compared tothe compres-sionwave velocity(soundspeed)a.AcomparisonbetweenuIand
a can be made through the variable
ξ
=a/uI. Forcertain valuesof
ξ
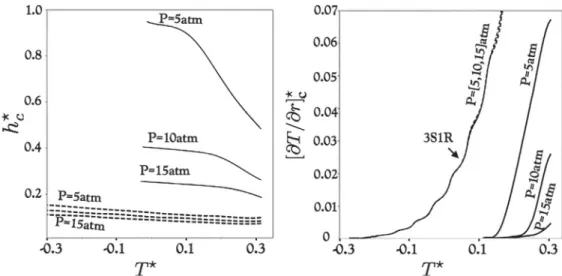
allowing resonance,the compression wave can gain in am-plitude if the heat release inside the reaction wave is depositedFig. 5. The influence of pressure P and temperature T ⋆on critical HS parameters for the single-step (dashed lines) and the multi-step mechanisms (solid lines). Left: h ⋆
c is the
minimum non-dimensional size that allows energy input to pressure waves, i.e. εc = 1 . Right: [ ∂ T /∂ r] ⋆c is the minimum non-dimensional temperature gradient that allows
resonance between pressure and reaction waves, i.e. ξc = 1 .
fast enough. This can be characterized by introducing the vari-able
ε
=r0/(a
τ
E
)
,whereε
measures the chemical energy fed tothepressurepulseduring itsresidenceinsideahotspotofradius r0. A region in the
ξ
−ε
space, called the detonation peninsula[35],hasbeenidentifiedastheregionwheretheconditionsatthe hot spotare idealfortheonset ofdetonation.The regionis illus-tratedinFig.4(right),betweentheupperbranch
ξ
uandthelowerbranch
ξ
l.3.4.2. Theinfluenceofchemistrymodelingonthehotspotscenario In this section, the
ξ
−ε
diagram is used to investigate the outcome of a hot spot using the 9S18R and the 3S1R mecha-nisms. Consider a hot spherical kernel with a constant tempera-ture gradient anda non-dimensional size h⋆=2r0/h, where histhe height of an obstacle inthe BR30hS300 channel (see Fig. 4). The non-dimensional peak temperature inside HS is defined as T⋆=
(T
0−Tc)
/Tc,whereTc istheignitionthreshold.Negativeval-uesofT⋆ indicatetemperatures atwhichthemixture willnot be
ignited.Since the valuesTc obtainedwith 9S18Ragree very well
withtheexperimentaldata,atleastforatmosphericconditions,Tc
issetequaltoTc 9S.
The
ξ
−ε
plane offers two limit lines: (1) the minimum en-ergy inputε
c=1, (2) the perfect resonance between compres-sion and combustion wavesξ
c=1. These limits allow to definecritical hot spot parameters that can trigger DDT: (1) h⋆
c is the
minimum non-dimensional HS size where pressure waves can travel to gain energy, i.e. h⋆
c=2
ε
c(a
τ
E)
/h; (2)ξ
can berefor-mulated [35] as
ξ
=a(
∂
T/∂
r)(∂
τ
I/∂
T)
in the radial coordinates,therebytheminimumHStemperaturegradientthatleadstoa res-onance betweenpressureandreactionwavescanbeexpressedas [
∂
T/∂
r]c=ξ
c/(a
∂
τ
I/∂
T)
. A non dimensional form for [∂
T/∂
r]c isthen [
∂
T/∂
r]⋆c=
(T
0/hc)
[∂
T/∂
r]c, wherehc=h⋆ch.h⋆c and[
∂
T/∂
r]⋆cdependontheconditionsofpressurePandtemperatureT⋆ inside
the hot spot. The influence of P and T⋆ aswell as the chemical
schemeonthecriticalHSparametersisassessedinFig.5.Because
τ
Eismuchhigherforthemulti-stepchemistry,h⋆cvaluesobtainedwith 9S18R are higher than those obtained with 3S1R, indepen-dentlyofthetemperature.Forrelativelylowpressure(p=5atm), thecriticalhotspotsizeishigherthanhalfanobstacleheight (h) andtendstohasthetemperaturebecomesclosetothe tempera-turethreshold.Increasingthepressure leadstoa radicaldecrease of h⋆
c to meet values close to the one obtained withthe
single-step mechanism. Thisimplies that, forthis canonic scenario and
when using detailedhydrogen/airschemes, conditionswhere en-ergy can be fed to pressure waves can only be obtained when strong shocks are involved,resulting indrastic pressure increase. ThisconclusionwasalsoreachedbyIvanovetal.[3]andLiberman et al. [27,28] who computed the hot spotproblem with a more detailed hydrogen/air reaction scheme. Note that, for the single-step mechanism, conditions whereHS can lead toan increase in pressurewavesamplitudecanbemetevenfortemperatureslower thantheignitionthreshold(T⋆<0).Figure5(Right)showsthatfor
the 3S1Rcase,there existsatemperaturegradientforwhichDDT can occurforalargetemperaturerange,andforconditionsbelow the ignition threshold.Increasing the hot spotpeak temperature results in an increase inthe minimum temperature gradient.On the other hand,the multi-stepschemeallows DDTfor high tem-peratures only(≥1100 K). Asthe pressureincreases, theDDT re-giontendstowardshighertemperaturesalsopointingouttheneed forstrongshocks. Notethatthesingle-step mechanismshows al-mostnopressuredependance.
The hot spot problemmayrepresent a simplifiedscenario far fromtherealisticconditionsthatleadtoDDTingasexplosions.In practice, the hot kernel is certainly non-spherical and the distri-bution of the temperaturegradient can be heterogeneous.In ad-dition,reactants mixingcan occur leading toadditionalreactivity gradients. However, Fig. 5suggests that the single-step approach allows DDT to occur forconditionsfar lessrestrictive than those requiredby thedetailedhydrogen/airchemistry.Thelatter,which is validated against experimental data,may not even allow DDT via gradientofreactivityinconfigurationssuchastheBR30hS300 channel, unlessstrongshocks areformed. Furtherinvestigationis neededtoassesstheextentofsuch conclusionstoothermixtures andfuels.
4. NumericalsimulationoftheBR30hS300configuration
4.1. FlamespeedandDDT
Theconclusionsoftheprevioussectionareassessedonamore complexscenarioofDDTinaconfinedandobstructedchannel.The explosion scenario ofthe BR30hS300 [26] iscomputed usingthe single-step andmulti-stepmechanisms.The evolutionofthe non-dimensionalflametipvelocitystip/DCJversustheflametipposition
isdisplayedinFig.6(left).Theflametippositionisdefinedbyc= YH2/YH2,u=0.95forthedetailedchemistryandc=YS1/YS1,u=0.95
Fig. 6. Evolution of the non-dimensional flame tip speed (left) and non-dimensional flame surface (right) with the flame tip position. The gray area represents the experi- mental shots. The vertical bars represent the position of the seven obstacles. a u,0 is the sound speed at the fresh gases for the initial conditions.
Fig. 7. Numerical Schlieren ( ∇ρ/ ρ) and isocontour of progress variable c = 0 . 5 showing the flame interaction with the first obstacle. Left: single-step mechanism. Right: Multi-step mechanism.
for thesingle-step mechanism, where udenotes unburned gases. The numerical simulations correctlycapturethe mainfeatures of theexperiment.Uponignition,theflameundergoesmultiple accel-erations,whicharewellreproducedbybothchemicalmechanisms. This canbe explainedby thefact that 3S1Rand9S18Rsharethe samelaminarflamespeedsLandburntgastemperatureTb,which
allowsagoodpredictionofreactants consumptionandgas expan-sionduringflamepropagation.Inaddition,accordingtoJoulinand Mitani [36] and Sun et al.[37], the effective Lewis number Leeff
oftworeactants flamesdependsonthereactionorder,the equiv-alence ratio andtheLewis numberof thereactants. Leeff reduces tothelewisnumberofthefuel(oxydizer)inthecaseofverylean (rich) flames.Inbetween, agradual evolutionofLeeffisobserved.
At stoichiometry, Leeff is close to unity for hydrogen/air flames, which:(1)depletesthermo-diffusiveinstabilities(confirmedbythe experiment); (2)makes theflamespeedresponsetostretch iden-ticalforbothchemistries.
Beforethefirstobstacle,FAislaminarinnatureandisinduced by the strong channel confinement (high S/H ratio). The latter quickly forces the flame to transition from the spherical to the finger shape with a rapid increase in flame surface as seen in
Fig. 6(right). The obstacles ahead of the flame enhance FA with successive and stronger flame surface increases, until a sharp
increaseinflamespeedisobserved,indicativeofatransitionfrom deflagrationtodetonation.
WhilebothmechanismspredictDDT,itslocationisstrongly im-pactedbykinetics.Nevertheless,DDTwas observedinboth simu-lations justone section either before(9S18R) orafter(3S1R) the onepredictedbytheexperiments.Priorto DDT,both flameshave reachedthefastpropagationregime:stipisequalto0.4DCJ(0.5DCJ)
forthe9S18R(3S1Rrespectively)case. ThevalueDCJ/2isequalto
theCJdeflagration speedandcorrespondstothemaximum defla-grationspeed[16].Figure6showsthat,inthe3S1Rcase,theflame accelerationprocessslowsdown whenthislimitvalue isreached (X∈[1.45,1.75]m). The flame surface also reaches a plateau at thisregime.AftertheabruptDDTprocess,andinaccordancewith experimental data, theflame propagation speed reachesa quasi-steadyvalueclosetothe predictedautonomousdetonationspeed DCJ.The non-dimensional flamesurface Af/Hthen quicklyrelaxes
tounityshowingthataquasi-planardetonationpropagatesinthe channel.
The flame acceleration phase, as a necessary step for creat-ing the appropriate conditions for DDT, is briefly analyzed in
Section4.2.Then,theflowconditionspriortoDDTareinvestigated indetailsinSection4.3todeterminewhethertheingredientsthat leadtodetonationareidenticalforbothchemistries.
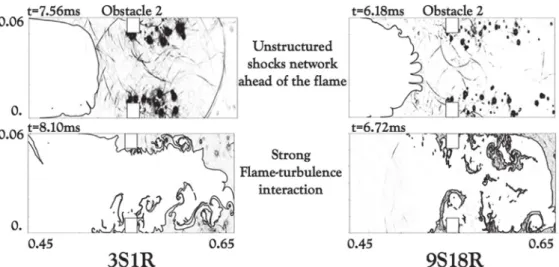
Fig. 8. Numerical Schlieren ( ∇ρ/ ρ) and isocontour of progress variable c = 0 . 5 showing the shocks network formed ahead of the flame. Left: single-step mechanism. Right: Multi-step mechanism.
Fig. 9. Numerical Schlieren ( ∇ρ/ ρ) and isocontour of progress variable c = 0 . 5 showing the highly turbulent flame crossing the third obstacle. RM denotes the Richtmyer– Meshkov (RM) instability. Left: single-step case. Right: multi-step case.
4.2. FAphase
Few microsecondsafterignition,theflame undergoes thefirst accelerationepisodesdueessentially toconfinement(fingerflame
[7]).Startingfromthefirstobstacle,additionalFAmechanismsare triggered. Thefirst one isrelatedto thesudden flowcontraction. The fresh gases, pushed by the reactive piston, are accelerated when they penetrate the congestion. When the flame starts in-teractingwiththeobstacle,thejumpvelocityconditioninduces a sudden increase ofthe flame speed. This mechanism ishowever limited to the vicinity of the obstacle. The FA process continues
downstream of the first congestion because of the flame inter-action withthe flow structures. When thetip of thecombustion wave exits the congestion, the remaining part of the reactive surface journeysin a turbulent flow (where vortex sheddinghas been triggered earlier).Consequently, the flamefront iswrinkled as illustrated in Fig. 7 for both chemistries. Flame vortex inter-actions account for the strong increase of the flame surface just downstream of the congestion observed in Fig. 6(right). Because of the large obstacle spacing to channel height ratio (S/H=5), the contributionofthe congestiontothe flameaccelerationstops a certain distance away fromthe obstacle and the flame surface
Fig. 10. Zoom on the onset of detonation. Pressure field and isocontour of progress variable c = 0 . 5 are displayed. The dashed lines correspond to a cut through which DDT is analyzed in Sections 4.3.1 and 4.3.2 . Left: single-step case. Right: multi-step case.
Fig. 11. Key events surrounding the detonation onset for the 3S1R simulation. Pressure gradient ∇P is displayed. x w represents the distance from the obstacle 6 left wall (grey
dashed area). IS is the incident shock. RS and CW indicate the reflected shock and a compression wave, respectively. HCG stands for Highly Compressed Gas. A detonation wave is triggered at t = 10 . 561 ms and propagates along the obstacle.
drops significantly.This explainsthe repeatedflameacceleration– deceleration phases observed for both chemical mechanisms in
Fig.6.
Contrary to the deflagration-precursor shock structure ob-served insmoothchannels[9,21,25],repeated shockreflectionsat the obstacles result in an unstructured shock network ahead of the flame (Figs. 8 and9). When leavingthe second obstacle,the flame ishighlyturbulent asseenatt=8.10ms (t=6.72ms) for thesingle-step(multi-step)mechanism,respectively.
Shock reflections at the obstacles allow flame-shock interac-tions. This is highlighted in Fig. 9 in the 3S1R case where a Richtmyer–Meshkov(RM) instabilityistriggeredwithalarge fun-nel of unburned material penetrating the region of burnt gases. Thisinstabilityfurthercontributestotheincreaseoftheflame sur-face.Untilthefourthobstacle,FAinbothsimulationsmatches rea-sonably well. The reasonwhyDDT isobserved firstwiththe de-tailed chemistryanddelayedwiththereducedmechanismis dis-cussedinthenextsection.
4.3. DetailedanalysisofDDTonset
The detonation onset location is strongly impacted by the chemistry modelingasshownin Fig.6.There maybe two possi-bleexplanationsforthis:(1)theDDTmechanismisthesamebut
thenecessaryconditionstotriggeritaremetearlierinthe9S18R casethan the 3S1Rcase; (2) the mechanismis differentand in-volves differentingredients to initiate detonation.Afirst step to-wards identifying the key elements responsible for DDT in both simulations istolookat theDDTlocation. Figure10 displays the pressure field when the detonationwave starts to form. In both cases,DDToccursclosetotheobstacles,inregionsofhighly com-pressedgas.Inthe3S1Rcase,DDTstartsintheunreactedmixture aheadofthedeflagrationfront.Ontheother hand,DDTseems to takeplaceeitherintheflamebrushorbetweentheflameandthe wall for the 9S18Rcase. Figure 10 suggests that the deflagration mayplayaroleintheDDTscenariowith9S18R.
Giventhe seemingly particular nature of the DDT scenario in the9S18Rcase,agridindependencestudyhasbeencarriedoutto ensurethatthismechanismisnotinducedbynumericalartefacts. Therefore,thecomputationwasalsoperformedwithanothermesh wherethegridresolutionhasbeenincreasedaroundtheDDT lo-cationshownin Fig.10(Right).This refinedmesh iscomposed of a window 300 mm large andcentered around the DDTlocation. Themesh sizeinthiswindowis 10
µ
m,whichis abouthalf the sizeofthesmallestcellsinthereferencemesh.Detailsonthisgrid independencestudyaregivenintheannexesection.Itshowsthat an identical scenario takes place withthe refined mesh, thereby confirmingthe mechanism.In thefollowing,thedetailedanalysisFig. 12. Key events surrounding the detonation onset for the 9S18R simulation. Pressure gradient ∇P is displayed. x w represents the distance from the obstacle 4 right wall
(gray dashed area). The flame front is represented by the isocontrour of progress variable c = 0 . 5 . IS and RS denote the incident shock and the reflected shock, respectively.
PP is the pressure pulse observed prior to the detonation onset. D and R represent the detonation wave and the retonation wave, respectively.
Fig. 13. Time evolution of pressure (a), temperature (b) and λ= 1 − c (c) in the single-step case through the cut line presented in Fig. 10 (Right), positioned 500µm from the bottom wall. x w is the distance from the obstacle 6 left wall. IS, RS, CS, R and D denote an incident shock, a reflected shock, a compression wave, the retonation wave and
the detonation wave, respectively. HS is a hot spot.
of the DDTevent inthe 9S18R caseis conductedon the refined mesh,sinceitenablesafinerdescriptionofthephenomenon.
Figures 11and 12 focuson the moments surrounding DDTfor the single-step and the multi-step mechanisms, respectively. For the3S1Rcase,anIncidentShock(IS)getsreflectedatthesixth ob-stacle(X=1.744m)andaCompressionWave(CW)isseencoming intheopposite directiontothereflected shock(RS). Thecollision betweenCWandRSleadstotheformationofahighlycompressed andheatedregion(HCG)fromwhichadetonationwaveemergesa fewmicrosecondslater.Adetailedanalysisofthedetonationonset inthiscaseis performedinSection4.3.1.Shock reflection isalso involvedintheDDTprocessinthedetailedchemistrycasebutthe scenarioiscompletelydifferent.Figure 12showsthat,asa conse-quence ofthe reflectedshockcrossing theflame path,aPressure Pulse(PP)formsattheflamefrontandleadstodetonation initia-tioninside theflamebrush.Thisconfirmsthatthe deflagrationis indeed an active participantinthe DDTmechanism observedfor the9S18Rcase.DDTintheflame brushtriggered bythehead-on
collision ofashockwithaflamefrontwas alsoobservedrecently byGoodwinetal.[24].ThisscenarioisanalyzedinSection4.3.2. 4.3.1. Single-stepchemistryandtheZeldovichmechanism
DDTin the3S1Rcasetakesplace intheunreacted mixtureas alreadyobservedinother simulations[1].Thedetonationwaveis initiated behindthereflectedshockobservedinFig.11.To under-stand the effectofthisshockon the gasandits role inthe DDT process,thesimulationisinspectedthroughthecutlinepresented inFig.10(Right),positioned500
µ
mfromthebottomwall.There-sultisdisplayedinFig.13.
ThepropagationofIS,RSandCW,showninFig.11,canbe ob-served in Fig.13(a,b).As a resultofthe incident shockreflection on the obstacle, a pressure andtemperatureincrease can be ob-served behindRS.The lattercaninteractbackwiththeboundary layerandafurtherincreaseoftemperatureisobserveddueto vis-cous heating. A regionof hot unburned gas(T≥750K) can then beobservedattheRStail.Thecollisionofthereflectedshockwith
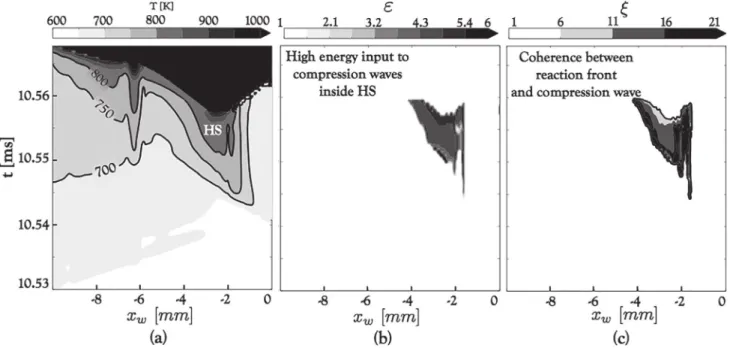
Fig. 14. Time evolution of temperature (a), ε(b) and ξ(c) in the single-step case through the cut line presented in Fig. 10 (Right), positioned 500 µm from the bottom wall.
xw is the distance from the obstacle 6 left wall. IS, RS, CS, R and D denote an incident shock, a reflected shock, a compression wave, the retonation wave and the detonation
wave, respectively. HS is a hot spot.
Fig. 15. Temporal evolution of key parameters integrated along the control volume (CV) shown on the right figure: (Left) Temperature, pressure and density; (Right) Chemical energy release rate and sensible energy release rate. S1 − 4 mark a series of four consecutive shock compressions. D marks the moment the mixture detonates.
acompressionwavepropagatingintheoppositedirectionleadsto theformationofaregionofhot(T≥800K)andhighlycompressed (P≥35bar)unburnedreactantscalledHotSpot(HS).Adetonation wave clearly emerges from HS as a strong shock(see Fig. 13(a)) propagates away from HS, coupled to a reaction wave suggested by the formation ofcombustion products behindit in Fig. 13(c). Aretonation wavecanbe observedinFig.13(a)asaresultofthe reflection ofthe detonationfront onthe obstacle. Theconditions inpressureandtemperatureobservedinsideHSarecausedbythe strongleadingshock(IS)reflectingoff thewall.Thisexplainswhy DDTwasdelayeduntilthesixthobstacleinthiscase,allowingthe leadingshocktogaininstrengthwhiletheflamepropagatesinthe channel.
To understand why a detonation wave emerges from the hot spot,theevolutionofthevariables
ε
andξ
isdisplayedinFig.14. The formationofthehot unburnedregion HScoincides with val-ues ofε
higherthat unity. Thismeansthat inHS, acompression wave can formandgain inamplitudeasits residencetimeinHSishigherthan the time neededlocallyforthe mixtureto deliver chemicalenergy.Ontheotherhand,inthehotspot,forT≤800K, high values of
ξ
are met, since the gradient∂
τ
I/∂
T is high forlowvaluesoftemperature. TheincreaseintemperatureinsideHS leadstohighervaluesofenergyinputtopressurewaves
ε
≥5just prior to DDT and lower values ofξ
. This means that the evolu-tionofHSwastowardshighenergytransmissiontopressurewaves (ε
ր)andresonancebetweenthelatterandthereactionfrontsthat emerge fromHS (ξ
→1+). The initiationof the detonationwaveinthe case3S1Risthereforethe resultofthe classicalZeldovich mechanism.
Notethat the temperatureconditions metinside the hot spot are not high enough to initiate a detonation via the Zeldovich mechanismifthemulti-stepmechanismwasusedinstead.Indeed, theflame residencetimeinside an obstructedsection can be de-fined as
τ
f=S/(D
CJ/2)
≈300µ
s. Therefore, to allow ignition attheseconditionsin pressure (i.e.
τ
I≤τ
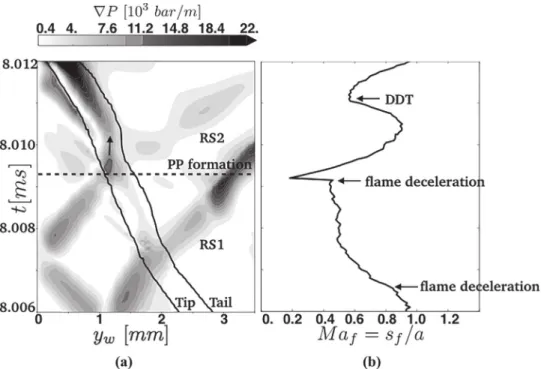
f), theminimumFig. 16. (a) Temporal evolution of the pressure gradient for the multi-step case through the cut line presented in Fig. 10 (Left). y w is the distance to the bottom wall. RS 1
and RS 2 are two reflected shocks. D denote the detonation wave. The black contours indicate the flame tip and tail. (b) Local flame Mach number Ma f . s f is the propagation
speed of the closest point on the flame front to the bottom wall.
haverequiredamuchstrongershockISthantheoneobservedin the3S1Rsimulation.
4.3.2. Detailedchemistryandpressurepulseamplification
Similarly to what was done by Goodwin et. al.[24],who ob-served seemingly the same mechanism as the one shown here for the 9S18Rcase, a control volume analysis isperformed on a (50µm×50µm)region(CV)showninFig.15.Thisallows totrack theevolutionofstatevariablesduringDDT.Theanalysiscoversthe whole set ofevents fromthe arrival of the incident shock(IS in
Fig.12)totheemergenceofthedetonationfront.
Figure 15(left) shows that the material first goes through a series of shock compressions (induced by shocks S1–S4) that drastically increases the pressure and the density of the mate-rial. IS reflects back and forth between the flame front and the wall, which induces these consecutiveshock compressions. Later (att≈8.011ms),asthematerialdetonates,themixturestarts re-actingchemicallywhilepressureincreases.
Theimpactoftheseshockcompressionsonthemixtureahead oftheflamecanalsobeassessedlookingattherateofenergy de-positioninthecontrolvolume(CV)(Fig.15(right)).Thefourshock compressions induceaseriesofrapidsensibleenergydepositions intheunburntmixture,priortoDDT.Later,whenthematerial det-onates,afifthpeakofsensibleenergydepositionisobserved,along witha rapidchemicalenergyrelease. As theflow carriesout en-ergybehindthedetonation,negativeenergyratesareobserved.
The results of this control volume analysis are in very good agreement withthe one performedby Goodwin et. al.[24], who used a single-step mechanism. Thisshowsthat DDT triggered by thereflexionbackandforthofashockbetweenaflamefrontand awallisnotsolelyobservedwhendetailedchemistryisused.
Figure 15(left) also indicates that the temperatureof the un-burntmaterial increasesduring the shockcompressions,to reach temperatures slightly higher than 750K. This temperature, how-ever, is not sufficient to trigger DDT in the unreacted material. Indeed,9S18Rpredictsthat
τ
I≈50msatthepressureandtemper-atureconditionsaheadoftheflame.Whentheflameexitsobstacle
Fig. 17. The meshes used to perform the grid independence study in the multi-step chemistry case. (Top) Reference mesh, used in the core of the manuscript, where the smallest cell size is 20 µm. (Bottom) A new mesh with a higher resolution win- dow, 300 mm large, centered around the DDT location (just after obstacle 4) and where the cell size is 10 µm.
4,itapproachestheendwallat500m/sanddeceleratesto100m/s prior totheemergenceofthedetonation(seeFig.16(right)).This lower bound fortheflamespeed (i.e.100m/s) allows toevaluate ahigherboundforthetimeneededbytheflametoreachtheend wall h/100≈100
µ
s, which is two orders of magnitude smaller thanτ
I atthefreshgases. Thisdefinitely rules out theZeldovichmechanismaheadoftheflame.
Theimpactofshockcompressionisnotlimitedtotheunburnt material ahead of the flame but also extends to the flame front itself. This can be assessed using a procedure similar to the one presentedinSection4.3.1.Thescenarioisinvestigatedthroughthe cut lineshownin Fig.10(Left). Figure16 showsthatthe head-on collision of the reflected shocks (RS1 and RS2) slows down the flame due to a back-flow offresh gases, the second deceleration being much more pronounced. The flame thus propagates in a continually compressed material with decreasing speed, which triggers an explosion in the only region where the temperature is highenough: the flamepreheat zone. A pressurepulse(PP) is
Fig. 18. Zoom on the onset of detonation. Pressure field and isocontour of progress variable c = 0 . 5 are displayed. The dashed lines correspond to a cut through which DDT is analyzed in the core of the manuscript. (Left) Reference mesh. (Right) Refined mesh.
Fig. 19. Key events surrounding the detonation onset for the multi-step simulation using the reference mesh (top) and the refined mesh (bottom). The pressure gradient is displayed. x w represents the distance from the obstacle 4 right wall (gray dashed area). The deflagration front is represented by the isocontrour of progress variable c = 0 . 5 .
IS and RS denote the incident shock and the reflected shock, respectively. PP is the pressure pulse observed inside the flame brush prior the detonation onset. D and R indicate the detonation and the retonation waves, respectively.
then observed att≈8.009 ms insidethe flamepreheat zone. PP gainsinamplitudeaschemicalenergyisreleasedinsidetheflame beforeadetonationemergesfromtheflamebrush.
The DDT mechanism observed in the 9S18R case can finally be summarizedasfollows:(1)anincidentshockgetstrapped be-tween theflamefrontandawall;(2)thisshockreflectsbackand forth betweenthereactive waveandtheboundarywhichleadsto a series ofrapid sensibleenergy depositionsin theunburnt ma-terial; (3)the flamethus propagates ina continuallycompressed mixtureandapressurepulseformsinsidetheflamepreheatzone, wheretemperaturesarehighenoughtotriggeranexplosion;(4)a transitionto detonationis observedinsidethe flamebrushwhen the flamereachesthe vicinityof thewall throughpressure pulse amplification(aformoftheSWACERmechanism[16]).
5. Conclusion
The influence of chemistry modeling on the intricate Defla-gration to Detonation Transition (DDT) problem is investigated through two chemical mechanisms: (1) a single-step mechanism (3S1R)designedtoreproducethekeyfeatures offlameand deto-nationpropagation;(2)amulti-stepmechanism(9S18R)validated againstexperimentaldataintermsofflamespeedforalargerange of equivalence ratios andin terms of ignition delays for a large rangeoftemperature.
Firsttheidealizedhotspotproblemwithconstanttemperature gradientisconsidered. Therequirementsin termsoftemperature and radius for a hot spot to trigger DDT are assessed based on the Bradley et al. [35,45,46] analysis. Results show that the
Fig. 20. Time evolution of the pressure gradient in the multi-steps case through the cut line presented in Fig. 10 (right). y w represents the distance to the bottom wall. RS,
RS1 and RS2 indicate three reflected shocks and PP denote a pressure pulse. (a) Reference mesh. (b) Refined mesh.
single-stepapproachcanleadtodetonationonsetfromahotspot forconditionsoftemperaturemuchlowerthattheignition thresh-oldobtainedfromtheexperimentaldata.Ontheotherhand,with 9S18R,thehotspotsizesrequiredforpressurewaveamplification by chemical energy input are much higher than those obtained with 3S1R for relatively low pressure conditions, and become comparable at high pressure. This finding suggests that when using a detailed mechanism, the necessary conditions to allow detonationinitiationviagradientofreactivitycanhardlybemetas longasstrongshocksarenotformed.Thisistrueforhydrogen/air combustion,furtherstudieshoweverareneededtoinvestigatethe extentofsuchaconclusiontoother fuelsandmixtures.Onemust keep inmind howeverthat evendetailedmechanisms maysuffer from large uncertainties at conditions relevant to DDT (i.e. high pressure)duetoalackofcalibrationdataattheseconditions.This addshurdlestoanalreadycomplexproblem.
The DDT problem was also studied through a more realis-tic configuration: the DDT experiment of the Gravent database
[26] where a gas explosion propagates in a confined and ob-structedchannelfilledwithastoichiometrichydrogen/airmixture. Shock reflections were found to be the common ingredient for DDT forall simulations. However, agreat influence ofthe chem-istry modeling on the DDT process was observed. In the 3S1R case,thedetonationwaveemergesfromaregionofunreacted ma-teriel characterized by a gradient of reactivity, consistently with theBradley etal.[35,45,46]
ε
−ξ
analysis. Highenergyinputand resonance between reactionwave andcompression wave are re-quiredtotriggeradetonation.Ontheotherhand,thetransitionto detonationis foundto betriggered insidethe flamebrushinthe 9S18R case. An incident shock, trapped between the flame front and a wall, reflects back andforth between thesetwo interfaces leading to repeated sensible energy depositions. The flame thus propagates in a continually compressed mixture, which leads to the formationof a pressure pulseinside theflame preheat zone, wherethetemperatureishighenoughtotriggeranexplosion.An amplificationprocess istheninitiated insidetheflamefront.DDT isthereforeattributedtotheresonancebetweenthepressurepulseandtheflamebrushandtothehighchemicalenergyreleaseinside the flamefront.Therearereasonstobelieve thatthismechanism might bemorefrequent whenhydrogen/aircomplexchemistryis consideredsincethenecessaryconditionsforahotspottoleadto detonation wave formation maybe difficultto meet when using detailedchemistry.
Acknowledgments
The authors would like to thank the reviewersfor their con-structive remarks and precisions about the complex DDT mech-anism. This work is supported by Total company and the assis-tance ofDr.L.Hoorelbeke, P. Ricoux andA.Dutertreis gratefully acknowledged. The authors acknowledge the PRACE systems for the HPCresourcesawarded duringthe 14thPRACEcallunderthe allocationproject2016153532.
Annex:Gridindependancestudyforthe9S18Rcase
To assess the influence of the mesh resolution on the DDT mechanism that appears in the 9S18Rcase, a grid independence study has beenperformed using a refined mesh, wherethe grid resolution hasbeen increasedaround thelocation ofDDT shown inFig.10.Theobjectivehereisnottoanalysetheinfluenceofthe mesh resolutiononthewholeexplosionscenariobutonlyonthe DDT process.The refinedmesh,shownin Fig.17,iscomposed of a window, 300 mm large andcentred around the DDT location, where themeshsize is10
µ
m(i.e. halfthemeshsize intheref-erence mesh). Thisway both theflame andthe flow ahead ofit benefitfromanincreasedgridresolution.
The DDTlocation isnot impactedbytheincrease ingrid reso-lution asillustrated inFig.18.Figure 19presentsa closerlookat the key eventssurrounding the DDT process for both meshes. It showsthat,eventhoughtheflowisnotexactlythesame,the sce-narios takingplaceusingbothmeshesseem tobe identical.Note that the pressure pulseis also observed usingthe refined mesh, hintingthatitsformationisnotduetoflameunderresolution.
Finally, a similar analysisas the one shown in Fig. 16 is also performedonbothmeshesanddisplayedinFig.20.Itshowsthat the DDT mechanismin the multi-stepcase does not seem to be impactedbytheincreaseinthegridresolution.Alltheingredients includingthereflectedshockandthepressurepulseformationare observedinbothsimulations.
References
[1] E.S. Oran , V.N. Gamezo , Origins of the deflagration-to-detonation transition in gas-phase combustion, Combust. Flame 148 (2007) 4–47 .
[2] M. Liberman , M. Ivanov , A. Kiverin , M. Kuznetsov , A. Chukalovsky , T. Rakhi- mova , Deflagration-to-detonation transition in highly reactive combustible mixtures, Acta Astronaut. 67 (2010) 688–701 .
[3] M. Ivanov , A. Kiverin , M. Liberman , Flame acceleration and DDT of hydro- gen–oxygen gaseous mixtures in channels with no-slip walls, Int. J. Hydrog. Energy 36 (2011) 7714–7727 .
[4] Y. Zel’dovich , V. Librovich , G. Makhviladze , G. Sivashinsky , On the development of detonation in a non-uniformly preheated gas, Acta Astronaut. 15 (1970) 313–321 .
[5] G. Ciccarelli , S. Dorofeev , Flame acceleration and transition to detonation in ducts, Prog. Energy Comb. Sci. 34 (2008) 499–550 .
[6] D.M. Valiev , V. Bychkov , V. Akkerman , L.-E. Eriksson , Different stages of flame acceleration from slow burning to Chapman–Jouguet deflagration, Phys. Rev. E 80 (2009) .
[7] D.M. Valiev , V. Akkerman , M. Kuznetsov , L.-E. Eriksson , C.K. Law , V. Bychkov , Influence of gas compression on flame acceleration in the early stage of burn- ing in tubes, Combust. Flame 160 (2013) 97–111 .
[8] O.J. Ugarte , V. Bychkov , J. Sadek , D. Valiev , V. Akkerman ,Critical role of block- age ratio for flame acceleration in channels with tightly spaced obstacles, Phys. Fluids 28 (2016) 093602 .
[9] A. Oppenheim , Gasdynamic analysis of the development of gaseous detonation and its hydraulic analogy, Symp. (Int.) Combust. 4 (1953) 471–480 .
[10] G. Adams , D. Pack , Some observations on the problem of transition between deflagration and detonation, Symp. (Int.) Combust. 7 (1958) 812–819 .
[11]Y. Troshin , The generalized Hugoniot adiabatic curve, Symp. (Int.) Combust. 7 (1958) 789–798 .
[12] P. Quillatre , O. Vermorel , T. Poinsot , P. Ricoux , Large eddy simulation of vented deflagration, Indus. Eng. Chem. Res. 52 (2013) 11414–11423 .
[13] L. Boeck , S. Lapointe , J. Melguizo-Gavilanes , G. Ciccarelli , Flame propagation across an obstacle: OH-PLIF and 2-d simulations with detailed chemistry, Proc. Combust. Inst. 36 (2017) 2799–2806 .
[14] O. Vermorel , P. Quillatre , T. Poinsot , LES of explosions in venting chamber: A test case for premixed turbulent combustion models, Combust. Flame 183 (2017) 207–223 .
[15] P. Clavin , G. Searby , Combustion waves and fronts in flows, Cambridge Univer- sity Press, United Kingdom, 2016 .
[16] J.H.S. Lee , The detonation phenomenon, Cambridge University Press, New York, NY, 2008 .
[17]R. Zipf , V. Gamezo , M. Sapko , W. Marchewka , K. Mohamed , E. Oran , D. Kessler , E. Weiss , J. Addis , F. Karnack , D. Sellers , Methane–air detonation experiments at NIOSH lake Lynn laboratory, J. Loss Prev. Process Indus. 26 (2013) 295–301 .
[18] J.H.S. Lee , A.J. Higgins , Comments on criteria for direct initiation of detonation, Phil. Trans. R. Soc. Lond. 357 (1999) 3503–3521 .
[19] B. Zhang , H.D. Ng , J.H.S. Lee , Measurement of effective blast energy for direct initiation of spherical gaseous detonations from high-voltage spark discharge, Shock Waves 22 (2012) 1–7 .
[20]B. Zhang , H.D. Ng , J.H. Lee , Measurement and relationship between critical tube diameter and critical energy for direct blast initiation of gaseous deto- nations, J. Loss Prev. Process Indus. 26 (2013) 1293–1299 .
[21]P.A . Urtiew , A .K. Oppenheim , Experimental observations of the transition to detonation in an explosive gas, Proc. of the R. Soc. A 295 (1966) 13–28 .
[22]J. Lee , R. Knystautas , N. Yoshikawa , Photochemical initiation of gaseous deto- nations, Acta Astronaut. 5 (1978) 971–982 .
[23]T. Zhang , W. Sun , Y. Ju , Multi-scale modeling of detonation formation with concentration and temperature gradients in n-heptane/air mixtures, Proc. Combust. Inst. 36 (2017) 1539–1547 .
[24]G. Goodwin , R. Houim , E. Oran ,Effect of decreasing blockage ratio on DDT in small channels with obstacles, Combust. Flame 173 (2016) 16–26 .
[25]M. Kuznetsov , M. Liberman , I. Matsukov , Experimental study of the preheat zone formation and deflagration to detonation transition, Combust. Sci. Tech- nol. 182 (2010) 1628–1644 .
[26]K.G. Vollmer , F. Ettner , T. Sattelmayer , Deflagration-to-detonation transition in hydrogen/air mixtures with a concentration gradient, Combust. Sci. Technol. 184 (2012) 1903–1915 .
[27]M. Liberman , A. Kiverin , M. Ivanov , On detonation initiation by a tempera- ture gradient for a detailed chemical reaction models, Phys. Lett. A 375 (2011) 1803–1808 .
[28]M.A . Liberman , A .D. Kiverin , M.F. Ivanov , Regimes of chemical reaction waves initiated by nonuniform initial conditions for detailed chemical reaction mod- els, Phys. Rev. E 85 (2012) 056312 .
[29]L. Gicquel , G. Staffelbach , T. Poinsot , Large eddy simulations of gaseous flames in gas turbine combustion chambers, Prog. Energy Comb. Sci. 38 (2012) 782–817 .
[30]O. Colin , M. Rudgyard , Development of high-order Taylor–Galerkin schemes for unsteady calculations, J. Comput. Phys. 162 (20 0 0) 338–371 .
[31] P. Boivin , C. Jiménez , A. Sánchez , F. Williams , An explicit reduced mechanism for H 2 -air combustion, Proc. Combust. Inst. 33 (2011) 517–523 .
[32]D. Kessler , V. Gamezo , E. Oran , Simulations of flame acceleration and defla- gration-to-detonation transitions in methane–air systems, Combust. Flame 157 (2010) 2063–2077 .
[33]C. Wang , J. Wen , S. Lu , J. Guo , Single-step chemistry model and transport co- efficient model for hydrogen combustion, Sci. Chin. Technol. Sci. 55 (2012) 2163–2168 .
[34]E.S. Oran , Understanding explosions from catastrophic accidents to creation of the universe, Proc. Combust. Inst. 35 (2015) 1–35 .
[35]D. Bradley , G. Kalghatgi , Influence of autoignition delay time characteristics of different fuels on pressure waves and knock in reciprocating engines, Combust. Flame 156 (2009) 2307–2318 .
[36]G. Joulin , T. Mitani , Linear stability analysis of two-reactant flames, Combust. Flame 40 (1981) 235–246 .
[37]C. Sun , C. Sung , L. He , C. Law , Dynamics of weakly stretched flames: quanti- tative description and extraction of global flame parameters, Combust. Flame 118 (1999) 108–128 .
[38] M. Berman, Sandia Laboratories Report SAND84-0689, Technical Report, Sandia National Laboratories, Albuquerque, New Mexico (1984).
[39]D.R. Dowdy , D.B. Smith , S.C. Taylor , A. Williams , The use of expanding spheri- cal flames to determine burning velocities and stretch effects in hydrogen/air mixtures, Symp. (Int.) Combust. 23 (1991) 325–332 .
[40]F. Egolfopoulos , C. Law , An experimental and computational study of the burn- ing rates of ultra-lean to moderately-rich H 2 /O 2 /N 2 laminar flames with pres-
sure variations, Symp. (Int.) Combust. 23 (1991) 333–340 .
[41]T. Iijima , T. Takeno , Effects of temperature and pressure on burning velocity, Combust. Flame 65 (1986) 35–43 .
[42] F. Takahashi, M. Mizomoto, S. Ikai, Alternative energy sources III, in: Nuclear Energy/Synthetic Fuels, T. Nejat Veziroglu, 5 (1983) 447–457.
[43]M. Slack , A. Grillo , Investigation of hydrogen-air ignition sensitized by nitric oxide and by nitrogen dioxide, Technical Report RE-537, Grumman Research Department, 1977 .
[44]A.D. Snyder , J. Robertson , D.L. Zanders , G.B. Skinner , Shock tube studies of fu- el-air ignition characteristics, Technical Report, Air Force Aero Propulsion Lab- oratory (AFAPL) Research and Technology Division, 1965 .
[45]L. Bates , D. Bradley , G. Paczko , N. Peters , Engine hot spots: Modes of auto-ignition and reaction propagation, Combust. Flame 166 (2016) 80– 85 .
[46]L. Bates , D. Bradley , Deflagrative, auto-ignitive, and detonative propagation regimes in engines, Combust. Flame 175 (2017) 118–122 .
![Fig. 1. Sketch of the Gravent explosion channel geometry [26] . A series of 7 obstacles are evenly placed at the top and bottom plates of the channel](https://thumb-eu.123doks.com/thumbv2/123doknet/14407523.511072/4.892.163.720.119.264/sketch-gravent-explosion-channel-geometry-series-obstacles-channel.webp)