TRPM7 kinase activity is essential for T cell
colonization and alloreactivity in the gut
Andrea Romagnani
1,2
, Valentina Vettore
3
, Tanja Rezzonico-Jost
1
, Sarah Hampe
3
, Elsa Rottoli
4
, Wiebke Nadolni
3
,
Michela Perotti
1
, Melanie A. Meier
3
, Constanze Hermanns
3
, Sheila Geiger
3
, Gunther Wennemuth
5
,
Camilla Recordati
6
, Masayuki Matsushita
7
, Susanne Muehlich
3
, Michele Proietti
1,9
, Vladimir Chubanov
3
,
Thomas Gudermann
3
, Fabio Grassi
1,4,8
& Susanna Zierler
3
The melastatin-like transient-receptor-potential-7 protein (TRPM7), harbouring a cation
channel and a serine/threonine kinase, has been implicated in thymopoiesis and cytokine
expression. Here we show, by analysing TRPM7 kinase-dead mutant (Trpm7
R/R) mice, that
the enzymatic activity of the receptor is not essential for thymopoiesis, but is required for
CD103 transcription and gut-homing of intra-epithelial lymphocytes. Defective T cell gut
colonization reduces MHCII expression in intestinal epithelial cells. Mechanistically, TRPM7
kinase activity controls TGF-
β-induced CD103 expression and pro-inflammatory T helper 17,
but not regulatory T, cell differentiation by modulating SMAD2. Notably, we
find that the
TRPM7 kinase activity promotes gut colonization by alloreactive T cells in acute
graft-versus-host disease. Thus, our results unravel a function of TRPM7 kinase in T cell activity and
suggest a therapeutic potential of kinase inhibitors in averting acute graft-versus-host
disease.
DOI: 10.1038/s41467-017-01960-z
OPEN
1Institute for Research in Biomedicine, Università della Svizzera Italiana, Via Vincenzo Vela 6, CH-6500 Bellinzona, Switzerland.2Graduate School for
Cellular and Biomedical Sciences, University of Bern, c/o Theodor Kocher Institute, Freiestrasse 1, P.O. Box 938, CH-3000 Bern 9, Switzerland.3Walther
Straub Institute of Pharmacology and Toxicology, Ludwig-Maximilians Universität München, Goethestrasse 33, 80336 Munich, Germany.4Department of
Medical Biotechnology and Translational Medicine (BIOMETRA), Università degli Studi di Milano, Via G.B. Viotti 3/5, 20133 Milan, Italy.5Institute for
Anatomy, Universitätsklinikum Essen, Hufelandstrasse 55, 45147 Essen, Germany.6Filarete Foundation, Viale Ortles 22/4, 20139 Milan, Italy.7Department
of Molecular and Cellular Physiology, Graduate School of Medicine, University of the Ryukyus, 207 Uehara, Okinawa 903-0215, Japan.8Istituto Nazionale
Genetica Molecolare“Romeo ed Enrica Invernizzi”, Via Francesco Sforza, 35-20122 Milan, Italy.9Present address: Center for Chronic Immunode
ficiency, Universitätsklinikum Freiburg, Breisacher Street 115, 79106 Freiburg, Germany. Correspondence and requests for materials should be addressed to
F.G. (email:[email protected]) or to S.Z. (email:[email protected])
123456789
T
he antigen-rich environment of the gut interrelates with a
highly specialized mucosal immune system, mastering the
challenge of preventing invasion and systemic spread of
microbes while avoiding unnecessary immune reactions to
commensal bacteria. Besides representing a physical barrier, the
intestinal epithelium constitutes also a dynamic interface between
the host immune system and the luminal environment, which
harbours potentially harmful microbes. Therefore, maintenance
of the protective barrier is essential in mucosal immunity, and
intra-epithelial lymphocytes (IEL) have an important function in
maintaining this barrier function
1. The intestinal mucosa is
composed of a single layer of columnar epithelial cells, the
underlying lamina propria and the muscularis mucosa. Tight
junctions, components of the apical junctional complex, seal the
paracellular space between epithelial cells. IELs are located above
the basement membrane, but are subjacent to tight junctions. The
lamina propria is located beneath the basement membrane and
contains immune cells, including macrophages, dendritic cells
and lamina propria lymphocytes (LPL)
2. Intestinal T cells are
highly heterogeneous in phenotype and function and include
both conventional and unconventional subpopulations.
Conven-tional mucosal T cells express the
αβ T cell receptor (TCRαβ)
together with CD4 or CD8αβ as co-receptors, whereas
uncon-ventional mucosal T cells express either TCRαβ or TCRγδ
toge-ther with CD8αα homodimers
1. During their activation in
specialized mesenteric lymph nodes or Peyer’s patches, naive
T cells acquire gut-homing properties through the upregulation of
distinct adhesion receptors including the integrins
α
4β
7and
α
Eβ
7(CD103)
3, 4. Moreover, the resident microbiota regulates the
development of specific lymphocyte subsets in the gut. CD4
+T
helper 17 (T
H17) cells preferentially accumulate in the intestine,
indicating a developmental regulation by gut-intrinsic
mechan-isms
5. Forkhead box P3 (FoxP3) expressing regulatory T (T
reg)
cells represent another CD4
+T helper (T
H) cell subset that
pre-ferentially accumulates in the intestine and contributes to gut
homoeostasis. The regulated induction of pro-inflammatory T
H17
and immunosuppressive T
regcells in the gut illustrates the
importance of an equilibrium between effective immunity and
tolerance to preserve tissue integrity
1. However, the mechanisms
responsible for this physiologic balance are not well understood.
The induction of both these T
Hsubsets depends on TGF-β, which
is abundantly present in the intestine
6,7.
Among the mammalian transient receptor potential (TRP)
superfamily of unselective cation channels, the TRPM subfamily,
named after its founding member melastatin, TRPM1
8, comprises
eight members including the dual-function protein, TRPM7.
TRPM7 is a divalent selective cation channel, mainly conducting
Mg
2+, Ca
2+and Zn
2+, fused to a C-terminal
α-kinase domain
9,10.
TRPM7 has been implicated in cell survival, proliferation,
apoptosis as well as migration and immune cell function.
How-ever, the physiologic function of TRPM7 ion channel or
enzy-matic activity is poorly understood
11, 12. Unlike conventional
kinases, TRPM7 kinase does not recognize known specific amino
acid motifs but phosphorylates serines (Ser) and threonines (Thr)
located within alpha-helices
10. TRPM7 contains a Ser/Thr-rich
autophosphorylation site, which aids in TRPM7-substrate
bind-ing
13. In vitro, TRPM7 kinase phosphorylates annexin A1
10,14,
myosin II isoforms
15, eEF2-k
16and PLCγ2
17.
Deletion of the ubiquitously expressed TRPM7 protein is
embryonic lethal
18, 19. Deletion of the exons encoding only the
TRPM7 kinase domain (Trpm7
ΔK/ΔK) also causes early embryonic
death, most probably attributable to reduced channel function in
this mutant
19. However, heterozygous mice (Trpm7
+/ΔK) are viable
and develop severe hypo-magnesaemia upon Mg
2+restriction,
causing increased mortality, susceptibility to seizures and prevalence
for allergic hypersensitivity
19. Interestingly, homozygous mice with
genetic inactivation of TRPM7 kinase activity by a point mutation
within the active site of the kinase (K1646R, Trpm7
R/R) have no
obvious phenotype
20,21, indicating that the Trpm7
+/ΔKphenotype,
is due to decrease in both channel and kinase activity. Moreover,
analysis of these mouse models revealed that TRPM7 kinase activity
regulates mast cell degranulation and histamine release, implicating
TRPM7 in the hyper-allergic phenotype observed previously
22.
Tissue-specific deletion of Trpm7 in the T cell lineage disrupts
thymopoiesis and results in altered chemokine and cytokine
expression profiles
18, indicating that TRPM7 channel and/or kinase
are important for T cell function.
Here we show that the ubiquitous kinase-dead mouse model,
Trpm7
R/R, with a single point mutation at the active site of the
kinase
21has an exquisite requirement for TRPM7 kinase activity
in intra-epithelial T cell homoeostasis. We
find that gut
coloni-zation by alloreactive T cells in acute graft-versus-host disease
depends on TRPM7 kinase activity, indicating a therapeutic
potential of kinase inhibitors in averting this condition.
Results
TRPM7 kinase does not affect channel activity. To investigate
the impact of the TRPM7 kinase on T cell function, we utilized a
mouse model carrying a point mutation at the active site of the
enzyme
21. Mutating lysine at position 1646 to arginine (Trpm7
R/R)
disrupts ATP binding and thereby kinase activity (Supplementary
Fig.
1
a)
21. Using immunoprecipitation and western blot analysis,
we were able to confirm that the mutation indeed disrupted native
kinase activity and thus autophosphorylation at serine 1511 in
primary splenocytes (Supplementary Fig.
1
b). Unlike mice lacking
the entire kinase domain
19, homozygous Trpm7
R/Rmice are
viable
20, 21. They are normal in size, weight and Mendelian
inheritance ratio compared to wild-type (WT
)20,21. To test
whe-ther inactivation of TRPM7 kinase has any effect on Mg
2+and Ca
2 +homoeostasis, we used inductively coupled mass spectrometry
(ICP-MS), biochemical as well as calcium-imaging techniques. By
ICP-MS, we observed no changes in serum Mg
2+and Ca
2+con-centrations (Supplementary Fig.
1
c, d). Cellular ATP levels are
often taken as an estimate for intracellular Mg
2+contents
23.
Therefore, we performed a luciferin luciferase assay and found no
alterations in intracellular ATP levels between WT and Trpm7
R/Rprimary naive CD4
+T cells (Supplementary Fig.
1
e). To
deter-mine basal intracellular free Ca
2+concentrations ([Ca
2+]
i), we
used ratiometric Fura-Red imaging. No significant differences in
[Ca
2+]
ibetween WT and Trpm7
R/Rprimary naive CD4
+T cells
were detected (Supplementary Fig.
1
f). Further, we assessed the
potential function of kinase activity in the regulation of
biophy-sical features of the TRPM7 channel. Whole-cell patch-clamp
experiments revealed that the channel function is unaltered in
primary peritoneal mast cells (Supplementary Fig.
1
g, h) as well as
in naive CD4
+T cells (Supplementary Fig.
1
j), which is in line
with previous reports on peritoneal macrophages and mast cells,
as well as embryonic
fibroblasts isolated from Trpm7
R/Rmice
20–22.
Trpm7
R/Rchannels display slightly decreased Mg
2+-sensitivity
without obvious consequences for the channel activity at
physio-logic Mg
2+levels (Supplementary Fig.
1
i). As already shown,
serum Mg
2+and Ca
2+concentrations were unaffected
(Supple-mentary Fig.
1
c, d)
21. This overall constellation allowed us to
independently investigate TRPM7 kinase function.
TRPM7 kinase affects serum cytokines but not thymopoiesis.
Tissue-specific deletion of Trpm7 in the T cell lineage was shown
to disrupt thymopoiesis and resulted in altered chemokine and
cytokine expression profiles
18, indicating that TRPM7 channel
and/or kinase are important in T cell development. Our TRPM7
kinase-dead mouse model, Trpm7
R/R, allows us to specifically
address the function of TRPM7 kinase activity in T cells. The total
numbers of thymocytes, as well as the percentages of
double-negative (DN, CD4
−CD8
−), double-positive (DP, CD4
+CD8
+)
and single-positive (SP, CD4
+CD8
−, CD4
−CD8
+) thymocytes
were similar in both genotypes (Fig.
1
a–c). Tissue-specific
dele-tion of Trpm7 in the T cell linage affected thymopoiesis through a
block in the transition from the DN3 (CD25
+CD44
−) to the DN4
(CD25
−CD44
−) stage
18. However, in the kinase-dead Trpm7
R/Rmutant, the distribution of DN3 and DN4 thymocytes was
unaltered with respect to WT (Fig.
1
d–f), indicating that the
kinase activity is not responsible for the thymic phenotype
observed previously.
100 50 0 IL-10 800 400 0 IL-9 300 150 0 IL-12 p70 200 100 0 IL-17 20 10 0 IL-3 IL-1β 150 75 0 G-CSF 70 35 0 IFN-γ 800 400 0 TNF***
WT 40 20 0 IL-4 800 400 0 IL-13*
300 150 0 GM-CSF 400 200 0 Conc. (pg/ml)Conc. (pg/ml) Conc. (pg/ml) Conc. (pg/ml) Conc. (pg/ml) Conc. (pg/ml) Conc. (pg/ml) Conc. (pg/ml) Conc. (pg/ml) Conc. (pg/ml) Conc. (pg/ml) Conc. (pg/ml)
DN1 (10 5 cells) DN2 (10 4 cells) 8 6 4 2 0 DN3 (10 5 cells) DN4 (10 5 cells) 6 20 15 10 5 0 4 2 0 15 10 5 0 WT Trpm7R/R Trpm7R/R WT Trpm7R/R WT % of max Trpm7R/R WT CD25 DN thymocytes WT Trpm7R/R TRPM7R/R WT WT Trpm7R/R Trpm7R/R WT CD4 CD25 WT Trpm7R/R Trpm7R/R WT Trpm7R/R WT Trpm7R/R WT Trpm7R/R CD8 + (10 6 cells) CD4 + (10 7 cells) 6 4 2 0 2.0 1.5 1.0 0.5 0 DP (10 8 cells) DN (10 6 cells) 2.0 1.5 1.0 0.5 0 5 4 3 2 1 0 Thymocytes (10 8 cells) 2.5 1.5 2.0 1.0 0.5 0 CD8 CD44 7 2 87 2 8 2 87 2 20 50 4 26 17 56 3 24
a
b
c
d
e
f
g
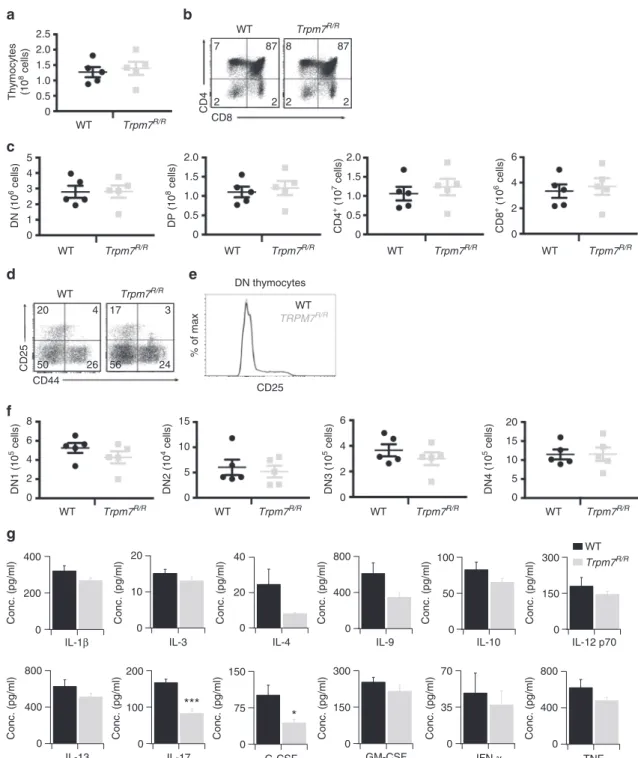
Fig. 1 Normal T cell development in Trpm7R/Rmice but altered cytokine secretion.a Total WT or Trpm7R/Rcell recovery from thymus.b Representative dot
plot analysis of thymocytes from WT or Trpm7R/Rthymi stained with CD4 and CD8 mAbs. Percentages are shown in each gate.c Dot charts comparing the
total number of thymocytes in the double-negative (DN), double-positive (DP), CD4+, and CD8+thymocytes are shown (mean± s.e.m. n = 5). d
Representative dot plot analysis of thymocytes gated on DN cells from WT or Trpm7R/Rthymi stained with CD44 and CD25 mAbs. Percentages are shown
in each gate.e Representative histogram overlay of cell surface CD25 in WT or Trpm7R/Rthymocytes.f Dot charts showing the number of total cells
(mean± s.e.m. n = 5) of DN population found in the DN1, DN2, DN3 and DN4 stages. Data are representative results of two independent experiments with
five mice per experiment. g Basal cytokine levels evaluated in serum of WT (black, n = 3–7) and Trpm7R/R(grey, n= 3–7) mice, respectively, and shown as
pg ml−1. Bar charts indicate mean± s.e.m. A total number of seven mice were used for each genotype. Note a significant reduction of serum levels of IL-17
In spite of normal T cell development and similar to T
cell-specific conditional Trpm7
−/−mice
18, the Trpm7
R/Rmutant had
a reduction of pro-inflammatory cytokines in the serum,
including granulocyte colony-stimulating factor (G-CSF) and
interleukin (IL)-17A. Also IL-1β, IL-3, IL-4, IL-9, IL-10, IL12p70,
IL-13,
granulocyte-macrophage
colony-stimulating
factor
(GM-CSF), interferon (IFN)-γ and tumor necrosis factor (TNF)
were reduced, albeit not significantly (Fig.
1
g), thus indicating a
function of the TRPM7 kinase in shaping the cytokine secretion
profile.
IELs 48 17 9 11 62 33 61 25 42 29 55 11 0 20 40 60 LPLs 21 7 2 4 17 19 72 76 16 14 0 20 40 60 80 100 % of cells % of cells***
***
0 200 400 600 800 1000 Cell counts 2 4 6 0 0 2 4 6 TCR αβ TCR αβ TCRγδ TCRγδ CD8 α CD4 CD4 CD8 α CD8β CD8 α CD8β CD8 α Cell counts (10 5) Cell counts (10 5)**
*
***
*
*
***
***
**
**
8 90 4 FSC-A MHCII 0 50 100 Gated on EpCAM+ cells0 5 10 15 20
**
*
% of cells Rorc Il-17a a.u. a.u. a.u. WT IFN-γ IL-17A 8 3 17 7 0.7 6 *** Trpm7R/R WT Trpm7R/R WT Trpm7R/R WT Trpm7R/R WT Trpm7 R/R WT Trpm7 R/R WT Trpm7R/R WT Trpm7R/R Trpm7R/R WT Trpm7R/R WT WT Trpm7R/R WT Trpm7R/R T-bet Foxp3 WT Trpm7R/R***
***
***
***
33 79 9 5 3 2 29 34 75 1 6 2 84 91 8 80 4 1 0 0 1 0 0 0 1 0 % of cells 0.03 0.02 0.01 0.00 0.20 0.15 0.10 0.05 0.00 a.u. 0.20 0.15 0.10 0.05 0.00 0.025 0.020 0.015 0.010 0.005 0.000 IFN-γ+Il-17A– IFN-γ+Il-17A+ IFN-γ–Il-17A+ TCR αβ TCR γδ CD4 CD8 ααTCR αβ CD8 αβTCR αβ TCR αβ TCR γδ CD4 CD8 ααTCR αβ CD8 αβTCR αβ TCR αβ TCR γδ CD4 CD8 ααTCR αβ CD8 αβTCR αβ TCR αβ TCR γδ CD4 CD8 ααTCR αβ CD8 αβTCR αβ Gated on TCRαβ LPLs Gated on TCRαβ IELsa
b
c
d
e
f
g
h
In vitro activation of CD4
+T cells derived from Trpm7
R/Rmice
using
αCD3/αCD28-coated plates resulted in slightly reduced
intracellular Ca
2+signalling compared to WT cells
(Supplemen-tary Fig.
2
a). Although Trpm7
R/RT cells had similar kinetics of
receptor-operated Ca
2+entry (ROCE) compared to WT T cells,
Ca
2+amplitudes in Trpm7
R/RT cells were different at 150 s
compared to WT (Supplementary Fig.
2
a). Nonetheless, the
proliferation rates were similar between the two genotypes,
indicating no primary defect of Trpm7
R/Rmice in T cell activation
(Supplementary Fig.
2
b, c).
TRPM7 kinase promotes T cell colonization of gut epithelium.
While T cell subsets in the spleen and peripheral lymph nodes
were distributed normally in Trpm7
R/Rmice (Supplementary
Fig.
3
a, b), we found a strong reduction of all T cell subsets in the
intestinal epithelium (Fig.
2
a, c) and the lamina propria (LP)
(Fig.
2
b, d) by
fluorescence-activated cell sorting (FACS) analysis.
Notably, LPLs as well as CD4
+TCRαβ
+IELs were particularly
affected by the lack of TRPM7 kinase activity (Fig.
2
a, b). In line
with these
findings, the analysis of the distribution of CD3
+T cells in tissue sections of the small intestine from Trpm7
R/Rmice revealed a reduction of IELs compared to WT (Fig.
2
e). The
presence of IELs correlates with the induction of MHCII
expression on epithelial cells
24. Consistent with the reduction of
IELs, we detected a dramatic reduction of MHCII expression in
EpCAM
+intestinal epithelial cells in Trpm7
R/Rcompared to WT
mice (Fig.
2
f). Analysis of the transcriptional profile of the few
IELs that were present in Trpm7
R/Rmice revealed no differences
in T-bet or FoxP3 expression when compared to WT, indicating a
normal T
H1 and T
regpolarization, respectively. However, the
signature transcription factor for T
H17 cells, Rorc, was reduced in
Trpm7
R/RIELs compared to WT that was also reflected by
reduced IL-17 expression (Fig.
2
g). These
findings were
con-firmed by intracellular staining via FACS for IFN-γ and IL-17A in
IELs isolated from WT and Trpm7
R/Rmice. While IFN-γ
secreting cells were comparable between Trpm7
R/Rand WT
IELs, IL-17A secreting cells were diminished in Trpm7
R/Rcom-pared to WT IELs (Fig.
2
h).
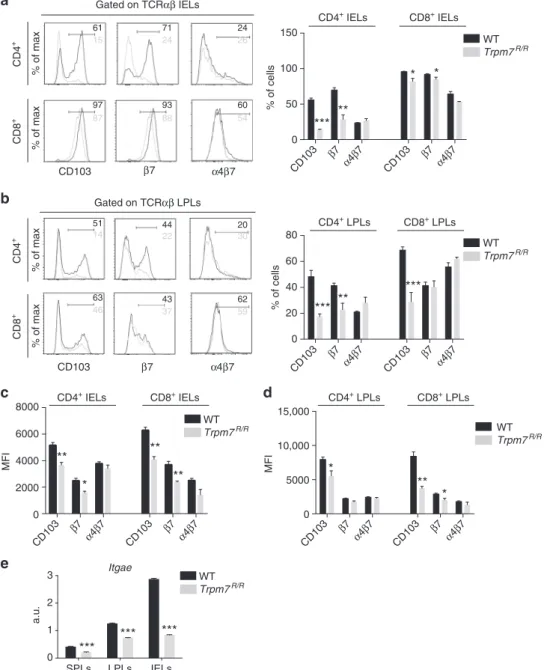
Defect in gut epithelium colonization is T cell intrinsic. In the
intestinal epithelium the upregulation of CD103 is required,
specifically integrin α
Eβ
7, which in turn interacts with E-cadherin
on the epithelial cells and thus facilitates the retention of IELs
into the epithelial layer
25,26. Interestingly, CD103 and integrin
β
7expressing CD4
+IELs were reduced in Trpm7
R/Rmice, while
CD8
+IELs were only slightly reduced and
α
4β
7expressing cells
were unaffected (Fig.
3
a). The analysis of CD4
+and CD8
+LPLs
revealed a similar reduction in CD103 expression in Trpm7
R/Rmice compared to WT (Fig.
3
b). However, integrin
β
7expressing
CD8
+LPLs were unaffected in Trpm7
R/Rmice compared to WT
(Fig.
3
b). Also the mean
fluorescence intensity (MFI) of CD103
expression was reduced in Trpm7
R/RCD4
+and CD8
+IELs as
well as CD4
+and CD8
+LPLs compared to WT cells (Fig.
3
c, d).
Correspondingly, the MFI of the integrin
β
7was similarly reduced
(Fig.
3
c, d). At the transcriptional level, analysis of the gene
encoding CD103, Itgae, via quantitative real-time (qRT)-PCR
revealed reduced Itgae messenger RNA (mRNA) expression in
lymphocytes isolated from the spleen, LP and intestinal
epithe-lium of Trpm7
R/Rcompared to WT mice (Fig.
3
e).
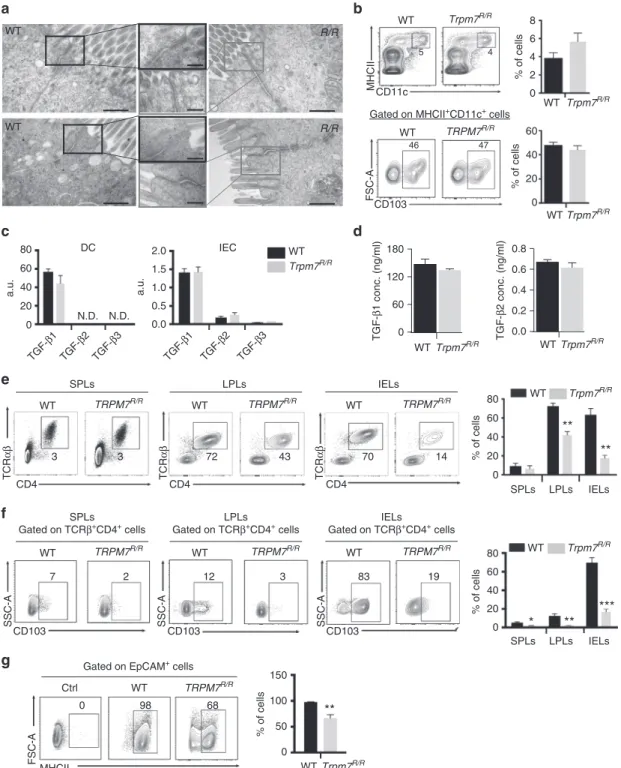
To rule out the contribution of other cells to the reduction of
IELs and LPLs as well as CD103 expression, we further examined
intestinal epithelial as well as dendritic cells. Transmission
electron microscopic images of the ileum (upper panel) and the
colon (lower panel) of WT and Trpm7
R/Rmice illustrate no
changes in overall structure, tight junction, adherens junction or
desmosome formation (Fig.
4
a), indicating no primary difference
between the epithelial barrier of WT and Trpm7
R/Rmice.
Interestingly, MHCII as well as CD103 surface expression of
WT and Trpm7
R/Rdendritic cells was unaltered (Fig.
4
b),
suggesting that dendritic cell function is not affected by the
TRPM7 kinase. Consistently, Trpm7 mRNA levels were strongly
reduced in DCs as well as in epithelial cells, compared to T cells
(Supplementary Fig.
3
c).
CD103 expression strongly depends on TGF-β stimulation
27.
The analysis of TGF-β1, two and three mRNA levels in dendritic
as well as intestinal epithelial cells, two main sources of TGF-β in
the gut, did not reveal significant differences between WT and
Trpm7
R/Rmice (Fig.
4
c). Moreover, we did not detect any
difference in TGF-β serum levels between the different mice
(Fig.
4
d). Notably, TGF-β1 was the most prominent isoform in
serum, while TGF-β3 was not detectable.
To confirm that the reduced number of IELs and LPLs in
Trpm7
R/Rmice was T cell intrinsic, we adoptively transferred
either WT or Trpm7
R/Rnaive CD4
+cells into congenic Rag1
−/−/Il2rg
−/−double mutant mice, lacking T and B as well as
natural killer cells. While both WT and Trpm7
R/Rnaive T cells
equally reconstituted the spleen, Trpm7
R/RT cells exhibited an
intrinsic defect in colonizing the intestinal epithelium (Fig.
4
e).
Trpm7
R/RCD4
+IELs poorly, if at all, expressed CD103 (Fig.
4
f),
thereby indicating that the defect of IEL retention within the
small intestinal epithelium was T cell autonomous. Moreover,
lymphopenic hosts adoptively transferred with naive CD4
+T cells
from Trpm7
R/Rmice had impaired upregulation of MHCII in
intestinal epithelial cells (Fig.
4
g).
TRPM7 kinase regulates TGF-β/SMAD pathways. As Trpm7
R/RIELs displayed a pronounced reduction in Rorc and IL-17
expression while T-bet and FoxP3 were equivalent in Trpm7
R/Rcompared to WT IELs (Fig.
2
g), we addressed whether in vitro
differentiation of naive CD4
+Trpm7
R/RT cells would reproduce
this phenomenon. After polarization of naive T cells into T
H1 or
T
regfor 5 days using the respective cytokine and
inhibitory-antibody cocktails (Methods), we observed no differences in the
percentage of IFN-γ or CD25
+FoxP3
+T cells between the two
Fig. 2 Selectively reduced intra-epithelial lymphocytes in Trpm7R/Rmice.a Dot plot (left) and statistical analyses (right) of intra-epithelial lymphocytes
(IEL) from WT or Trpm7R/Rmice stained as indicated. Percentages are shown in each gate, bar charts show mean percentages± s.e.m. (WT, n = 6;
Trpm7R/R, n= 7). b Dot plot (left) and statistical analyses (right) of lamina propria lymphocytes (LPL) from WT or Trpm7R/Rmice stained as indicated.
Percentages are shown in each gate, bar charts show mean percentages± s.e.m. (n = 7). c Absolute numbers (WT, n = 6; Trpm7R/R, n= 7) of the indicated
IELs subsets. Bar charts show mean percentages± s.e.m. d Absolute numbers (mean ± s.e.m. n = 7) of the indicated LPL subsets. e CD3
immunohistochemical staining of small intestine sections of WT or Trpm7R/Rmice and relative quantification (right). Scale bars indicate 100 µm. f Dot blots
and statistical analyses of MHCII expression in EpCAM+intestinal epithelial cells (IEC). Percentages are shown in each gate, bar charts show mean
percentages± s.e.m. (n = 3). g Quantitative real-time PCR of T-bet, Foxp3, Rorc and Il-17a expression in purified TCRαβ+CD4+IELs from WT or Trpm7R/R
mice.h Dot plot and statistical analyses of IFN-γ and IL-17A staining in WT or Trpm7R/RTCRαβ+CD4+IELs. Percentages are shown in each gate, bar charts
show mean percentages± s.e.m. (WT, n = 5; Trpm7R/R, n= 8). Data are representative results of at least 3 independent experiments. A two-tailed
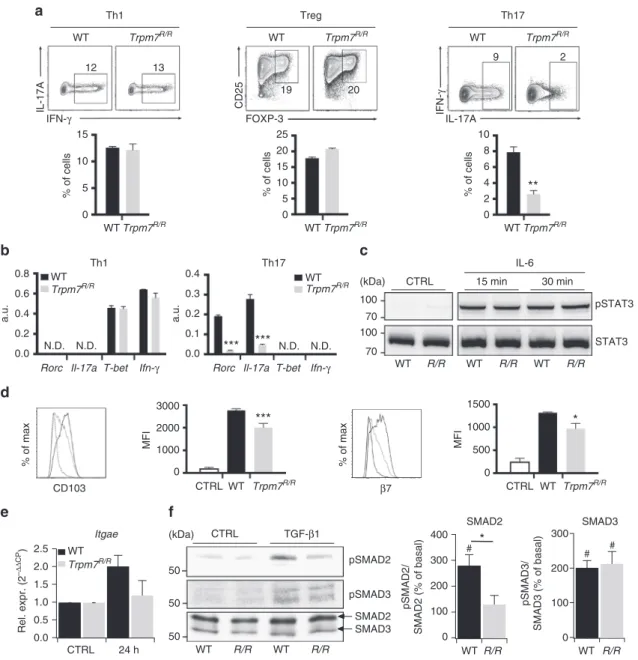
genotypes (Fig.
5
a, left and middle). Interestingly, in vitro
polarization of naive CD4
+T cells into T
H17 cells, using TGF-β,
IL-6 and
αIFN-γ, was reduced in Trpm7
R/Rcompared to WT cells
(Fig.
5
a, right), consistent with the robust reduction of IL-17
concentration in serum from Trpm7
R/Rmice (Fig.
1
g) as well as
the diminished number of IL17-producing Trpm7
R/RIELs
(Fig.
2
h). In contrast, T-bet and Ifn-γ mRNA levels were not
different among in vitro-differentiated Trpm7
R/Rand WT
T
H1 cells (Fig.
5
b). Since Rorc and IL-17 mRNA levels were
reduced in in vitro-differentiated Trpm7
R/RT
H17 cells (Fig.
5
b),
we analysed STAT3 signalling as a signalling pathway involved in
T
H17 differentiation. However, western blot analysis of CD4
+T cells treated with IL-6 for 15 and 30 min showed no differences
in STAT3 phosphorylation at Tyr705 (Fig.
5
c).
Next, we asked whether the defect in CD103 expression in vivo
was also reflected in vitro. To this end, naive CD4
+T cells were
treated with TGF-β1, stimulated with αCD3/αCD28 and analysed
for CD103 and integrin
β
7surface expression by FACS.
Interestingly, Trpm7
R/RCD4
+T cells were characterized by a
reduction in CD103 and integrin
β
7expression (Fig.
5
d). While
WT naive CD4
+T cells increased Itgae gene expression twofold,
Trpm7
R/Rnaive CD4
+T cells were unable to upregulate Itgae
expression after 24 h stimulation (Fig.
5
e), suggesting a
transcriptional regulation of CD103 via the TRPM7 kinase. Since
CD4 + CD8 + CD103 β7 α4β7 CD4 + CD8 + 0 1 2 3 SPLs LPLs IELs Itgae MFI MFI
**
*
**
% of max % of max % of max % of max a.u. CD103 β7 α4β7 Gated on TCRαβ IELs Gated on TCRαβ LPLs**
WT Trpm7R/R WT Trpm7R/R 71 24 93 88 44 22 24 26 20 30 60 54 62 59 61 15 97 87 51 14 63 46 0 50 100 150 % of cells 0 20 40 60 80 % of cells***
***
**
CD8+ IELs CD4+ IELs CD8+ LPLs CD4+ LPLs CD8+ IELs CD4+ IELs CD4+ LPLs CD8+ LPLs WT Trpm7R/R WT Trpm7R/R WT Trpm7R/R 0 2000 4000 6000 8000 0 5000 10,000 15,000*
**
*
***
*
**
*
***
***
***
43 37 α4β7 β7 CD103 α4β7 β7 CD103 α4β7 β7 CD103 α4β7 β7 CD103 α4β7 β7 CD103 α4β7 β7 CD103 α4β7 β7 CD103 α4β7 β7 CD103a
b
c
d
e
Fig. 3 Trpm7R/Rmutation affectsαEβ7expression in T cells.a Representative histogram overlay of cell surface CD103,β7andα4β7expression of
intra-epithelial lymphocytes (IEL, left) and relative statistical analysis (right). Percentages are shown in each gate, bar charts show mean percentages± s.e.m. (n
= 4). b Representative histogram overlay of cell surface CD103, β7andα4β7expression of lamina propria lymphocytes (LPL, left) and relative statistical
analysis (right). Percentages are shown in each gate, bar charts show mean percentages± s.e.m. (n = 4). c Surface CD103, β7, andα4β7expression in IELs,
bar charts show meanfluorescence intensity ± s.e.m. (n = 5). d Surface CD103, β7andα4β7expression of LPLs, bar charts show meanfluorescence
intensity± s.e.m. (n = 5). e Quantitative real-time PCR of Itgae expression in purified TCRαβ+CD4+lymphocytes from spleen (SPL), lamina propria (LPL) or
intra-epithelium (IEL). Data are representative results of at least 3 independent experiments. A two-tailed Student’s t test was used with *p < 0.05; **p <
b
0.8 0.6 0.4 0.2 0.0 180 120 60 0 Trpm7R/R Trpm7R/Ra
SPLs LPLs IELs SPLsGated on TCRβ+CD4+ cells Gated on TCRLPLsβ+CD4+ cells Gated on TCRIELsβ+CD4+ cells
SPLs LPLs IELs SPLs LPLs IELs
c
e
f
g
WT WT 60 80 40 20 60 80 40 20***
**
*
**
**
**
DC IEC N.D. N.D. 0 0Gated on EpCAM+ cells
Trpm7R/R Trpm7R/R WT Trpm7R/R WT Trpm7R/R WT Trpm7R/R WT WT Trpm7R/R TRPM7R/R Trpm7R/R WT R/R WT R/R 8 % of cells % of cells 6 4 2 0 5 4 47 46 WT CD11c MHCII FSC-A TRPM7R/R 60 40 20 0 60 TRPM7R/R 80 2.0 1.5 1.0 0.5 0.0 TGF-β1 TGF-β2 TGF -β3 TGF-β1 TGF-β2 TGF-β3 a.u. 40 a.u. 20 0 CD103 TCR αβ TCR αβ
SSC-A SSC-A SSC-A
TCR αβ TGF-β 1 conc. (ng/ml) TGF-β 2 conc. (ng/ml) WT WT TRPM7R/R WT TRPM7R/R WT TRPM7R/R WT WT Ctrl TRPM7R/R WT TRPM7R/R WT
Gated on MHCII+CD11c+ cells
WT CD4 CD103 % of cells 150 100 50 0 CD103 CD103 7 2 12 3 % of cells % of cells CD4 CD4 3 3 72 43 70 14 83 19 FSC-A MHCII 0 98 68
d
Fig. 4 TRPM7 kinase-dead T cell autonomous defect in in vivo CD103 expression and intra-epithelial localization. a Transmission electron microscopic
(TEM) images of small intestine (upper panel) and colon (lower panel) sections from WT or Trpm7R/Rmice. Note no changes in tight junction, adherens
junction or desmosome formation between the two genotypes. Scale bars indicate 500 and 200 nm, respectively.b Dot plot (left) and statistical analyses
(right) of CD11c+MHCII+DC and relative CD103 expression. Percentages are shown in each gate, bar charts show mean percentages± s.e.m. (n = 3). c
Quantitative real-time PCR of Tgf-β1, Tgf-β2 and Tgf-β3 expression in WT or Trpm7R/Rpurified CD11c+MHCII+DC cells (left) or in EpCAM+IEC (right).d
TGF-β1 and TGF-β2 levels measured in serum harvested from WT or Trpm7R/Rmice (n= 4). Data are shown as mean ± s.e.m. e Dot plot and statistical
analyses of spleen (SPL), lamina propria (LPL) and intra-epithelial (IEL) TCRαβ+CD4+lymphocytes from Rag1−/−/Il2rg−/−mice reconstituted with purified
WT or Trpm7R/Rnaive CD4 cells.f Cells were gated for surface CD4 and TCRαβ and were analysed for CD103 expression. Percentages are shown in each
gate, bar charts show mean percentages± s.e.m. (n = 4). g Dot plots and statistical analyses of MHCII expression in EpCAM+intestinal epithelial cells
(IEC) from Rag1−/−/Il2rg−/−mice reconstituted with purified WT or Trpm7R/Rnaive T cells. Percentages are shown in each gate, bar charts show mean
percentages± s.e.m. (n = 4). Data are representative results of at least three independent experiments. A two-tailed Student’s t test was used with *p <
TGF-β was shown to upregulate CD103 via SMAD and NFAT
pathways in human T cells
28, we addressed whether the TGF-β/
SMAD signalling pathway was affected by TRPM7 kinase activity,
particularly as TGF-β/SMAD pathways are also crucial for the
polarization of CD4
+T cells into T
H17 cells
29. Importantly,
western blot analysis of Trpm7
R/Rnaive CD4
+T cells treated with
5 ng ml
−1TGF-β1 for 10 min revealed a strong and reduction in
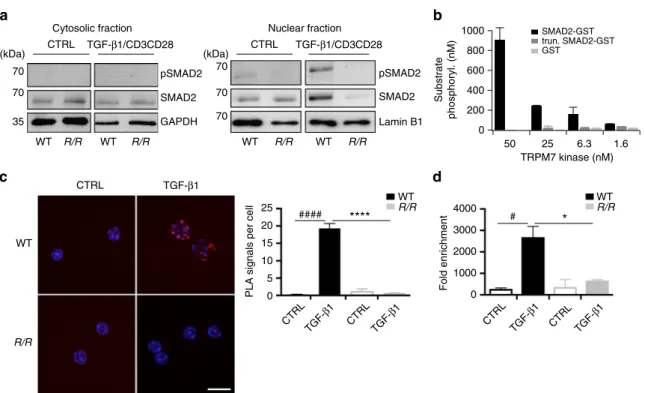
SMAD2 (Ser465/467) phosphorylation (Fig.
5
f, upper row and
middle panel), while SMAD3 (Ser423/425) phosphorylation was
unaltered (Fig.
5
f, middle row and right panel). Consistently,
SMAD2 translocation into the nucleus was impaired in Trpm7
R/RT cells compared to WT (Fig.
6
a). Thus, we conclude that the
TRPM7 kinase regulates T
H17 differentiation and Itgae
expres-sion via TGF-β/SMAD2 dependent pathways.
To further clarify the mechanism by which TRPM7 kinase
activity controls TGF-β/SMAD2 signalling, we performed an
300 200 100 0 pSMAD3/ SMAD3 (% of basal) 2.5 2.0 1.5 1.0 0.5 0.0 WT WT Trpm7R/R CTRL WT R/R WT R/R WT R/R Itgae 400 300 200 100 0 pSMAD2/ SMAD2 (% of basal)
*
CTRL 24 h 15 min 30 min WT R/R # WT R/R WT R/R SMAD3 SMAD2 SMAD2 SMAD3 IL-6 pSMAD2 pSTAT3 STAT3 pSMAD3 5 0 10**
N.D. N.D. Th1 Th1***
***
N.D. N.D. Th17 Treg Th17 % of cells % of cells 15 5 0 10 25 20 15 % of cells 2 0 4 10 8 6 CTRL CD103 Trpm7R/R β7 CTRL WT Trpm7R/R***
*
WT Trpm7R/R WTTrpm7R/R 3000 0.4 0.3 0.2 0.1 0.0 2000 1000 0 MFI a.u. 0.8 0.6 0.4 0.2 0.0 a.u. MFI % of max % of max 1500 1000 500 0 WT R/R # # WT Trpm7R/R WT WT Trpm7R/R Trpm7R/R WT Trpm7R/R WT IL-17A CD25 IFN-γ Trpm7R/R WT Trpm7R/RRorc Il-17a T-bet Ifn-γ Rorc Il-17a T-bet Ifn-γ
100 70 100 70 50 50 CTRL (kDa) (kDa) TGF-β1 50 Rel. expr. (2 –ΔΔ CP ) IL-17A FOXP-3 12 13 19 20 9 2 IFN-γ
a
b
c
d
e
f
Fig. 5 Trpm7R/RT cells have autonomous defects in in vitro Th17 polarization and CD103 upregulation.a Representative dot plots and statistical analyses of
IFN-γ, IL-17A, CD25 and FOXP3 expression in stimulated naive T cells under Th1, Tregor Th17-polarizing conditions after 5 days of in vitro culture.
Percentages are shown in each gate, bar charts show mean percentages± s.e.m. (n = 4). b Quantitative real-time PCR of T-bet, ifn-γ, Rorc, and Il-17a
expression in naive T cells stimulated under Th1 or Th17-polarizing conditions after 5 days of culture in vitro. (n= 3). c Western blot analysis of STAT3
phosphorylation (Tyr705) of control and IL-6 treated WT and Trpm7R/R(R/R) naive T cells, respectively. Blots are representatives of at least three
independent experiments.d Histogram overlays and statistical analyses of CD103 andβ7 staining by flow cytometry in WT or Trpm7R/Rnaive T cells
stimulated with anti-CD3ε/anti-CD28 in the absence or presence of TGF-β (10 ng ml−1) for 4 days. Histograms show meanfluorescence intensity (MFI) ±
s.e.m. (n= 4). Data are representative results of at least three independent experiments. e Quantitative real-time PCR of Itgae (CD103) in control (CTRL)
and WT or Trpm7R/Rnaive T cells stimulated with anti-CD3ε/anti-CD28 in the presence of TGF-β (5 ng ml−1) for 24 h. Data are shown as 2−ΔΔCP± s.e.m.
(n= 3). f Western blot and statistical analysis of SMAD2 (Ser465/467) and SMAD3 (Ser423/425) phosphorylation. Blots are representatives of at least
four independent experiments. The semi-quantitative analysis was done via ImageJ software and plotted as percent increase in intensity of pSMAD/total
SMAD compared to control. Bar charts show mean percentages± s.e.m. for SMAD2 and SMAD3 (n = 4–5). A two-tailed Student’s t test was used with *p
< 0.05; **p < 0.01 and ***p < 0.001. To demonstrate a significant increase in TGF-β-induced SMAD phosphorylation compared to untreated controls a
in vitro kinase assay using highly purified recombinant TRPM7
kinase, GST, as well as C-terminally truncated
SMAD2-GST and SMAD2-GST-tag as controls. Remarkably, TRPM7
phosphor-ylates SMAD2 in a dose dependent manner. Moreover, TRPM7
fails to phosphorylate the truncated SMAD2 or the GST-tag,
thereby identifying the C-terminal SXS motif of SMAD2 as a
substrate for TRPM7 kinase (Fig.
6
b). Thus, we conclude that
TRPM7 kinase can modulate SMAD2 signalling via direct
phosphorylation at the C-terminal Ser465/467 motif (Figs.
5
f,
6
b), which is essential for its transcriptional activity, while the
linker region (Ser245/250/255) is unaffected by TRPM7 kinase
(Supplementary Figs.
3
d,
6
b).
Moreover, we performed a proximity ligation assay (PLA) on
purified CD4
+T cells, to characterize the interaction of SMAD2
with TRPM7 kinase in more detail. Figure
6
c depicts a significant
increase in SMAD2 co-localization with TRPM7 in WT T cells
treated with 5 ng ml
−1TGF-β1 (p < 0.0001, two-tailed Student’s t
test), while Trpm7
R/RT cells fail to recruit SMAD2 into close
proximity to TRPM7 kinase (Fig.
6
c). SMAD2 has previously
been shown to bind to the Itgae promoter sequence, thereby
facilitating its transcription
25. To link the observed defect in
CD103 expression of Trpm7
R/RT cells to their defective
SMAD2
signalling,
we
performed
a
chromatin
immunoprecipitation (ChIP) assay on primary murine CD4
+T cells with and without TGF-β1 stimulation (Fig.
6
d). Our
results show that SMAD2 binds to the Itgae promoter regions
upon TGF-β1 stimulation in WT T cells, but fails to do so in
Trpm7
R/RT cells in response to TGF-β1 stimulation,
under-scoring the indispensable requirement of a functional TRPM7
kinase in TGF-β/SMAD2 signalling in T cells.
TRPM7 kinase activity promotes graft-versus-host disease. In
acute graft-versus-host disease (GVHD), naive donor CD4 cells
recognize alloantigens on antigen presenting cells in target
organs, including skin, intestine and lung. However, the function
of different T
Hsubsets and signalling pathways in the
patho-genesis of GVHD in distinct organs is incompletely characterized.
We hypothesized that defective intestinal colonization by CD4
+cells lacking TRPM7 kinase activity could affect acute GVHD. To
address this hypothesis, BALB/c WT mice were lethally irradiated
and transplanted with bone marrow cells from WT C57BL/6J
mice together with WT or Trpm7
R/Rsplenocytes. As expected,
injection of WT splenocytes resulted in massive intestinal damage
as demonstrated by shortening of the colon (Fig.
7
a) and most
mice died within 35 days after transplantation (Fig.
7
b). In
1000 800 600 400 200 0 Substrate phosphoryl. (nM) 50 25 6.3 1.6 TRPM7 kinase (nM) SMAD2-GST trun. SMAD2-GST GST CTRL CTRL TGF-β1/CD3CD28 CTRL TGF-β1/CD3CD28
a
b
WT R/R WT R/R WT R/R WT R/R pSMAD2 pSMAD2 SMAD2 SMAD2 Lamin B1 GAPDH (kDa) (kDa)Cytosolic fraction Nuclear fraction
70 70 35 70 70 70 WT R/R 5 0 10 15 20 25 CTRL WT R/R ####
****
WT R/R #*
0 3000 4000 Fold enrichmentPLA signals per cell
2000 1000 TGF-β1 TGF-β1 CTRL TGF -β1 CTRL TGF-β1 CTRL TGF -β1
d
c
Fig. 6 TRPM7 kinase affects SMAD2 translocation via direct phosphorylation. a Analysis of pSMAD2 translocation into the nucleus. WT and Trpm7R/R
naive CD4+T cells were co-stimulated withαCD3/αCD28 and 5 ng ml−1TGF-β1 for 10 min. Representative western blot images depicting that pSMAD2
and total SMAD2 in the nuclear fraction (right) were strongly reduced in Trpm7R/RT cells compared to WT. In the respective cytosolic fraction (left), the
pSMAD2 was not detectable, however amounts of total SMAD2 were comparable between Trpm7R/Rand WT.b Concentration-dependent
phosphorylation of human recombinant SMAD2-GST by TRPM7 kinase. Data have been obtained via RBC hotspot in vitro kinase assay using 4µM ATP
and 4µM substrate at 2 h. RBC standard substrate was used as a positive control, substrate alone as a negative control and kinase activity alone was
subtracted as background. Data have been converted to nM substrate phosphorylation and are plotted as mean± s.e.m. Truncated recombinant SMAD2
(trun. SMAD2-GST) as well as the GST-tag alone were not phosphorylated, suggesting specific phosphorylation of SMAD2 at the c-terminal SXS motif. c
Analysis of interaction between SMAD2 and TRPM7 in CD4+T cells via proximity ligation assay (PLA). Scale bar indicates 10µm. Note a significant
increase in SMAD2 co-localization with TRPM7 in WT T cells treated with 5 ng ml−1TGF-β1 (####p< 0.0001; two-tailed Student’s t test). Trpm7R/RT cells
fail to recruit SMAD2 into close proximity to the TRPM7 kinase upon TGF-β1 stimulation compared to WT (****p < 0.0001; two-tailed Student’s t test). Bar
graphs show mean PLA signals per cell counted infive fields of vision ± s.e.m. d ChIP assay was performed in untreated and TGF-β1 (5 ng ml−1) stimulated
CD4+T cells using a specific antibody against SMAD2 for immunoprecipitation. Primers for Itgae and Gapdh were used for qRT-PCR; Gapdh was used for
normalization. Note a significant increase in -fold enrichment in TGF-β1-treated WT T cells compared to untreated controls (#p< 0.05, one-way analysis of
variance) as well as a reduction in fold enrichment of TGF-β1-treated Trpm7R/RT cells compared to WT (*p< 0.05, one-way ANOVA). Bar graphs show
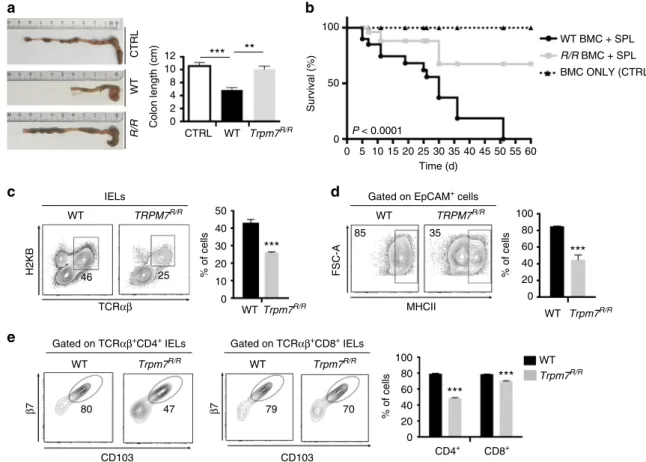
contrast, injection of Trpm7
R/Rsplenocytes did not cause
intest-inal damage and shortening of the colon in BALB/c hosts
(Fig.
7
a). Moreover, we observed a dramatically increased survival
of these mice; only about 10% of mice injected with Trpm7
R/Rsplenocytes died within the
first 30 days after transplantation
(Fig.
7
b).
The analysis of intestinal epithelium by FACS with H2K
B(C57BL/6J haplotype)-specific mAb revealed a reduction of
TCRαβ
+cells derived from Trpm7
R/Rsplenocytes with respect
to WT cells, suggesting an impairment of T cells lacking TRPM7
kinase activity in the colonization of host intestine (Fig.
7
c). Also,
the expression of CD103 and integrin
β
7was reduced in CD4
+as
well as CD8
+TCRαβ
+Trpm7
R/Rcompared to WT cells (Fig.
7
e).
The reduction of gut colonization by Trpm7
R/RT cells correlated
with a reduced expression of MHCII in host intestinal epithelial
cells with respect to mice injected with WT cells (Fig.
7
d). These
results indicate that TRPM7 kinase activity in T cells is a decisive
factor in the pathogenesis of GVHD by promoting host gut
epithelium colonization.
Discussion
Tissue-specific deletion of Trpm7 in the T cell lineage results in
impairment of T cell development in the thymus and altered
chemokine as well as cytokine expression profiles
18. In contrast,
mice carrying an inactive TRPM7 kinase (Trpm7
R/R) have
unaltered thymopoiesis
21, indicating that the channel but not the
kinase activity is important in regulating the progression of T cell
progenitors to mature T cells. However, in these mice, we
observed a significant reduction of pro-inflammatory cytokines,
including IL-17 and G-CSF, suggesting that TRPM7 kinase
activity might be essential for immune system homoeostasis.
While T cells in the spleen and peripheral lymph nodes of
Trpm7
R/Rmice were distributed normally, conventional T cells
within IELs and LPLs were reduced. In particular, CD4
+T cells
were the most significantly reduced IELs and LPLs subsets in
Trpm7
R/Ras compared to WT mice. In addition, the analysis of
functional subsets in the few CD4
+cells recovered from the gut of
Trpm7
R/Rmice revealed a dramatic reduction of T
H17 cells,
indicating that TRPM7 kinase activity is important for gut
colo-nization by T cells and T
H17 cell differentiation. In fact,
experi-ments of in vitro polarization of naive CD4
+T cells into T
H1, T
regand T
H17 cells showed a selective defect of Trpm7
R/RCD4
+T cells
to polarize into Rorc and IL-17 expressing cells. STAT3
phos-phorylation is important for T
H17 cell differentiation
29and Trpm7
silencing was shown to affect STAT3 phosphorylation at Tyr705
in breast cancer cells stimulated with epidermal growth factor
30.
However, IL-6 induced Tyr705 phosphorylation was unaffected in
Trpm7
R/RCD4
+T cells, suggesting that this signalling event is not
involved in the defect in T
H17 polarization of Trpm7
R/Rcells; this
result also suggests that in breast cancer cells Tyr705
Time (d) 0 5 10 15 20 25 30 35 40 45 50 55 60 P < 0.0001 46 25 0 Colon length (cm) Survival (%) % of cells % of cells 12 10 100 WT BMC + SPL R/R BMC + SPL BMC ONLY (CTRL) 50 0 8 4 2
**
***
***
***
***
***
WT WT H2KB TRPM7R/R Trpm7R/R CTRL WT Trpm7R/R WT Trpm7R/R R/R CTRL WT IELs Trpm7R/Rb
a
50 100 80 60 40 20 0 % of cells 100 80 60 40 20 0 40 30 20 10 0 WT WT TRPM7R/RGated on EpCAM+ cells
80 47 79 70 WT Trpm7R/R Gated on TCRαβ+ CD8+ IELs CD103 CD4 + CD8+ CD103 WT Trpm7R/R Gated on TCRαβ+ CD4+ IELs β 7 β 7 TCRαβ MHCII FSC-A 85 35
d
c
e
Fig. 7 TRPM7 kinase activity promotes destruction of the host intestinal epithelium by T cells during GVHD. a Representative picture of colon specimens at
day 25 after BMT in recipients of WT or Trpm7R/Rsplenocytes or (CTRL) bone marrow cells alone (left) and relative statistical analyses showing colon
length (right). Bars represent mean± s.e.m. (n = 5). b Survival of lethally irradiated BALB/c recipients of C57BL/6J bone marrow cells (BMC) alone (CTRL,
triangle, dashed line) or in combination with WT (black circles) or Trpm7R/R(R/R, grey squares) splenocytes (n= 10). c Dot plot and statistical analyses of
TCRαβ+H-2b+IELs cells from BALB/c mice reconstituted with WT or Trpm7R/Rsplenocytes. Percentages are shown in each gate, bar charts show mean
percentages± s.e.m. (n = 3). d Dot plot and statistical analyses of MHCII expression in EpCAM+IEC from BALB/c mice reconstituted with WT or Trpm7R/R
splenocytes. Percentages are shown in each gate, bar charts show mean percentages± s.e.m. (n = 3). e Dot plot and statistical analyses of CD103 and β7
expression in electronically gated H-2b+TCRαβ+CD4+or H-2b+TCRαβ+CD8+IELs. Percentages are shown within each gate, bar charts show mean
phosphorylation might be conditioned indirectly by the TRPM7
channel rather than kinase moiety.
In Trpm7
R/Rmice, the vascular adhesion molecule integrin
α
4β
7was not affected in intestinal T cells, whereas CD103
(integrin
α
Eβ
7) was dramatically reduced. These data indicate that
the profound reduction of intestinal T cells that characterizes
these mice is due to the impaired retention of T cells mediated by
the interaction of CD103 with E-cadherin expressed in epithelial
cells rather than emigration from blood vessels into the LP
4. Mice
lacking CD103 have selectively reduced numbers of mucosal
T cells and are more prone to experimentally induced colitis
25,26.
However, this phenomenon was attributed to lack of CD103 in
gut associated CD11c
highMHCII
highdendritic cells (DCs)
31, a cell
population that was not affected by lack of TRPM7 kinase
activity. Our observations are consistent with a selective defect of
Trpm7
R/RT cells in upregulating CD103 and gut retention, while
CD103 expression is not affected in DCs by Trpm7
R/R, pointing
to different regulatory mechanism/s in DCs. We demonstrated
the T cell intrinsic nature of the intestinal defect due to lack of
CD103 upregulation by adoptive transfer of Trpm7
R/RCD4
+cells
into lymphopenic hosts. Another important consequence of
defective TRPM7 kinase activity in T cells was the significant
reduction of MHCII expression in intestinal epithelial cells, a
IELs-dependent feature essential for proper antigen presentation
and immunological function of gut epithelial cells
1,4.
Both T
H17-cell polarization and CD103 expression depend on
TGF-β signalling
27,28. DCs and intestinal epithelial cells (IEL) are
the major source for TGF-β in the gut
5. However, the relative
mRNA expressions of Tgf-β1, 2 and 3 in DCs and IELs as well as
serum concentrations for TGF-β1 and 2 were similar both in
Trpm7
R/Rand WT mice, indicating no primary defect in TGF-β
production or secretion by lack of TRPM7 kinase activity.
Con-versely, in vitro induction of CD103 by TGF-β in naive Trpm7
R/RCD4
+cells was impaired. This impairment was also evident at the
transcriptional level since Trpm7
R/RCD4
+cells failed to
upre-gulate Itgae. In fact, according to SMAD dependence of Itgae
expression
28, we could show a reduction of the phosphorylation
of the C-terminal SXS motif of SMAD2 but not of SMAD3 in
TGF-β1-stimulated Trpm7
R/RCD4
+cells. Moreover, using ChIP
we demonstrated the defective binding of SMAD2 to the Itgae
promoter region in Trpm7
R/RT cells upon TGF-β1 stimulation.
Interestingly, SMAD2 activation was suggested to exquisitely
regulate T
H17 cell generation but to be dispensable for T
regcell
differentiation
32, consistent with distinct control of T cell
func-tions by SMAD-dependent and -independent TGF-β signalling
33.
However, this notion remains controversial in the literature, as
some studies report a dispensable function of SMAD2 in T
H17
cell polarization
34–37, suggesting the existence of compensatory
mechanisms under certain circumstances. As we have not
eval-uated all possible Ser/Thr phosphorylation sites on SMAD3, we
cannot exclude an effect of the TRPM7 kinase deletion on sites
other than the C-terminal SXS motif. However, for SMAD2, we
can exclude other direct phosphorylation sites, as the truncated
SMAD2 mutant did not have any phosphorylation by TRPM7
kinase in our in vitro kinase assay. Nonetheless, our results are in
line with a dispensable function of TRPM7 kinase activity in
TGF-β mediated differentiation of CD4
+cells into T
reg
cells.
TGF-β signalling exerts pleiotropic effects on cell physiology
via cross-talk with multiple signalling pathways. Imaging of
TGF-β1-activated SMAD signalling revealed selective inhibition of
SMAD2 phosphorylation by distinct tyrosine kinase inhibitors
38.
TRPM7 kinase appears as a pharmacological target for inhibition
of TGF-β1-mediated SMAD2 phosphorylation in T cells, as it is
capable to directly phosphorylate SMAD2. In summary, our study
demonstrates that TRPM7 kinase contributes to TGF-β-induced
SMAD2 phosphorylation at Ser465/467 and translocation into
the nucleus. Lack of TRPM7 kinase activity results in impaired
transactivation of SMAD2 target genes, including Itgae (encoding
for CD103), Il-17 and Rorc, thus selectively limiting
differentia-tion of the T cell along the T
H17, but not T
regcell, functional
program. The protection of Trpm7
R/Rmice from GVHD, we have
shown, unravels the clinical relevance of TRPM7 kinase as a
target for limiting TGF-β-dependent CD103 expression as a
pathogenetic
mechanism
in
intestinal
destruction
during
GVHD
27. Finally, our study demonstrates the importance of
developing pharmacological inhibitors for TRPM7 kinase activity
to prevent the devastating consequences of acute GVHD without
affecting the development of immunosuppressive T
regcells.
Methods
Mice and in vivo experiments. Trpm7R/Rmice were obtained from RIKEN,
Japan21. Four- to eight-week-old male and female mice were used for all
experi-ments. For ex vivo and in vitro experiments mice were killed using CO2and
terminated via cervical dislocation. All experiments involving animals at the Ludwig-Maximilians-Universität München, Munich, Germany were performed in accordance with the EU Animal Welfare Act and were approved by the District Government of Upper Bavaria, Germany, on animal care (permit no. 55.2-1-54
−2532–134–13). The use of transgenic animals was approved by the District
Government of Upper Bavaria, protocol no. 821–8763.14.718/1210. For in vivo
experiments C57BL/6J, Trpm7R/R, BALB/c and Rag1−/−/Il2rg−/−mice were bred in
a specific pathogen-free facility at the Institute for Research in Biomedicine,
Bel-linzona, Switzerland. For adoptive transfer of T naive, CD4+CD8−CD62L+CD44
−CD25−cells were sorted at FACSAria (BD Biosciences) from pooled cell
sus-pensions of spleen, inguinal, axillary, brachial, cervical and mesenteric LNs of
C57BL/6J and Trpm7R/Rmice. Eight-week-old Rag1−/−/Il2rg−/−mice were injected
with 1 × 10⁶naive T cells. Recipient mice were killed 4 weeks after reconstitution.
For GVHD experiments, lethally irradiated (9 Gy, Cs source) BALB/c (H-2d) mice
were reconstituted within 4–6 h by a single 0.2-ml intravenous inoculum
con-taining 10 × 106B6 BMC alone or in combination with 10 × 106C57BL/6J or
Trpm7R/Rsplenocytes. All animal experiments were performed in accordance with
the Swiss Federal Veterinary Office guidelines and authorized by the Animal Studies Committee of Cantonal Veterinary with authorization numbers TI-10-2013 and TI-17-2015.
Cell isolation and primary cell culture. Lymphocytes infiltrating the intestinal
epithelium were isolated as follows: while the small intestine wasflushed with PBS,
fat and Peyer’s patches were removed. The small intestine was divided
long-itudinally, cut into 2-mm sections and washed twice, in calcium- and magnesium-free HBSS containing 2% fetal calf serum (FCS) (at 4 °C) to remove faeces. The tissue was placed in 50 ml tubes, washed three times in HBSS containing 2% FCS at
4 °C, transferred to 25 cm tissue cultureflasks and incubated at 37 °C in HBSS
containing 10% FCS, 0.2 mmol l−1EDTA, 1 mmol l−1DTT. After 20 min
incuba-tion, theflasks were shaken vigorously for 30 s, and the supernatant containing
IELs and the IEC was separated from the tissue fragments using a 40-μm nylon
filter. While the supernatant was collected and put on ice, the tissue fragments were
retuned to theflasks and the process was repeated. To isolate LPLs, the remaining
tissue was washed three times with RPMI 1640, and intestinal pieces were subse-quently incubated with magnetic stirring for 30 min at 37 °C in cRPMI
supple-mented with 100 U ml−1collagenase. The epithelial and lamina propria cell
suspensions were washed, suspended in RPMI 1640 at 4 °C andfiltered. The cell
suspension was collected and suspended in 40% Percoll, which was layered on top of 80% Percoll and centrifuged at 2000 r.p.m. for 20 min at RT. The IELs and LPLs were collected from the interface between the Percoll gradients and prepared for
phenotypic analysis byflow cytometry. For mRNA extraction, IELs and LPLs were
purified by cell sorting as TCRβ+CD4+Ep-CAM−cells while IEC cells were sorted
as Ep-CAM+cells. For isolation of thymocytes, thymi were homogenized and
washed in RPMI1640 medium containing 10% (v/v) FBS. For the isolation of CD4+
T cells, peripheral lymph nodes were collected, smashed using a 40-μm strain and
CD4+T cells were sorted via magnetic-activated cell sorting (MACS) (CD4+
iso-lation kit, Miltenyi Biotec). Purity was assessed via FACS to at least 96% CD4+
T cells before cells were subjected to experiments. For mast cell isolation, cells
obtained from the peritoneum of WT or Trpm7R/Rmice were pelleted and
apportioned (Cellgro) into Petri dishes with poly-D lysine (PDL)-coated glass cover slips. Cells were cultured in 2 ml DMEM containing 10% FBS (HyClone) and 1% penicillin/streptomycin (Gibco) overnight in a humidified incubator at 37 °C and
5% CO2. For electrophysiological experiments, mast cells were identified visually
using light microscopy (phase contrast).
Cytokine assays. After blood collection through cardiac puncture using a collector for serum separation and blood cells (Microvette, Sarstedt), samples were separated
by 10.000×g centrifugation for 5 min; serum was then stored at−80 °C. Collected
samples were prepared for the 23-cytokines assay (Bio-Rad) and TGFβ-1, 2, 3 assay
Antibodies andflow cytometric analysis. The following mAbs were purchased from BD Biosciences: allophycocyanin (APC)-conjugated anti-CD62l
(clone:MEL-14, cat.#: 17-0621-83, working dilution 1:200), Pacific Blue-conjugated anti-CD8β
(clone: H35-17.2, cat.#: 48-0083-80, working dilution 1:200), PERCP-CYANINE5.5-conjugated anti-IL-17A (clone: 17B7, cat.#: 45-7177-82, working
dilution 1:100),fluorescein isothiocyanate (FITC)-conjugated anti-FOXP3 (clone:
FJK-16s, cat.#: 11-5773-82, working dilution 1:100), Pacific Blue-conjugated
anti-H-2KB (clone: AF6-88.5.5.3, cat.#: 48-5958-82, working dilution 1:200),
APC-conjugated anti-CD11C (clone: N418, cat.#: 17-0114−82, working solution 1:200).
The following mAbs were purchased from Biolegend (http://www.biolegend.com/): PE-conjugated anti-CD44 (clone:IM7, cat.#: 103008, working dilution 1:200), PE/ Cy7-conjugated anti-CD25 (clone: PC61, cat.#: 102016 working dilution 1:200), APC/Cy7-conjugated anti-CD4 (clone: RM4-5, cat.#: 100526, working dilution 1:200), FITC-conjugated anti-CD8α (clone: 53-6.7, cat.# 100706, working dilution 1:200), PE-conjugated anti-TCRβ (clone: H57-597, cat.#: 109208, working dilution
1:200), FITC-conjugated anti-TCRγδ (clone: GL3, cat.#: 118106, working dilution
1:200), PE-conjugated anti-CD103 (clone: 2E7, cat.#: 121406, working dilution 1:200), PE-conjugated anti-α4β7 (clone: DATK32, cat.#: 120606, working dilution 1:200), APC-conjugated anti-β7 (clone: FIB504, cat.#: 321208, working dilution
1:200), Pacific Blue-conjugated anti-MHC-II (clone: M5/114.15.2, cat.#: 107620,
working dilution 1:200), FITC-conjugated anti-Ep-CAM (clone: G8.8, cat.#: 118210, working dilution 1:200), PE-conjugated anti-IFN-γ (clone: XMG1.2, cat.#: 505808, working dilution 1:100). Samples were acquired on a LSRFortessa (BD
Biosciences) or Guava (Merck-Millipore)flow cytometer. Data were analysed using
FlowJo software (TreeStar, Ashland, OR), FACS Diva software (BD Biosciences) or InCyte (Merck-Millipore), respectively.
Quantitative RT-PCR. Total RNA from FACS-sorted cells was precipitated in Trizol (Invitrogen, ThermoFisher) and reverse transcribed to complementary DNA (cDNA) using Random hexamers (Roche, cat.#: R 15504) and M-MLV
reverse-transcriptase (Invitrogen, cat.#: 28025−013). For quantification of transcripts,
mRNA samples were treated with 2 U per sample of DNase (Applied Biosystems).
Transcripts were quantified by real-time PCR on an ABI PRISM 7700 Sequence
Detector with predesigned TaqMan Gene Expression Assays and reagents according to the manufacturerʼs instructions (https://www.lifetechnologies.com). The following probes were used: Trpm7 (Mm00457998_m1), Tbx21
(Mm00450960_m1), Foxp3 (Mm00475162_m1), Rorc (Mm01261022_m1), Il17a (Mm00439619_m1), Itgae (Mm00434443_m1), Tgfβ1 (Mm01178820_m1), Tgfβ2
(Mm00436955_m1), Tgfβ3 (Mm01307950_m1). All reactions were performed in
triplicates. The relative amounts of mRNAs were calculated by theΔΔCT method.
18S and Hprt were used as internal housekeeping genes. For Itgae gene
upregu-lation, CD4+T cells were treated with 5 ng ml−1of TGF-β1 (R&D) for 24 h. Total
RNA was precipitated in Trizol (Invitrogen, ThermoFisher) and cDNA synthesis was performed using SuperScript II RT (LifeTech, Invitrogen) and oligo-dT
pri-mers (18T, Metabion). Real-time-PCR was performed using a PrimePCR™SYBR®
Green Assay for Itgae (Bio-Rad, qMmuCID0039603) and analysed using
Light-Cycler®480 SYBR Green I Master (Roche). Hprt (fwd:
CTCATGGACTGAT-TATGGACAGG, rev: TTAATGTAATCCAGCAGGTCAGC, Metabion) was used as a reference gene. Samples were detected in doublets and the mean CP (crossing
points) values were analysed as 2−ΔΔCP.
In vitro T cell polarization and integrin upregulation. CD4+CD8+CD62L+CD44
−CD25−naive T cells were sorted at FACSAria from pooled suspensions of spleen,
inguinal, axillary, brachial, cervical and mesenteric LNs of WT and Trpm7R/Rmice.
Cells were seeded in a 96-well,flat-bottomed plate in RPMI supplemented with
10% foetal calf serum (FCS) and 1% penicillin and streptomycin. For T cell in vitro polarization, Th1 cells were generated by addition of rmIL-12 at a concentration of
15 ng ml−1, hIL-2 30 U ml−1and anti-IL-4 Ab (clone 11B11) at a concentration of
5µg ml−1into the culture. For the generation of Th17 cells naive T cells were
cultured with rmIL-6 at a concentration of 20 ng ml−1, rmTGF-β at a concentration
of 2 ng ml−1, anti-IFN-γ (clone XMG1.2) and anti-IL-4 Ab at a concentration of 5
µg ml−1. For the generation of Tregcells, naive T cells were cultured with rmTGF-β
at a concentration of 2 ng ml−1, 30 u ml−1hIL-2, anti-IFN-γ and anti-IL-4 Ab at a
concentration of 5µg ml−1. For in vitro CD103 upregulation, T naive cells were
stimulated in presence or absence of rmTGF-β at a concentration of 1 ng ml−1.
After 4 days of stimulation, T cells were collected and stained with anti-CD103 and anti-β7 mAbs.
Intracellular cytokine and transcription factor staining. For intracellular
staining of FOXP3, after surface antigens staining, cells werefixed and
permea-bilized using the Foxp3/transcription factor staining buffer set (eBioscience) according to the manufacturer’s recommendations, followed by staining with anti-FOXP3. For intracellular staining of IFN-γ and IL-17A, cells were stimulated for 4
h with PMA (100 nM, Sigma-Aldrich) and ionomycin (1μM, Sigma-Aldrich).
Brefeldin A (BFA) was included during the last 4 h of activation to inhibit
intra-cellular transport. After surface antigens staining cells werefixed and permeabilized
using the BD Cytofix/cytoperm fixation/permeabilization solution Kit (BD
Bios-ciences) according to the manufacturer’s recommendations, followed by staining
with anti-IFN-γ and anti-IL-17A mAbs.
Immunohistochemistry and digital image analysis. To assess the number of infiltrating T cells, 4 μm sections from each formalin-fixed paraffin embedded small intestinal sample were immunostained with a primary goat polyclonal antibody against CD3 epsilon antigen (Santa Cruz Biotechnology; #Sc-1127). A biotinylated rabbit anti-goat IgG antibody (BA-5000, Vector Laboratories, Bur-lingame, CA, USA) was added for 30 min and sections were then labelled by the avidin-biotin-peroxidase (ABC) procedure with a commercial immunoperoxidase kit (VECTASTAIN Elite ABC HRP Kit, PK-6100, Vector Laboratories, Burlingame, CA, USA). The immunoreaction was visualized with 3,3′-diaminobenzidine (per-oxidase DAB substrate Kit, VC-SK-4100-KI01, Vector Laboratories, Burlingame, CA, USA) substrate and sections were counterstained with Mayer’s haematoxylin. For each sample, serial sections incubated with a 10% solution of normal rabbit
serum served as negative controls. The number of CD3 epsilon+cells and the area
of the intestinal mucosa were evaluated using the ImageJ analysis program (http:// rsb.info.nih.gov/ij/) in ×4200 microscopicfields. The number of T cells per mm2of intestinal mucosa was then calculated.
Transmission electron microscopy. Electron microscopy was preformed as fol-lows: mice ileum and colon was washed with phosphate buffer (0.1 M; pH 7.2).
Tissue wasfixed in 2.5% glutaraldehyde in PB for 3 h, followed by washing the
samples in phosphate buffer three times for 3 h. Samples were treated for 1.5 h with
1% osmium in H2O and increasing alcohol concentrations for dehydration. Finally
samples were embedded in EPON™and propylenoxid (propylenoxide: EPON™=
3:1, 1:1, 1:3; 60 min each) followed by pure EPON™for 2 days by 60 °C. Ultrathin
sections were analysed in a Zeiss transmission electron microscope (EM902A).
Western blot analysis. CD4+T cells were seeded in 24-well plates and stimulated
with 10 ng ml−1IL-6 or 5 ng ml−1TGF-β1 (PeproTech or R&D Systems) for the
indicated time frames. For detection of phosphorylated proteins following anti-bodies were used: pSTAT3 (Tyr705, cat.#: 9131, Cell Signaling, molecular weight (MW) 86 kDa, working dilution 1:2500), pSMAD2 (Ser465/467, cat.#: 138D4, Cell Signaling, MW 60 kDa, working dilution 1:200) and pSMAD3 (Ser423/425, cat.#: C25A9, Cell Signaling, MW 52 kDa, working dilution 1:200). Total proteins were used as loading controls and stained for STAT3 (cat.#: 9132, Cell Signaling, MW 86 kDa, working dilution 1:5000) and SMAD2/3 (cat.#: D7G7, Cell Signaling, MW 60 kDa and 52 kDa, working dilution 1:1000). Cells were lysed with RIPA buffer. Lysates were subjected to SDS-PAGE, and proteins were transferred to
nitro-cellulose by western blotting. Thefirst antibody was incubated overnight at 4 °C.
After washing three times with TBS-T for 5 min, the membrane was incubated with a HRP-conjugated secondary antibody diluted in TBS-T and incubated for 45–60 min at RT. Immune reactivity was quantified by densitometry, ratios between p-SMAD2 or 3 and total p-SMAD2 or three signals, respectively, were calculated, and TGF-β1-induced SMAD phosphorylation was normalized to that of unstimulated cells. Data analysis was performed with the ImageJ analysis program (http://rsb. info.nih.gov/ij/). For analysis of the intensity of TGF-β1-induced SMAD phos-phorylation compared to untreated controls a one-way ANOVA was used. Values
of p< 0.05 (#) were considered significant. CD4+T cells were seeded in 24-well
plates and stimulated with 10 ng ml−1IL-6, 5 ng ml−1TGF-β1 (PeproTech or R&D
Systems) and anti-CD3/anti-CD28-coated beads (Invitrogen) for 10 min39. For
detection of phosphorylated proteins following antibody was used: pSMAD2 (Ser245/250/255, no. 3104, Cell Signaling, MW 60 kDa, working dilution 1:200). Total proteins were used as loading controls and stained for SMAD2 (D43B4, Cell Signaling, MW 60 kDa, working dilution 1:1000). Cells were lysed with RIPA buffer. Lysates were subjected to SDS-PAGE, and proteins were transferred to
nitrocellulose by western blotting. Thefirst antibody was incubated overnight at 4 °
C. After washing three times with TBS-T for 5 min, the membrane was incubated with an HRP-conjugated secondary antibody diluted in TBS-T and incubated for 45−60 min at RT.
In vitro kinase assay. Highly purified recombinant human SMAD2-GST,
C-terminally truncated SMAD2-GST and GST were purchased from SignalChem (Richmond, BC, Canada, S11-30G-250, CUSTOM S11-30G-250, G52-30U-250). The in vitro kinase assay was performed by Reaction Biology Corp. (Woodbridge, CT, USA) following the RBC HotSpot Kinase Assay Protocol. RBC Standard
reaction buffer contained: 20 mM Hepes (pH 7.5), 10 mM MgCl2, 1 mM EGTA, 2
nM MnCl2, 0.02% Brij35, 0.02 mg ml−1BSA, 0.1 mM Na3VO4, 2 mM DTT, 1%
DMSO. Reactions were carried out at 4μM ATP in duplicates and measured at 1 h
and 2 h, respectively. rhSMAD2-GST of 4µM was used as substrate, and 4 µM
rh-trSMAD2-GST as well as the 4µM GST-tag alone were used as control substrates,
while the TRPM7 kinase was titrated in a serial dilution starting at 50 nM. Kinase alone was subtracted as background. RBC standard substrate (MBP) was used as a positive and substrate alone as an additional negative control. Data acquired at 2 h were converted to nM substrate phosphorylation after background subtraction,
averaged and plotted as mean values± s.e.m.
In situ proximity ligation assay. MACS-sorted CD4+T cells from TRPM7R/Ror
WT mice were seeded onfibronectin coated cover slips (Carl Roth GmbH + Co.
KG, cat.#: H873.2) in a six-well plate. After stimulation with 5 ng ml−1TGF-β1