HAL Id: hal-02067432
https://hal.archives-ouvertes.fr/hal-02067432
Submitted on 6 May 2021
HAL is a multi-disciplinary open access
archive for the deposit and dissemination of
sci-entific research documents, whether they are
pub-lished or not. The documents may come from
teaching and research institutions in France or
abroad, or from public or private research centers.
L’archive ouverte pluridisciplinaire HAL, est
destinée au dépôt et à la diffusion de documents
scientifiques de niveau recherche, publiés ou non,
émanant des établissements d’enseignement et de
recherche français ou étrangers, des laboratoires
publics ou privés.
Distributed under a Creative Commons Attribution| 4.0 International License
to POM transfer efficiency
Xavier Mari, Emma Rochelle-Newall, Jean-Pascal Torréton, Olivier Pringault,
Aymeric Jouon, Christophe Migon
To cite this version:
Xavier Mari, Emma Rochelle-Newall, Jean-Pascal Torréton, Olivier Pringault, Aymeric Jouon, et al..
Water residence time: A regulatory factor of the DOM to POM transfer efficiency. Limnology and
Oceanography Bulletin, American Society of Limnology and Oceanography, 2007, 52 (2), pp.808-819.
�10.4319/lo.2007.52.2.0808�. �hal-02067432�
Water residence time: A regulatory factor of the DOM to POM transfer efficiency
Xavier Mari, Emma Rochelle-Newall, Jean-Pascal Torre´ton, Olivier Pringault, and Aymeric Jouon
IRD, UR 103, Noumea Center, BP A5, NC-98848 Noumea, New Caledonia
Christophe Migon
Observatoire Oce´anologique de Villefranche-sur-Mer, Laboratoire d’Oce´anographie de Villefranche-sur-Mer, UMR 7093, La Darse, B.P. 8, F-06238 Villefranche-sur-Mer Cedex, France
Abstract
The pools of dissolved (DOM) and particulate organic matter (POM) and of transparent exopolymeric particles (TEP) were studied along two sampling gradients in the lagoon of New Caledonia in relation to the residence time of the water masses. The efficiency of the transfer of material from the dissolved to the particulate phase via TEP formation, indicating the physicochemical reactivity of organic matter, was investigated. DOM, POM, and TEP concentration increased along the sampling gradients, but their relative proportions varied. The contribution of the TEP pool to POM increased from 20% to 60%, from the most oligotrophic stations to the more anthropogenically affected bays. According to the low density of TEP and to the observed variations of the proportion of TEP compared with more conventional and solid particles, the aggregates formed inside the bays would be either neutrally or positively buoyant, whereas in the vicinity of the coral barrier, they would be negatively buoyant. As a result, the downward export of organic matter inside the bays might be greatly reduced, thereby prolonging the residence time of organic matter in the water column. The efficiency of the DOM/TEP transformation and the TEP turnover rate dropped drastically when the residence time increased from 0 to 50 d, suggesting that the reactivity of organic matter is reduced as it ages. The very high residence time of the water mass inside the bays, constrained by the hydrodynamic circulation inside the lagoon, favors the installation of a feedback system in which organic matter is not exported and is continuously degraded, leading to the formation of refractory DOM with a low physicochemical reactivity. In contrast, organic matter produced in areas in which water mass has a low residence time (i.e., near the coral barrier) is rapidly exported because of its high physicochemical reactivity.
A large fraction (,30%) of the dissolved organic matter (DOM) released by phytoplankton is of high molecular weight (HMW; Carlson et al. 1985; Benner et al. 1992; Amon and Benner 1994), and about half of this HMW-DOM fraction is constituted by highly reactive polysac-charides (Benner et al. 1992). Transparent exopolymeric particles (TEP) are formed by coagulation of DOM (Zhou et al. 1998; Mari 1999; Passow 2000), particularly the more reactive fraction (i.e., HMW-DOM; Zhou et al. 1998). Furthermore, it has been suggested that TEP exist along a size continuum from molecules of .1 kDa (HMW-DOM) to particles of hundreds of microns and that the definition of this pool of organic matter should be extended to include both size fractions to form a single reservoir of TEP (Mari et al. 2001).
The transfer of organic matter from the dissolved to the particulate phases via the TEP pathway is driven by collision mechanisms followed by adhesion. Although
collisions are mostly controlled by external constraints, such as TEP concentration and turbulence, adhesion is driven by the intrinsic sticking properties of TEP pre-cursors. The sticking properties of TEP and, to a larger extent, the surface-active properties of polysaccharides constituting the HMW-DOM fraction are linked to their chemical composition. The high fraction of polysaccharides with sulfate half-ester groups in the HMW-DOM fraction explains the strong propensity of these polysaccharides to form cationic bridges (Kloareg and Quatrano 1988) and hydrogen bonds (Chin et al. 1998). These highly surface-active polysaccharides are known to be the source of TEP (Zhou et al. 1998). However, because the chemical composition of the exudates released by phytoplankton varies as a function of species and physiological status (Aluwihare and Repeta 1999), the primary composition of TEP and, thus, the sticking properties might also vary as a function of the same factors. Another process that could alter the composition, and thus the reactivity of TEP, is bacterial degradation. TEP are always colonized by bacteria (Alldredge et al. 1993; Passow and Alldredge 1994; Mari and Kiørboe 1996) and, thus, could exhibit very high bacterial activities, such as that observed within marine snow aggregates (Muller-Niklas et al. 1994). This process could lead to the dissolution of aggregates (Smith et al. 1992), to a modification of the composition of the attached bacterial assemblages (Moeseneder et al. 2001), and to a modification of its chemical composition by selectively removing bioreactive components (Aluwihare Acknowledgments
We thank the crew of the R/V Coris for their assistance during sampling and P. Ge´rard for providing the nutrient data. We are grateful to S. Ouillon and P. Douillet for helpful discussions on the hydrodynamic parameters. Thanks are due to E. A. Canuel and two anonymous reviewers for constructive comments on the manuscript.
This research was supported by the French National Research Agency (ANR-ECCO program) and by the French Research Institute for Development (IRD).
and Repeta 1999; Amon et al. 2001) leading to the production of recalcitrant DOM (Ogawa et al. 2001). Because of their central role in carbon cycling, DOM and TEP exert a significant effect on the vertical flux of elements in the ocean and on their burial to the deep ocean (Engel et al. 2004). However, the influence of polysaccha-ride aggregation is closely linked to the reactivity of TEP and DOM, which can vary in response to its age and stage of degradation. Other than remineralization, a major determinant of DOM export is by water mass transport In cases in which input rates of DOM match hydrody-namically driven removal rates, DOM will be controlled to a greater extent by physical rather than by biogeochemical processes. However, if input and removal of DOM because of low water mass renewal rates (i.e., long residence times) is imbalanced, the DOM pool will be largely controlled by degradation processes. In other words, long residence time should lead to prolonged bacterial degradation of DOM. Because of topographic constraints, flows are often re-stricted in estuarine and coastal zones, leading to increased residence times. Although the residence time of a water mass potentially controls the biogeochemistry of coastal and estuarine areas, the relationship between hydrodynam-ics and DOM reactivity has long been neglected.
In this study, we investigated the reactivity of DOM and its tendency to form TEP by monitoring both pools of organic matter along two sampling gradients in a lagoon in New Caledonia. To link the reactivity of DOM with its age and stage of degradation, variations of the DOM versus TEP equilibrium were correlated with the residence time of the water mass.
Materials and methods
The study site—The southwest lagoon of New Caledonia is an enclosed, relatively shallow site (,20 m) surrounded by oligotrophic oceanic water. In contrast to the oligo-trophy observed near the coral barrier, the nearshore environment is subject to terrestrial inputs and to both industrial and urban effluents in the bays around the city of Noumea. This results in well-defined gradients of eutro-phication that last throughout the year (Jacquet et al. 2006). Eutrophication in Sainte-Marie Bay (east of Noumea) is mostly due to wastewater outfalls from the Sainte-Marie area (i.e., urban origin). Eutrophication in Grande Rade Bay (west of Noumea) is mainly of industrial origin from the close proximity of a large nickel smelt. In addition to the continuous input of inorganic nutrients and organic matter in the bays, the permanence of this structure is strengthened by a gradient of water mass residence time. Residence time of the water masses—The parameter used to describe the residence time of the water mass is the local e-flushing time (LeFT, d). The replacement efficiency of water masses can be revealed in the study area by the computation of LeFT. The LeFT is a synthetic parameter that indicates the time required for a tracer mass contained within the station (control volume) to be reduced by a factor 1/e (Jouon et al. 2006) by waters coming from outside the lagoon. The shorter the LeFT, the faster the
water masses at the location will be replaced. In contrast, at longer LeFT, water masses are replaced more slowly, leading to higher residence times. The annual average of LeFT at the different stations was calculated from a hydrodynamic model adapted to the studied area taking into account topographic constraints, average wind condi-tion in the lagoon, and tidal cycle (Jouon et al. 2006). This modeling exercise provides estimates of the renewal rates of the water masses in the lagoon (i.e., LeFT), which can be regarded as mean values because the initial parameters used in the model are annual averages of wind conditions. During the sampling period, wind conditions were similar to those used as input parameters in the hydrodynamic model (i.e., well-established trade winds of about 8– 10 m s21); thus, the annual average of LeFT is applicable
to the sampling campaigns.
Sampling—Seawater samples were collected during four sampling occasions in November 2004 with a Teflon pump at 5 m depth for 10 stations. These stations covered two gradients that started in two distinct eutrophied bays (Sainte Marie and Grande Rade) around the city of Noumea and extended to the exterior of the barrier reef (Fig. 1). The sites were divided into six groups (i.e., open ocean, near barrier, middle of the lagoon, mouth of the bays, middle of the bays, and head of the bays). CTD casts were used on each sampling occasion to determine the presence of vertical stratification. After sampling, seawater samples were kept in 30-liter polycarbonate bottles out of direct sunlight until returned to the laboratory within 1– 2 h. Each transit was studied twice over a 2-week period, and all stations along each transit were sampled within 1 h. Pigments and nutrients—Unfiltered replicate 40-mL samples were immediately frozen pending nitrate+ nitrite Fig. 1. Map of the study area with position of the sampling stations. The stations D and N are localized in the bays of Grande Rade and of Sainte Marie, respectively.
(NOx), and phosphate (PO324 ) analyses. Silicate was
determined on one 60-mL subsample, which was immedi-ately frozen after sampling. Nitrate and nitrite concentra-tions were determined according to Raimbault et al. (1990) on a Bran+Luebbe Autoanalyzer III with an average coefficient of variation (C.V.) of 3% (eutrophic) to 8% (oligotrophic) between replicates. Phosphate and total silicate (dissolved and colloidal) concentrations were de-termined according to Grasshoff et al. (1983). Phosphate concentrations were determined on a Bran+Luebbe Auto-analyzer III with an average C.V. of 6% to 11% between replicates. The N : P molar ratios (mmol L21: mmol L21)
were calculated as the sum of dissolved nitrite, nitrate, and ammonia concentrations divided by phosphate concentra-tions. Chlorophyll a (Chl a) was determined fluorometri-cally from duplicate 200-mL subsamples filtered onto 25-mm Whatman GF/F filters.
Nutrient measurements were conducted on unfiltered samples to avoid contamination during filtration. This procedure is similar to the method used for DOC measurements in oligotrophic waters. A test conducted with filtered and unfiltered samples collected in the middle of the lagoon and in the bay of Sainte Marie showed that NOx and PO324 concentrations were not significantly
different in the lagoon (t-test, p . 0.05) whether the samples were filtered or not, whereas they were significant-ly different (t-test, p , 0.05) with the samples from the bay. For the bay samples, the concentration of NOx increased
slightly when the samples were filtered (i.e., from 0.855 6 0.011 to 0.924 6 0.043 mmol L21 for the unfiltered and
the filtered samples, respectively). On the contrary, the concentration of PO32
4 decreased very slightly when the
samples were filtered (i.e., from 0.267 6 0.003 to 0.247 6 0.011 mmol L21for the unfiltered and the filtered samples,
respectively). This test shows that filtration increases variability, which suggests that filtration rather than freezing alters nutrient concentrations in oligotrophic waters.
Microscopic TEP determination—TEP were stained with Alcian blue (Alldredge et al. 1993) and TEP size spectra were determined from 5- and 10-mL subsamples filtered onto 0.2-mm polycarbonate filters after transfer of the particles retained onto a microscope slide (Passow and Alldredge 1994). TEP size spectra were determined for each slide by counting and sizing TEP at two successive magnifications (3250 and 3400) with a compound light microscope. Ten images were taken per slide and for each magnification. The equivalent spherical diameter of each TEP (dp, mm) was calculated by measuring its
cross-sectional area with an image analysis system (ImagePro Plus, MediaCybernetics), and counts were combined and classified into 20 logarithmic size classes (Mari and Burd 1998). TEP size distributions were described by a power relation of the type dN=d(dp) ~ kdpd, where dN is the
number of particles per unit volume in the size range dpto
[dp + d(dp)]. The spectral slope, d, describes the size
distribution and was estimated from regressions of log[dN/d(dp)] versus log(dp). The TEP volume
concentra-tion was calculated from the TEP size spectra assuming a spherical volume for each particle.
Colorimetric TEP determination—The semiquantitative colorimetric TEP method, developed by Passow and Alldredge (1995), allows the determination of TEP concentration (TEPspectro; xanthan equivalents per liter)
by measuring the total amount of Alcian blue adsorbed to all particles, including TEP, that contain carboxylated and sulfated polysaccharides. Two aliquots (100 and 200 mL) of each sample were filtered through 0.4-mm pore size polycarbonate filters at low and constant vacuum pressure (,150 mbar). Particles retained on filters were stained with 500 mL of Alcian blue solution. After staining, filters were rinsed with Milli-Q water and were frozen for later analysis. Filters were transferred to 20-mL polyethylene scintillation vials with 6 mL of H2SO4 and were soaked for .2 h.
During this period, the vials were agitated to ensure TEP dissolution. The amount of dye bound to particles was determined by measuring adsorption at 787 nm (wave-length of adsorption maximum of Alcian blue) with a spectrophotometer (Perkin-Elmer, Lambda 20). Blanks were taken between each sample with 5 mL of distilled water.
TEP carbon concentration—Estimates of TEP carbon concentration (TEP-C) were calculated two ways. First, by combining TEP size spectra with the relationship giving the carbon content of a given TEP particle according to its size (Mari 1999). Thus, TEP carbon concentration (TEP-Cmicro,
mg C L21) is given by TEP-C
micro50.25 31026 Pinir2:55i ;
where ni and ri are, respectively, the concentration of
particles and the equivalent spherical radius of the TEP particle in size class i. Second, TEP carbon concentration (TEP-Cspectro, mg C L21) was calculated from colorimetric
determinations (Engel and Passow 2001) as follows: TEP-Cspectro 5 0.75TEPspectro/V, where TEPspectro is the TEP
concentration (mg xanthan equivalent L21) and V is the
volume filtered (mL).
Dissolved organic carbon, nitrogen, and phosphorus determination—Dissolved organic carbon (DOC) analyses were performed on 10-mL subsamples collected in pre-combusted (450uC, overnight) 10-mL glass ampoules, preserved with 12 mL of 85% phosphoric acid (H3PO4),
and flame sealed. Samples were stored in the dark until analysis. DOC concentration was measured on a Shimadzu TOC VCPH analyzer with potassium phthalate calibration standards over the measurement range 0–250 mmol C L21.
Certified reference materials (Hansell Laboratory, Univer-sity of Miami, Florida) were also used to assess the performance of the instrument on and between measure-ment days. The machine blank was between 5 and 10 mmol C L21 for the measurement days. Total organic
nitrogen (TON) and phosphorous (TOP) were determined from unfiltered replicate 120-mL samples immediately frozen until analysis. After mineralization of organic material by wet oxidation (Raimbault et al. 1999), phosphate and nitrate were measured as described above. Dissolved organic nitrogen (DON) and phosphorous
(DOP) were computed by subtracting corresponding dissolved inorganic and particulate organic nutrients from TON or TOP. The C : N : P molar ratios were obtained in terms of DOC : DON : DOP from the bulk dissolved fraction.
Particulate organic carbon, nitrogen, and phosphorus determination—Particulate organic carbon (POC) and particulate nitrogen (PN) were measured from 2.5-L subsamples (one for each sampling station) immediately filtered onto 25-mm Whatman GF/F filters precombusted at 550uC for 2 h. After filtration, the filters were dried at 60uC for 24 h and then frozen for later analysis. Analyses were carried out with a LECO-900 CHN analyzer calibrated with ethylenediaminetetraacetic acid standards. For the determination of organic carbon, carbonates were removed with 100-mL of 2 mol L21HCl and renewed until
there was no longer any effervescence. Acidified samples were kept in a drying oven (60–70uC) for 24 h. Detection limits were 40 and 10 mg for carbon and nitrogen, respectively. Particulate organic phosphorus (POP) was measured by an autoanalyzer from 500-mL subsamples (one for each sampling station) filtered on GF/F Whatman filters (Mullin and Riley 1955). The C : N : P molar ratios were obtained in terms of POC : PN : POP from the bulk particulate fraction.
Particulate and dissolved primary production—Particulate and dissolved primary production (PP and DPP, respec-tively) were measured according to NaH14CO
3(Maran˜o´n
et al. 2005). Duplicate 63-mL water samples were in-oculated with either 0.22, 0.44, or 0.66 MBq of 14C,
depending on the anticipated trophic status of the sample, and incubated in a flowing seawater incubation system. Neutral density screening was used to provide a gradient of irradiance. After 4 h of incubation, samples were carefully filtered at low vacuum pressure onto 0.4-mm polycarbonate filters (Whatman Cyclopore). After acidification and drying, 5 mL of scintillation cocktail (Ultima Gold, Packard Instruments) was added. The amount of 14C
incorporated into the particulate phase (PP) was calculated with the use of an inorganic carbon concentration of 25,700 mg C L21 (Maran˜o´n et al. 2004). For the DPP
measurement, 5 mL of filtrate was collected, acidified with 100 mL of 5 mol L21HCl, and left for 12 h on a horizontal
agitator table. A test before the incubations showed that the volume of acid and agitation time was sufficient to remove all the inorganic14C remaining in the filtrate. After
acidification, 15 mL of scintillation cocktail (Ultima Gold XR, Packard Instruments) was added, and the samples were counted. The values of PP and DPP were transformed into water column integrated rates by the trapezoidal method (Maran˜o´n et al. 2004), taking in account the water column light distribution of the sample site and the actual irradiation received by the samples.
Reactivity of DOM—Because TEP are produced by coagulation of precursors of colloidal size, the TEP pool takes its roots in the dissolved phase. Because TEP are formed from DOC via coagulation of dissolved and
colloidal polysaccharides, the TEP-C : DOC ratio can be used to estimate the fraction of reactive DOC that could enter into coagulation mechanisms. In addition, consider-ing that the carbon content of a given TEP particle is a conservative property and assuming that TEP stainability depends on its solid volume and, thus, its carbon content, both approaches used to estimate TEP-C (microscopic and colorimetric) should give similar results. Discrepancy between the results obtained from the two methods could result if (1) Alcian blue is retained by particles other than TEP or (2) TEP stainability varies (e.g., because of bacterial degradation or modification of TEP composition) (Mari et al. 2005). Therefore, the ratio between TEP-C concentrations estimated spectrophotometrically (TEP-Cspectro, mmol L21) and microscopically (TEP-Cmicro,
mmol L21) was used to indicate an alteration of TEP
composition and structure.
Results
Physical characteristics, nutrients, and pigments—The physical characteristics were relatively conservative along the two transects (Table 1). Temperature and salinity averaged (mean 6 SD) 24.3 6 0.7uC and 36.0 6 0.2, respectively, and no vertical stratification was observed (data not shown). The somewhat higher salinity in Grande Rade and Sainte Marie Bays relative to the open ocean sites is probably linked to longer residence times in the bays, providing more time for evaporation to take place.
Nutrient concentrations increased continuously from the open ocean to the head of the bays (Table 1). Maximum concentrations (mean 6 SD) of inorganic nitrogen (0.29 6 0.06 mmol L21) and phosphorus (0.10 6 0.00 mmol L21)
were recorded in the head of Sainte Marie Bay (station N04). Maximum concentrations of silicates (7.87 6 2.58 mmol L21) were measured at the head of Grande
Rade Bay (station D01). Both transects were characterized by an inorganic nitrogen limitation (N : P , 5; Table 1). The distribution of pigments largely follows that of nutrients, with maximum concentrations in the head of the bays (1.68 6 0.63 mg Chl a L21 and 0.21 6 0.10 mg
phaeopigments L21; mean 6 SD) that rapidly decrease to
reach a minimum outside the bays (Table 1).
The estimated LeFT at the different stations varies from 0 to ,50 days for the open ocean and the head of the Grande Rade Bay stations, respectively (Table 1). One of the two studied bays (Grande Rade Bay) is semienclosed, and the water mass renews very slowly (LeFT . 30 d) compared with the other stations. The LeFT is .10 d inside the two bays and varies between 0 and 10 d at the studied stations in the middle of the lagoon. By definition, the LeFT of the water mass outside the lagoon (station M41) is set to zero (initial parameter of the model).
Elemental composition of DOM and particulate organic matter—The DOM and particulate organic matter (POM) pools had an average C : N : P stoichiometry (mean 6 SD) of 425 (6129) : 32 (68) : 1 and of 70 (630) : 10 (64) : 1, respectively (Fig. 2). The average C : P, N : P, and C : N for both the dissolved and the particulate phase varied between
sampling sites and decreased slightly toward the bays. Although the measured C : N : P ratios for bulk DOM deviated considerably from the Redfield ratio (i.e., the C : N and C : P of DOM were 110% and 330% higher than the Redfield ratio), POM stoichiometry was similar to Red-field. This suggests that although the production of biomass is N-limited for all stations, the biomass produced does not exhibit a N deficit. On the contrary, the organic matter fixed during photosynthesis and directly channeled to the dissolved phase exhibits strong deficits in both nitrogen and phosphorus.
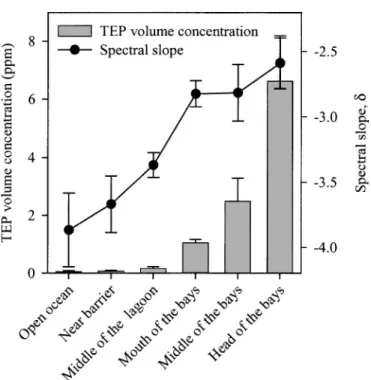
Distribution and dynamics of organic matter pools—TEP occurred at all sampling occasions (Fig. 3). TEP volume Fig. 2. Variations of C : N : P ratios in the dissolved (open bars) and particulate (filled bars) organic matter along the transects. The dashed lines represent the Redfield C : N : P ratios of 106 : 16 : 1. Each value corresponds to the average (6SD) of four measurements taken for each group of stations.
Table 1. Environmental characteristics at the sampling stations: temperature, salinity, dissolved inorganic nitrogen (DIN), dissolved inorganic phosp horus (DIP), DIN :DIP ratio, silicate, Chl a , phaeopigments, and local e-flushing time (LeFT, as calculated from Jouo n et al. 2006). Each value corresponds to the average (6 SD) of four measurements taken for each group of stations. Trophic groups Stations Temperature (u C) Salinity DIN (m mol L 2 1) DIP (m mol L 2 1) DIN :DIP Silicate (m mol L 2 1) Chl a (m gL 2 1) Phaeopigments (m gL 2 1) LeFT (d) Head of the bays D01 25.1 6 0.3 36.1 6 0.0 0.21 6 0.02 0.08 6 0.02 2.67 7.87 6 2.58 1.64 6 0.25 0.17 6 0.01 46.9 N04 24.5 6 0.3 36.1 6 0.1 0.29 6 0.06 0.10 6 0.04 3.38 3.74 6 0.19 1.72 6 1.06 0.25 6 0.15 17.1 Middle of the bays D08 25.3 6 0.2 36.1 6 0.0 0.15 6 0.04 0.05 6 0.03 3.81 5.05 6 0.24 0.88 6 0.05 0.07 6 0.01 40.8 N12 24.6 6 0.1 36.2 6 0.0 0.19 6 0.07 0.06 6 0.02 3.18 3.42 6 0.42 1.12 6 0.33 0.18 6 0.03 12.9 Mouth of the bays D22 24.8 6 0.2 36.1 6 0.0 0.09 6 0.02 0.03 6 0.01 2.98 3.13 6 0.87 0.47 6 0.06 0.06 6 0.01 31.0 N33 24.6 6 0.0 36.1 6 0.0 0.09 6 0.01 0.02 6 0.02 5.33 3.02 6 0.44 0.38 6 0.05 0.06 6 0.01 12.4 Middle of the lagoon M05 24.3 6 0.2 35.8 6 0.0 0.05 6 0.00 0.02 6 0.00 2.12 2.71 6 0.60 0.31 6 0.04 0.04 6 0.02 5.6 M33 24.0 6 0.0 35.8 6 0.0 0.06 6 0.00 0.01 6 0.01 5.56 2.10 6 0.24 0.30 6 0.00 0.03 6 0.00 0.5 Near barrier M10 23.9 6 0.2 35.8 6 0.0 0.06 6 0.01 0.02 6 0.01 3.14 2.32 6 0.84 0.31 6 0.05 0.04 6 0.02 0.4 Open ocean M41 23.3 6 0.3 35.7 6 0.0 0.05 6 0.01 0.04 6 0.03 3.07 1.85 6 0.36 0.19 6 0.09 0.06 6 0.04 0.0
concentrations varied between 0.05 6 0.03 and 6.62 6 1.56 ppm (mean 6 SD) and increased from the coral barrier toward the head of the bays. As indicated by the increase of the TEP spectral slope, d, the observed increase in TEP volume concentration likely results from an increase of the large TEP fraction.
The carbon trend (mean 6 SD) within the different pools of organic matter increased along the offshore gradient, from 0.5 6 0.1 to 3.9 6 0.3 mmol L21, from 2.8 6 1.4 to 7.9
6 3.5 mmol L21, and from 63.1 6 3.1 to 74.7 6
6.1 mmol L21 for TEP, POC, and DOC, respectively
(Fig. 4). TEP-C concentration was positively correlated to both DOC (DOC 5 3.9TEP-C+ 58, r250.85, p , 0.05, n
510) and POC concentrations (POC 5 1.54TEP-C+ 1.65, r25 0.84, p , 0.05, n 5 10), and POC concentration was
positively correlated to DOC concentration (POC 5 2.2TEP-C + 56, r2 5 0.80, p , 0.05, n 5 10). Because
TEP are formed from DOC, the y-intercept of the regression line of DOC versus TEP-C represents the minimum DOC concentration required to sustain TEP production (i.e., TEP are only formed when the critical DOC concentration of ,60 mmol L21 is reached). The
above relationships were used to determine the relative fraction of each pool of organic matter along the gradient. The pools of TEP-C and of POC represented, respectively, ,1% and 4% of DOC at the open ocean station and increased up to ,5% and 10% in the head of the bays. The Fig. 3. Variations of TEP volume concentration and of TEP
spectral slopes, d, along the sampling gradient. Each value corresponds to the average (6SD) of four measurements taken for each group of stations.
Fig. 4. Variations of TEP-carbon, POC, and DOC concentrations along the sampling gradient. Each value corresponds to the average (6SD) of four measurements taken for each group of stations.
contribution of TEP to POC was low at the most oligotrophic stations (18%) and reached a plateau in the lagoon and in the bays at about 60%.
Organic matter reactivity—The TEP-C : DOC ratio, used to estimate the fraction of reactive DOC entering into coagulation mechanisms and fuelling the TEP pool, was plotted against the LeFT to estimate DOC reactivity as a function of the residence time of the water mass. The variations of the TEP-C : DOC ratio as a function of the LeFT was best described by a hyperbolic relation (Fig. 5). The TEP-C : DOC ratio increased when the LeFT increased (i.e., the formation of TEP-C from DOC becomes less efficient as residence time increases). The reactivity of DOM can be evaluated by calculating the derivative of the ratio TEP-C : DOC versus LeFT, which gives the relative production rate of TEP-C from DOC per day (Fig. 5). This exercise shows that DOM reactivity decreases rapidly as the residence time of the water mass increases, to reach its minimum in the head of the semienclosed bay of Grande Rade. The variations of the TEP-Cspectro: TEP-Cmicroratio
support this view (Fig. 6). The observed decrease of the TEP-Cspectro: TEP-Cmicro ratio as a function of the
residence time of the water mass indicates that TEP stainability is reduced when the LeFT increases; such a diminution being most likely because of the long-term degradation of organic material. TEP turnover rates were calculated as a function of the LeFT from (1) the concentrations of TEP-C and of DOC extrapolated from TEP-C and DOC versus LeFT regression lines and (2) from the relative production rates of TEP-C from DOC per day. The estimated TEP turnover rate drops from 0.3 to 0.0 d21
when the residence time of the water mass increases (i.e.,
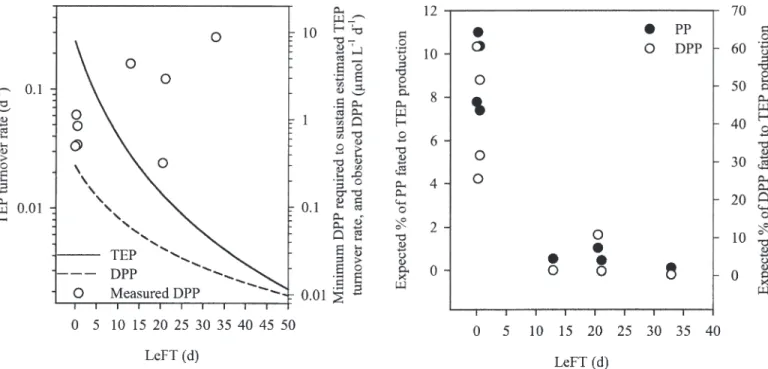
when the LeFT increases from 0 to 50 d), and such turnover rates require a minimum primary production of d i s s o l v e d o r g a n i c c a r b o n ( D P P ) o f 0 . 2 0 t o 0.02 mmol L21d21 (Fig. 7). The theoretical minimum
DPP required to sustain the calculated TEP turnover rate was estimated from (1) TEP-C and DOC versus LeFT Fig. 5. DOC reactivity as estimated by the TEP-C : DOC ratio (solid line) and TEP
production rate (dashed line, estimated as the derivative of the hyperbolic fitting of TEP-C : DOC ratio vs. LeFT) as a function of LeFT. The hyperbolic regression line (solid line) was fitted to the data.
Fig. 6. Relationship between TEP-C concentrations estimat-ed from the colorimetric and the microscopic methods as a function of LeFT.
regression lines and the (2) calculated TEP turnover rates. Over the range of primary production of DOC and POC measured in the lagoon for water mass with different LeFT, the fraction of DPP going into TEP production decreased from 42.4 6 16.5% (LeFT , 10 d) to 3.4 6 4.9% (LeFT . 10 d), which represented a diminution from 9.1 6 1.8% to 0.5 6 0.4% of the total PP (Fig. 8).
Discussion
Characteristics of the sampling gradient—The two transects were characterized by a well-established nutrient gradient, as already reported by Jacquet et al. (2006). The concentration gradients of nitrogen and phosphorus reflect the dominance of nutrient inputs from an urban origin in Sainte Marie Bay and the dominance of nutrient inputs from an industrial origin in Grande Rade Bay. The temporal variability of nutrient concentrations along the transects is believed to be controlled by sources external to the lagoon (atmospheric input, surrounding oceanic waters, land drainage). Insofar as oceanic waters exhibit low nutrient concentrations, the land-based input is much more likely to affect nutrient concentration levels, as revealed by the gradient of silicates from the head of the bays to the barrier. The similarities observed between lagoonal (except middle and head of the bays) and oceanic waters could be due to substantial water exchange through the passes. However, water exchange between oceanic and lagoonal waters greatly depends on the hydrodynamic circulation, which is controlled by topographic constraints, wind condition, and tidal cycle. In semienclosed bays, such as the bay of Grande Rade, water exchange with lagoonal
water and, to a larger extent with oceanic water, is a very slow process. Therefore, the land-based input of nutrients in such bays might mostly fuel a local production and can be recycled several times before being exported to more oligotrophic waters.
DOC production variability—Previous studies have demonstrated that the percentage of extracellular release (PER) ranges from 5% to 30% of total carbon fixed (Baines and Pace 1991; Biddanda and Benner 1997; Maran˜o´n et al. 2005). We observed an average PER of 27 6 14% (minimum 10%, maximum 43%), and no specific trend was observed along the sampling gradient similar to the recent results of Moran et al. (2004). In contrast, the percentage of DOC production ending in TEP ranged from 3% to 40% in nutrient-rich and oligotrophic waters, respectively. This suggests that although the relative rate of production of DOC does not vary in a consistent manner with nutrient concentrations, the fate of that DOC does depend on the nutrient conditions. Why this might be is undoubtedly related to the physicochemical properties of the DOM precursor material for TEP.
One caveat needs to be kept in mind in the interpretation of these data. The primary production measurements were not made contemporaneously with the other measure-ments; however, it is improbable that there existed a large difference in trophic status between the two sampling periods that differed only by a few weeks (Jacquet et al. 2006).
Effects of the residence time on DOC reactivity—In this study, we used the efficiency of the DOC/TEP trans-formation as an index of the physicochemical reactivity of DOM. Our results strongly suggest that reactivity is Fig. 7. TEP turnover rate (solid line) and minimum dissolved
primary production (DPP; dashed line) required to sustain the estimated TEP turnover rates as a function of LeFT and compared with measured DPP (open circles). DPP are integrated values on the water column.
Fig. 8. Estimated fraction of dissolved and total primary production fated to TEP production as a function of LeFT.
lowered when DOC ages because of prolonged retention (i.e., at long residence times). The peculiar hydrodynamic circulation inside the lagoon and especially in semienclosed bays allows the accumulation and aging of DOM, as well as the subsequent loss of physicochemical reactivity caused by bacterial degradation processes. Such a feedback system in which organic matter is continuously degraded could lead to the formation of refractory DOM with low physico-chemical reactivity. The observed discrepancy between estimates of TEP-C obtained from the microscopic and spectrophotometric methods shows that TEP retain less Alcian blue in the bays than in water masses characterized by low LeFT, supporting the hypothesis that the observed decrease of organic matter reactivity is caused by prolonged bacterial degradation. Such a reduction in TEP stainability because of increasing porosity leads to an overestimation of the TEP-C concentration by the microscopic method, the latter only relying on the apparent structure of the particles and not on their carbon content. This mechanism of increasing porosity of TEP has already been described at the end of Phaeocystis blooms (Mari et al. 2005), during which high bacterial degradation and low TEP production occur. Although a reduction of DOC reactivity is not likely to occur in the surface layer of open ocean sites because DOC turnover is high (Hopkinson and Vallino 2005), it could well occur on a vertical scale as DOC ages during its transport to the deep ocean.
One of the alternative reasons for the presence of DOM with different reactivities in the bay heads could be because of the proximity of potential terrestrial and riverine influences. However, the effects of terrestrial and riverine inputs on the two bays studied are probably minimal. Indeed, riverine influences are extremely weak relative to the oceanic influences in this environment, as is easily seen in the lack of a significant salinity gradient even at the bay heads. Nevertheless, a small degree of terrestrial or riverine influence of DOM characteristics cannot be completely ruled out because we did observe an increase in long-wavelength absorption of CDOM in the samples (data not shown). This can be interpreted as evidence of a terrestrial component in the DOM pool. However, as pointed out by Rochelle-Newall et al. (2004), increases in long-wave absorption of CDOM cannot always be interpreted as being indicative of the presence of terrestrial DOM because diagenetically altered DOM can also exhibit the same signature. Therefore, given the low riverine and terrestrial influences on these two sites, it is improbable that a large proportion of the DOM present is of terrestrial origin. Thus, the DOM present in the bays is probably derived from another source.
Other mechanisms could potentially lead to a reduction of the transfer efficiency from DOM to POM. The chemical composition of exopolymers released by phytoplankton (Aluwihare and Repeta 1999) or bacterioplankton (Stoder-egger and Herndl 1998) varies as a function of species and physiological status. Because the chemical composition of exopolymers determines their physicochemical properties, one might expect a modification of DOM reactivity depending on its source. Therefore, variations in bacterio-and phytoplankton community composition along the
gradients (Jacquet et al. 2006) could also play a role in the observed variations of DOM reactivity. Finally, because metals bind to exopolymers, these elements might affect their surface charge distribution and their confor-mation, which in turn, would most likely alter their sticking properties and their tendency to coagulate. Therefore, the transfer efficiency of DOM to POM in the bays around Noumea might also be modified because of the high metal concentrations resulting from industrial pollution.
Potential consequences for vertical flux of POM—It has been shown that TEP density ranged from 0.70 to 0.84 g cm23 and, thus, was lower than that of seawater
or that of more conventional particles (Azetsu-Scott and Passow 2004). As a result, the relative proportions of TEP, solid particles (i.e., non-TEP particles) and interstitial water within an aggregate, as well as their respective densities, govern its vertical transport velocity and direction (upward or downward; Azetsu-Scott and Passow 2004). Assume for a moment that the relative proportions of TEP and solid particles within aggregates relate to their relative propor-tions in seawater. Because the contribution of TEP to the bulk POC decreased from 60% to ,20%, from the head of the bays to the open ocean, the contribution of TEP within organic aggregates might also decrease in the same proportions along the studied transects. Therefore, one could hypothesize that an aggregate from the head of the studied bays we studied should be composed of 60% TEP-C and 40% non–TEP-TEP-C, whereas it should be composed of ,20% TEP-C in the vicinity of the coral barrier. Assuming that the non-TEP fraction of the POC is mainly composed of protist plankton, the volume occupied by non-TEP particles can be estimated from the non–TEP-C as [C] 5 0.760V0.819, where [C] (pg C) is the carbon concentration of
the non-TEP fraction of POC and V (mm3) is the volume
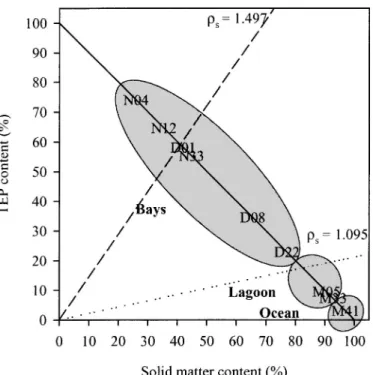
occupied (Menden-Deuer and Lessard 2000). According to the above assumptions, the non-TEP fraction would occupy from 1.7 to 3.4 ppm compared with 0.1 to 6.6 ppm for the TEP fraction, respectively, from the open ocean to the head of the bays. This means that aggregates occurring in the head of the bays could consist of ,65% TEP and 35% non-TEP in terms of volume, whereas TEP volume content inside aggregates occurring in the vicinity of the coral barrier could drop down to 3%. Over the range of measured densities for solid matter of large aggregates (i.e., from 1.095 to 1.497 g cm23; Azetsu-Scott and
Johnson 1992) and assuming that aggregates contain no interstitial water, aggregates occurring inside the bays would encompass a range from neutrally to positively buoyant, and they would become negatively buoyant in the vicinity of the coral barrier (Fig. 9). A consequence would be a rapid sinking of aggregates and an efficient downward export of organic matter near the coral reef. On the contrary, the downward export of organic matter inside the bays could simply come to a stop, and even reverse (i.e., upward flux of matter), thereby prolonging the residence time of organic matter in the water column. These two opposing pathways probably play an important role in regulating the export versus recycling balance in areas structured by strong hydrodynamic constraints.
Implication for DOM cycling in the coastal zone—The decreasing reactivity of DOM during aging of the water masses could corroborate the observed accumulation of DOM in the coastal zone. DOC accumulation has been reported in various areas in the coastal zone (e.g., Zweifel et al. 1995), and it has been shown that the fraction of DOC that accumulated was mainly composed of polysaccharides (e.g., Biersmith and Benner 1998). Various explanations have been proposed to account for the observed accumu-lation in the coastal zone, such as a malfunctioning microbial loop caused by nutrient limitation (Thingstad et al. 1997). The present data give a new insight into this issue and might help complete the puzzle, because the accumu-lation of DOM caused by positively buoyant TEP in poorly renewed water masses might also lead to the buildup of a large C-rich (and N- and P-poor) pool of organic matter. Interestingly, the occurrence of giant mucus particles in the northern Adriatic Sea (Herndl 1992) might
be the result of very low renewal rate of the water masses (Grilli et al. 2005). Hence, the excess DOM produced would somehow be trapped in areas in which the residence time of the water masses is high, promoting degradation of the labile fraction and a loss of reactivity. Thus, the accumulation of DOM in the coastal zone would be constrained by both the biological activity and hydrody-namics. This scheme is contradictory to the present paradigm that DOM occurring in the coastal zone is highly labile and reactive because it is produced locally from DPP fuelled by terrestrial nutrient inputs. As a result, in coastal ecosystems characterized by low renewal rates of water, the pathway for DOM would be unbalanced from export to local remineralization.
The results of this work highlight the relevance of knowing the chemical composition of DOM along resi-dence time gradients to determine whether specific biomo-lecules in DOM vary accordingly along the same pattern as described along depth gradients. Depth profile studies have demonstrated that total hydrolysable neutral sugars, amino acids, and amino sugars decrease from the surface to deep waters, from .200 to ,50 nmol L21, from .200 to
,160 nmol L21, and from .40 to ,10 nmol L21,
re-spectively (Benner 2002). Shifts in the relative proportion of biomolecules can be used as an indicator of the degree of alteration of DOM (Dauwe et al. 1999). Clearly, data on the concentrations and distributions of biomolecules along residence time gradients are needed to further investigate the link between the renewal rate of water masses and the transfer efficiency from DOM to POM. The study of the mechanisms leading to a diminution of the bioreactivity of DOM along horizontal gradients of residence time might help us understand the mechanisms by which refractory DOM is formed with increasing depth.
References
ALLDREDGE, A. L., U. PASSOW, AND B. E. LOGAN. 1993. The
abundance and significance of a class of large, transparent organic particles in the ocean. Deep-Sea Res. I 40: 1131–1140. ALUWIHARE, L. I., ANDD. J. REPETA. 1999. A comparison of the
chemical characteristics of oceanic DOM and extracellular DOM produced by marine algae. Mar. Ecol. Prog. Ser. 186: 105–117.
AMON, R. M. W.,ANDR. BENNER. 1994. Rapid cycling of high–
molecular-weight dissolved organic matter in the ocean. Nature 369: 549–552.
———, H.-P. FITZNAR, ANDR. BENNER. 2001. Linkages among
the bioreactivity, chemical composition, and diagenetic state of marine dissolved organic matter. Limnol. Oceanogr. 46: 287–297.
AZETSU-SCOTT, K.,ANDB. D. JOHNSON. 1992. Measuring physical
characteristics of particles: A new method of simultaneous measurement for size, settling velocity and density of constituent matter. Deep-Sea Res. 39: 1057–1066.
———, AND U. PASSOW. 2004. Ascending marine particles:
Significance of transparent exopolymer particles (TEP) in the upper ocean. Limnol. Oceanogr. 49: 741–748.
BAINES, S. B.,ANDM. L. PACE. 1991. The production of dissolved
organic matter by phytoplankton and its importance to bacteria: Patterns across marine and freshwater systems. Limnol. Oceanogr. 36: 1078–1090.
Fig. 9. Model depicting the density of aggregates as a func-tion of the TEP and solid particle volume fracfunc-tions in aggregates and of the solid particle density (rs) (from Azetsu-Scott and Passow 2004). The two density lines indicate the relationships between the volume fractions of TEP and of solid particles for neutrally buoyant aggregates, as calculated for the upper (rs 5 1.497 g cm23; dashed line) and lower (r
s51.095 g cm23; dotted line) limits of measured solid particle densities inside large aggregates. The solid line describes aggregates for which there is no interstitial water (i.e., aggregates only composed of TEP and solid particles). The estimated densities of aggregates occurring at the different sampling stations are represented. Aggregates with a density occurring in the domain constrained above a specific density line for solid matter will be positively buoyant, whereas below this line, aggregates will be negatively buoyant. Aggregates occurring in the bays of Grande Rade and Sainte Marie should be from neutrally to positively buoyant, assuming a density for the solid matter of rs51.095 g cm23. Inversely, aggregates occurring from the middle of the lagoon to the open ocean should sink. The value for station M10 is the same as for station M41.
BENNER, R. 2002. Chemical composition and reactivity, p. 59–90.
In D. A. Hansell and G. A. Carlson [eds.], Biochemistry of marine dissolved organic matter. Academic Press.
———, J. D. PAKULSKY, M. MCCARTHY, J. I. HEDGES,ANDP. G.
HATCHER. 1992. Bulk chemical characteristics of dissolved
organic matter in the ocean. Science 255: 1561–1564. BIDDANDA, B., AND R. BENNER. 1997. Carbon, nitrogen, and
carbohydrate fluxes during the production of particulate and dissolved organic matter by marine phytoplankton. Limnol. Oceanogr. 42: 506–518.
BIERSMITH, A., AND R. BENNER. 1998. Carbohydrates in
phyto-plankton and freshly-produced dissolved organic matter. Mar. Chem. 63: 131–144.
CARLSON, C. A., M. L. BRANN, T. H. MAGUE, AND L. MAYER.
1985. Molecular weight distribution of dissolved organic matter in seawater determined by ultrafiltration: A reexami-nation. Mar. Chem. 16: 155–171.
CHIN, W., M. W. ORELLANA,ANDP. VERDUGO. 1998. Spontaneous
assembly of marine dissolved organic matter into polymer gels. Nature 391: 568–570.
DAUWE, B., J. J. MIDDELBURG, P. M. J. HERMAN,ANDC. H. R.
HEIP. 1999. Linking diagenetic alteration of amino acids and bulk organic matter reactivity. Limnol. Oceanogr. 44: 1809–1814.
ENGEL, A.,ANDU. PASSOW. 2001. Carbon and nitrogen content of transparent exopolymer particles (TEP) in relation to their Alcian blue adsorption. Mar. Ecol. Prog. Ser. 219: 1–10. ———, S. THOMS, U. RIEBESELL, E. ROCHELLE-NEWALL, AND I.
ZONDERVAN. 2004. Polysaccharide aggregation as a potential
sink of marine dissolved organic carbon. Nature 428: 929–932.
GRASSHOFF, K., M. EHERHARDT, AND K. KREMLING. 1983.
Methods of seawaters analysis, 2nd ed. Verlag Chemie. GRILLI, F., E. PASCHINI, R. PRECALI, A. RUSSO, AND N. SUPIC.
2005. Circulation and horizontal fluxes in the northern Adriatic Sea in the period June 1999–July 2002. Part I: Geostrophic circulation and current measurement. Sci. Total Environ. 353: 57–67.
HERNDL, G. J. 1992. Marine snow in the northern Adriatic Sea:
Possible causes and consequences for a shallow ecosystem. Mar. Microb, Food Webs 6: 149–172.
HOPKINSON, C. S. JR.,ANDJ. J. VALLINO. 2005. Efficient export of
carbon to the deep ocean through dissolved organic matter. Nature 433: 142–145.
JACQUET, S., B. DELESALLE, J.-P. TORRE´ TON, AND J. BLANCHOT.
2006. Responses of the phytoplankton communities to increased anthropogenic influences (Southwestern Lagoon, New Caledonia). Mar. Ecol. Prog. Ser. 320: 65–78.
JOUON, A., P. DOUILLET, S. OUILLON, AND P. FRAUNIE´. 2006.
Calculations of hydrodynamic time parameters in a semi-opened coastal zone using a 3D hydrodynamic model. Cont. Shelf Res. 26: 1395–1415.
KLOAREG, B.,ANDR. S. QUATRANO. 1988. Structure of cell walls of
marine algae and ecophysiological functions of the matrix polysaccharides. Oceanogr. Mar. Biol. Annu. Rev. 26: 259–315.
MARAN˜ O´N, E., P. CERMEN˜ O, E. FERNA´ NDEZ, J. RODRI´GUEZ,ANDL.
ZABALA. 2004. Significance and mechanisms of photosynthetic
production of dissolved organic carbon in a coastal eutrophic ecosystem. Limnol. Oceanogr. 49: 1652–1666.
———, ———, AND V. PEREZ. 2005. Continuity in the
photo-synthetic production of dissolved organic carbon from eutrophic to oligotrophic waters. Mar. Ecol. Prog. Ser. 299: 7–17.
MARI, X. 1999. Carbon content and C : N ratio of transparent
exopolymeric particles (TEP) produced by bubbling exudates of diatoms. Mar. Ecol. Prog. Ser. 183: 59–71.
———, S. BEAUVAIS, R. LEME´ E,ANDM. L. PEDROTTI. 2001.
Non-Redfield C : N ratio of transparent exopolymeric particles in the northwestern Mediterranean Sea. Limnol. Oceanogr. 46: 1831–1836.
———,ANDA. BURD. 1998. Seasonal size spectra of transparent
exopolymeric particles (TEP) in a coastal sea and comparison with those predicted using coagulation theory. Mar. Ecol. Prog. Ser. 163: 63–76.
———,ANDT. KIØRBOE. 1996. Abundance, size distribution and
bacterial colonization of transparent exopolymeric particles (TEP) during spring in the Kattegat. J. Plankton Res. 18: 969–986.
———, F. RASSOULZADEGAN, C. P. D. BRUSSAARD, AND P.
WASSMANN. 2005. Dynamics of transparent exopolymeric
particles (TEP) production by Phaeocystis globosa under N-or P-limitation: A controlling factN-or of the retention/expN-ort balance. Harmful Algae 4: 895–914.
MENDEN-DEUER, S.,ANDE. J. LESSARD. 2000. Carbon to volume
relationships for dinoflagellates, diatoms, and other protist plankton. Limnol. Oceanogr. 45: 569–579.
MOESENEDER, M. M., C. WINTER, AND G. J. HERNDL. 2001.
Horizontal and vertical complexity of attached and free-living bacteria of the eastern Mediterranean Sea, determined by 16S rDNA and 16S rRNA fingerprints. Limnol. Oceanogr. 46: 95–107.
MORAN, X. A. G., E. FERNANDEZ, AND V. PEREZ. 2004. Size-fractionated primary production, bacterial production and net community production in subtropical and tropical domains of the oligotrophic NE Atlantic in autumn. Mar. Ecol. Prog. Ser. 274: 17–29.
MULLER-NIKLAS, G., S. SCHUSTER, E. KALTENBOCK, AND G. J.
HERNDL. 1994. Organic content and bacterial metabolism in
amorphous aggregations of the northern Adriatic Sea. Limnol. Oceanogr. 39: 58–68.
MULLIN, J. B., AND J. P. RILEY. 1955. The spectrophotometric
determination of silicate-silicon in natural waters with special reference to sea water. Anal. Chim. Acta 12: 162–170. OGAWA, H., Y. AMAGAI, I. KOIKE, K. KAISER,AND R. BENNER.
2001. Production of refractory dissolved organic matter by bacteria. Science 292: 917–920.
PASSOW, U. 2000. Formation of transparent exopolymer particles,
TEP, from dissolved precursor material. Mar. Ecol. Prog. Ser. 192: 1–11.
———, AND A. L. ALLDREDGE. 1994. Distribution, size and
bacterial colonization of transparent exopolymer particles (TEP) in the ocean. Mar. Ecol. Prog. Ser. 113: 185–198. ———, AND ———. 1995. A dye-binding assay for the
spectrophotometric measurement of transparent exopoly-meric particles (TEP). Limnol. Oceanogr. 40: 1326–1335. RAIMBAULT, P., F. DIAZ, W. POUVESLE,ANDB. BOUDJELLAL. 1999.
Simultaneous determination of particulate organic carbon, nitrogen and phosphorus collected on filters, using a semi-automatic wet-oxidation method. Mar. Ecol. Prog. Ser. 180: 289–295.
———, G. SLAWYK, B. COSTE,ANDJ. C. FRY. 1990. Feasibility of
measuring an automated colorimetric procedure for the determination of seawater nitrate in the 0 to 100 nM range: Examples from field and culture. Mar. Biol. 104: 347–351. ROCHELLE-NEWALL, E., AND oTHERS. 2004. Chromophoric
dis-solved organic matter in experimental mesocosms maintained under different pCO2levels. Mar. Ecol. Prog. Ser. 272: 25–31.
SMITH, D. C., M. SIMON, A. L. ALLDREDGE,ANDF. AZAM. 1992.
Intense hydrolytic enzyme activity on marine aggregates and implications for rapid particle dissolution. Nature 359: 139–141.
STODEREGGER, K., AND G. J. HERNDL. 1998. Production and
release of bacterial capsular material and its subsequent utilization by marine bacterioplankton. Limnol. Oceanogr. 43: 877–884.
THINGSTAD, T. F., A˚ . HAGSTRO¨ M,ANDF. RASSOULZADEGAN. 1997.
Accumulation of degradable DOC in surface waters: Is it caused by a malfunctioning microbial loop? Limnol. Ocea-nogr. 42: 398–404.
ZHOU, J., K. MOPPER,ANDU. PASSOW. 1998. The role of
surface-active carbohydrates in the formation of transparent exopo-lymer particles by bubble adsorption of seawater. Limnol. Oceanogr. 43: 1860–1871.
ZWEIFEL, U. L., J. WIKNER, A˚ . HAGSTRO¨ M, E. LUNDBERG,ANDB.
NORRMAN. 1995. Dynamics of dissolved organic carbon in
a coastal ecosystem. Limnol. Oceanogr. 40: 299–305.
Received: 6 February 2006 Amended: 26 October 2006 Accepted: 27 October 2006