HAL Id: halshs-00077361
https://halshs.archives-ouvertes.fr/halshs-00077361
Submitted on 30 May 2006HAL is a multi-disciplinary open access archive for the deposit and dissemination of sci-entific research documents, whether they are pub-lished or not. The documents may come from teaching and research institutions in France or abroad, or from public or private research centers.
L’archive ouverte pluridisciplinaire HAL, est destinée au dépôt et à la diffusion de documents scientifiques de niveau recherche, publiés ou non, émanant des établissements d’enseignement et de recherche français ou étrangers, des laboratoires publics ou privés.
From Archaeological Sherds to Qualitative Information
for Settlement Pattern Studies
Frédérique Bertoncello, Laure Nuninger
To cite this version:
Frédérique Bertoncello, Laure Nuninger. From Archaeological Sherds to Qualitative Information for Settlement Pattern Studies. Beyond the artefact - Digital Interpretation of the Past, Apr 2004, Prato, Italy. pp.140-145. �halshs-00077361�
From Archaeological Sherds to Qualitative Information for Settlement Pattern Studies
Dr. F. Bertoncello1, Dr. L. Nuninger2 1CEPAM UMR 6130, CNRS Valbonne, France [email protected] 2 Chrono-Ecologie UMR 6565, CNRS Besançon, France [email protected]Abstract. Archaeological study of ancient settlement and territorial dynamics is usually based on field survey data, both in- and
off-sites. But the spatial analysis of these surface scatters is often limited by their chronological low resolution. Using statistical and spatial analysis, the authors developed two approaches which allowed to go further in order to model settlements cycles and territorial dynamics in a long term scale with a better chronological resolution, in two areas of South-East France.
1. Introduction
This paper is based on data collected within the Archaeomedes project1. This European project was developed in the 90’s to
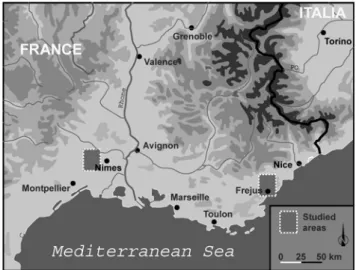
study the human and environmental interactions in the making of Mediterranean landscape on the long term, from Iron to Middle Ages. In this paper we will present two specific methodological experiences developed during our PhD. thesis (Bertoncello 1999, Nuninger 2002). Our studies take place in the South-East of France, one in Languedoc close to Nîmes, and the other in Provence near Fréjus (Fig. 1).
Fig. 1. Location
1 Archaeomedes I (1992-1994) : “Understanding the Natural and
Anthropogenic causes of soil degradation in the Mediterranean Basin” (Program Environment of the European Commission DGXII) ; Archaeomedes II (1996-1999) : “Policy-relevant models of the natural and anthropogenic dynamics of degradation and desertification and their spatio-temporal manifestations” (Program Environment of the European Commission DGXII).
Our interest in these areas was to study settlement and territorial dynamics from the Iron Age to the late Roman period. In this paper we will focus on the earliest stage of the modelling process. It presents how we used row data from fieldwalking to model settlement and territorial patterns.
2. From Sherd to Spatial Analysis : Difficulties
Most of our data come from fieldwalking and can then be dated within the chronological accuracy allowed by this non-stratigraphical technique. In our studied areas, most of the sites can be dated up to the century. But it is not always possible to reach such an accuracy and a relatively large number of sites cannot be precisely dated because their material is too scarce or lack of chronological references. It is even worse for off-sites scatters since the sherds are usually shapeless and badly preserved. These dating problems may deeply alter our perception of settlement’s typology and spatio-temporal distribution. Indeed, if we want to go beyond the traditional divisions in large periods (preroman / roman / late roman / medieval) in order to make a detailed analysis of the settlement’s dynamics within each of them, it is necessary to use a set of data with the finest chronological resolution (i.e. one century for the roman period). This usually leads to the selection of the well-dated settlements, while the sites with the least chronological accuracy are excluded from the study. In the area of Fréjus, such a selection would have a strong quantitative effect on the database available for the study, as nearly one third of the settlements existing between the 1st and 7th c. A. D. should be discarded, because they can not be precisely dated (the so-called “roman sites”) (Fig. 2). It would also have a qualitative effect on the database as these chronological problems do not affect all the sites in the same way. Whereas the big settlements which were dwelled during several centuries and usually give enough material to be accurately dated, it is not always a similar situation for the small settlements and short-lived sites, which present poorer scatters of material. At least, this also deeply alters our perception of the settlements’ spatial distribution because the big sites are mainly located in the valleys (like most of the roman villae), while the smaller sites are often situated in the highlands.
Fig. 2. Two perceptions of the roman settlement pattern in the area of
Fréjus, showing all the known sites dwelled between the 1st and 7th c. A. D., whatever their chronological resolution (left), and only the precisely dated sites (right).
Fig. 3. Settlements and off-site units during the Iron Age in the region
of Nîmes (Vaunage, Gard): two chronological resolutions which forbid the comparison.
Fieldwalking circumstances have an impact in this distorsion since it is easier to find sherds in the plough fields of the valleys than in the mountains’ woodlands. Therefore, if we only select the well-dated sites, we distort the initial set of data and create artificial spatial discontinuity, which forbid us to use spatial analysis tools to study settlements’ dynamics.
When it comes to study agricultural territories, we meet similar problems. The only available data are scatters of materials (off-sites), which can be interpreted as remains of ancient manuring zones (Wilkinson 1982, Hayfield 1987: 192-196, Nuninger 2002: 159-163). These archaeological data are quite precious to understand the agricultural landscape. But, while settlements can usually be dated – at least in Languedoc – century by century,
these off-sites units cannot be accurately dated and they cover a long period of time. We cannot often go further from the traditional divisions in large periods, as the Iron Age for example. These different chronological resolutions make it impossible to map together settlements and off-sites units, nor to analyse their relationships, unless we consider settlements at the lowest resolution, but then we lose dynamic information (Fig. 3).
3. How to Produce New Information : Two
Approaches
Being part of the same modelling process, which is to model territorial dynamics of ancient rural communities, the studies carried out in Languedoc and in Provence …) have developed two approaches. Each one started from different kinds of data (sites and off sites) and used different methodologies, but both produced comparable data.
3.1. The Settlements’ Dynamics
This approach has been developed in Provence in order to understand settlements’ dynamics around the roman colony of
Forum Iulii /Fréjus between the 1st and the 7th c. A. D.
(Bertoncello 2003, Bertoncello in progress). All the known sites were taken into account, whatever their chronological resolution, but in order to increase the chronological accuracy of the badly dated sites, we decided to go beyond the limitations of the ceramics’ typological dating techniques by paying attention to the pottery assemblages of the settlements. Assuming that contemporaneous settlements show similar assemblages of artefacts, we analysed the composition of the surface material collected on every site. All the sites were described according to the same criteria which correspond to the different types of artefacts found on the surface scatters : they include not only pottery (i.e. the different categories of amphorae, coarse and fine wares), coins, glass and metallic objects, but also the building materials and the artefacts related to craft or agricultural productions (millstones, olive or wine press counterweight, remains of pottery kiln, for example). Each of these criteria was divided into quantitative classes in order to take into account the frequency of each type of artefact on the sites. For example, the criterion “gaulish amphora” was divided into 4 categories : 1 to 4 sherds for low quantity, 5 to 10 sherds for medium quantity, 11 to 50 sherds for high quantity, more than 50 sherds for very high quantity. As for the building materials, we observed the frequency of the artefacts rather than their exact number : isolated, rare or frequent. The sites were then classified according to the composition of their material : a factor analysis followed by a cluster analysis allowed us to distinguish 15 classes of sites. Each of them presents a specific assemblage, both regarding their qualitative (i.e. the different categories of artefact schown) and quantitative composition (the frequency of each type of artefact). The diagram of the cluster analysis clearly shows two groups of settlements (Fig. 4) :
- on the left, the roman settlements, showing typical early Empire and gallo-roman assemblages of artefacts ;
- on the right, the “non-roman sites” which are, on the one hand, the pre-roman settlements (class J), and on the other hand, the late-roman sites (class O) ;
- between these two classes (J and O), the sites from classes K, L, M and N are not easy to date because they present very similar assemblages, mainly composed of coarse ware and few or no dating indicator.
Fig. 4. Classification of the pottery assemblages
Fig. 5. Statistical analysis of the pottery assemblages allowed to
increase the chronological resolution of the badly dated roman sites and to include them in the analysis of settlement's dynamics.
The factor analysis and the classification allow us to distinguish these four classes. As shown in the diagram and factorial graph, it appears that the classes K and L are closer to the pre-roman class J, while classes M and N are closer to the late roman class O (Fig. 4). We can then assume that the settlements coming from classes K and L are more probably pre-roman, while those from
classes M and N should rather be dated from Late Antiquity. This example shows how these statistical analysis can help us to increase the chronological resolution of undated sites. By this way, from the original 52 undated “roman sites” known around Fréjus, it was possible to distinguish 14 early Empire settlements and 24 late roman sites, which could then be integrated in a detailed analysis of settlements’ dynamics in the area (Fig. 5).
3.2. Agricultural Territories
In order to finalize our perception of the ancient landscape, we can process off-sites units. With these sherds coming from domestic manure, it is possible to give a spatial pictures of agricultural fields around the settlement. The experience was carried out in Languedoc during the Iron Age. Based on non-accurate data, the aim was to create a new information with a higher chronological resolution (Nuninger 2003, Nuninger 2004). We kept all the off-sites units without any selection so as to have the best archaeological information. Then, we calculated their most likely chronological weight, i.e. their most probable existence, century by century. This processing was developed according to the frequency of each type of ceramic and considering the spatial distribution of off-site units around each settlement. Basically, for each off-site, we can define the number of sherds of each type of ceramic. Concerning the Iron Age period, only amphora can be dated, at least with a resolution of 3 or 5 centuries. Because coarse ware is used during all the period, we decided to use only amphora sherds. Around Nîmes the region was well investigated with several oppida’s excavations. These investigations produced a good reference with the ratio of each type of amphora per century (Table 1.).
Table 1. Nîmes’ references. Ratio per century and per type of amphora
according to the frequency of sherds discovered in stratigraphical context in the region of Nîmes (Py 1990: 62)
Period Etruscan amphora Massalia amphora Italica amphora TOTAL 640-601 14,64 % - - 1,84 % 600-501 69,28 % 9,59 % - 13,37 % 500-401 15,89 % 50,24 % - 26,57 % 400-301 0,19 % 18,33 % - 8,99 % 300-201 - 12,19 % 0,26 % 6,06 % 200-101 - 9,29 % 31,90 % 16,84 % 100-001 - 0,36 % 67,84 % 26,33 % TOTAL 100% 100% 100% 100 %
Then, following the assumption, “spread sherds come from domestic waste”, a relationship between amphora ratio discovered on the settlements and amphora collected on the fields was determined. That means that the distribution of all types of amphora per century should be similar on the settlement locations and in the agricultural fields. Based on this relationship, the theoretical number of sherds for each off-sites units was calculated according to each century. Thus, if we have three sherds of massalia amphora for unit A, during the period between 600 to 501 BC, the theoretical number of sherd is 0,3 (i.e. 3 sherds multiplied by 9,59 % which is the ratio of massalia amphora during this period according to the regional reference). Finally, in order to obtain the theoretical total of sherds per unit, the sum per century was calculated.
Table 2. Theoretical frequency of sherds per century according to the
type of amphora : example for one unit.
Unit A Etruscan amphora Massalia amphora Italica amphora TOTAL 640-601 1,8 - - 1,8 600-501 8,3 0,3 - 8,6 500-401 1,9 1,5 - 3,4 400-301 0 0,5 - 0,6 300-201 - 0,4 - 0,4 200-101 - 0,3 - 0,3 100-001 - 0 - 0 TOTAL 12 3 - 15
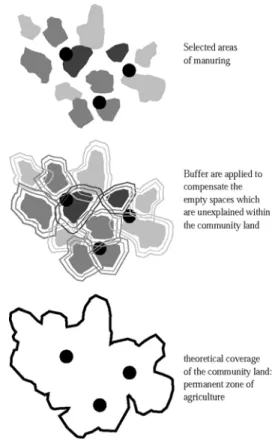
This first operation allowed us to map the density distribution of off-site clues, century by century. These maps present a theoretical dynamic which can be compared with settlement distribution. Nevertheless, they have no value on terms of reconstitution. Their interest consist in drawing our attention to some specific areas which could have been more intensively cultivated. But their interpretation remain complex because of noise due to global approach, no selection has been done. At this step, we had to delete the units with the lowest density and to select the other off-site units with a logic of manuring area, that is to say by taking into account manuring techniques and especially the manual spreading of the manure. Ethnological knowledge stress that manure is not spread anywhere but around the settlement (Sautter 1993, Lebeau 2000). In addition, they show a strong relationship between first, the distance from the settlement to the field, then the weight of carried manure and at least the number of people who can carry it. Thus, considering this information, the settlements were classified in 3 groups and a radius was chosen for each of them. The radius is based on agronomical and ethnological references (Remy 1967, Barral 1968, Tissandier 1969, Mazoyer, Roudart 1997: 244). For example, a radius of 200 meters was adopted for the isolated settlement which means 12 ha of cultivated land, able to feed from 5 to 15 inhabitants (Fig. 6).
Fig. 6. Selection of manuring zones.
Then, the discontinuous space obtained by the spatial selection was compensated by buffering. Indeed, we assume that the exploited territory of each settlement cannot be stopped by a no man’s land or empty spaces. The gaps are probably due to a lack of archaeological data. Furthermore, either the manures can be provided by other ways such as for example, green manure or
animal station, or the fields can support different agricultural activities such as grazing.
Fig. 7. Spatial definition of the community land
All the processing was systematically repeated for each settlement so as to get some homogeneous areas. For each century the resulted areas represent the theoretical community land2 or permanent agricultural zones. The result cannot be
considered as a landscape reconstitution, but still, it is a new way of analysing the agricultural landscape with a model based on real artefacts which is an improvement regarding to the Site Catchment Analysis model.
4. Interest and Prospects
As a result of our work on the assemblages of artefact, it was possible to have a more detailed view of the settlement’s dynamics during the roman period (Fig. 8).
The 1st century AD shows the main expansion of scattered settlements in the area. They occupy all types of topographical positions : the valley, the basins and the mountains. The strong decrease of the number of sites at the end of the 2nd century AD leads to a very withdrawn settlement’s pattern during the 3rd century AD. The settlements are concentrated on the biggest villas of the valley while the mountains seem to be almost deserted. The 4th and mainly the 5th century AD initiate a new dynamics with the creation of a large number of sites in the
2 The agricultural territory exploited by a rural community according to
the definition from Leonard R. & Longbottom J. 2000, see "Terroir": 55.
mountains. The importance of this reconquest of the mountains wouldn’t have been properly recognized without the integration of unprecisely dated sites, as a lot of them appeared to be late roman.
Fig. 8. The settlements' dynamics during the roman period in the area of
Frejus.
In a similar way with the analysis of off-site units, we can observe the dynamics of the exploited landscape: starting from clustered territories during 6th to 5th century BC, we can see a clear structuration of two big territories during the next centuries. At the end of the Iron Age, during the 1st century BC, it is interesting to stress some competition areas and a new small territory of conquest. The settlement patterns were modelised independently using a network organisation. But at the final step, they can be compared with the community lands (Fig. 9).
The comparison shows some strong relationships which can confirm part of our assumptions. Moreover, what is the most stimulating that it points out some anomalies and brings out new questions (Nuninger 2002, Nuninger 2004). Then, it is necessary to go back on the field and to work with row data again in order to take into account these anomalies or to bring new information within the model.
The whole results give new possibilities to understand settlement cycles and territorial dynamics with a long term scale for different regions. Until now, these studies have remained experimental. But considering these preliminary results, our project is to build up an integrated model and a systematic approach on both areas.
Fig. 9. The community lands’ dynamics and the settlements’
dynamics during the Iron Age in the area of Nîmes (Vaunage, Gard).
Acknowledgements
We wish to thank, with a specific attention, Mr Sander van der Leeuw (Archaeomedes project’s coordinator) who trusted in us as young researchers and gave us a possibility to work together with a hight level team.
We would like to thank the CEPAM (UMR 6130, CNRS), the laboratory of Chrono-Ecology (UMR 6565, CNRS), the MTI@SHS centre (University of Franche-Comté, France), the Regional Archaeological Service of Languedoc-Roussillon and Var (France) and the Archaeomedes Project (EU) for their funding of these works. We thank the MSH C. N. Ledoux of University of Franche-Comté (France) to support the cost of the conference for Laure Nuninger.
References
Barral, H., 1968. Tiogo (Haute-Volta). Atlas des structures agraires au sud du Sahara. 2, Mouton/Maison des Sciences de l’Homme, Paris-La Haye.
Bertoncello, F., 1999. Le Peuplement de la basse vallée de l'Argens et de ses marges (Var, France), de la fin de l'Age du Fer à la fin de l'Antiquité. Ph.D. thesis, defended in December 1999, University of Provence, France.
Bertoncello, F., 2003. L'apport de la statistique descriptive à l'analyse du peuplement dans la région de Fréjus (Var) : essai de caractérisation des assemblages de mobilier. In Favory, F. and Vignot A.: Actualité de la recherche en Histoire et Archéologie
agraires, Proceedings of the 5th International Conference of AGER, Besançon, France, september 19-20, 2000. University Press of
Franche-Comté, Besançon: 303-323.
Bertoncello, F., in progress. L’occupation d’un milieu de moyenne montagne en Provence orientale : le massif des Maures (Var) du IIe s. av. n. è. au VIIe s. In : Bouet, A. et Verdin, F. (éds.) , Territoires
et paysages. Hommages à Philippe Leveau. Documents
d’Archéologie Méridionale.
Hayfield, C., 1987. An Archaeological survey of the parrish of
Wharram Percy. East Yorkshire: I. The evolution of the roman landscape. Oxford. (BAR, British Series ; 172).
Lebeau, R., 2000. Les grands types de structures agraires dans le
monde. Paris, Armand Colin (U Géographie).
Mazoyer, M., Roudart, L., 1997. Histoire des agricultures du monde, du
Néolithique à la crise contemporaine, Paris, Seuil.
Nuninger, L. 2002. Peuplement et territoires protohistoriques du VIIIe
au Ier s. av. J.-C. en Languedoc oriental (Gard-Hérault). Ph.D.
thesis, defended in December 2002, University of Franche-Comté, France:http://tel.ccsd.cnrs.fr/documents/archives0/00/00/29/81/index _fr.html (visited 10/07/2004).
Nuninger, L. 2003. Approche méthodologique d'un espace agraire protohistorique: la Vaunage (Gard). Actualité de la recherche en
Histoire et Archéologie agraires, Proceedings of the 5th International Conference of AGER, Besançon, France, september 19-20, 2000. University Press of Franche-Comté, Besançon:365-375.
Nuninger, L. 2004. Contribution à la modélisation des finages protohistoriques : un cas d'étude micro-régional en Languedoc oriental (Gard), AGER 13: 6-23.
Py, M.1990. Culture, économie et société protohistoriques dans la
région nîmoise. French School of Rome, Paris-Rome, 1990.
Remy, G., 1967. Yobri (Haute-Volta). Atlas des structures agraires au sud du Sahara. 1, Mouton/Maison des Sciences de l’Homme, Paris-La Haye.
Sautter, G., 1993. Parcours d’un géographe. Des paysages aux ethnies,
de la brousse à la ville, de l’Afrique au monde. Paris, Arguments.
Tissandier, J., 1969. Zengoaga (Cameroun). Atlas des structures agraires au sud du Sahara. 3, Mouton/Maison des Sciences de l’Homme, Paris-La Haye.
Wilkinson, T.-J., 1982. The definition of ancient manured zones by means of extensive sherd-sampling techniques. Journal of Field