HAL Id: hal-00301512
https://hal.archives-ouvertes.fr/hal-00301512
Submitted on 26 Nov 2004HAL is a multi-disciplinary open access
archive for the deposit and dissemination of sci-entific research documents, whether they are pub-lished or not. The documents may come from teaching and research institutions in France or abroad, or from public or private research centers.
L’archive ouverte pluridisciplinaire HAL, est destinée au dépôt et à la diffusion de documents scientifiques de niveau recherche, publiés ou non, émanant des établissements d’enseignement et de recherche français ou étrangers, des laboratoires publics ou privés.
Effects of SO2 oxidation on ambient aerosol growth in
water and ethanol vapours
T. Petäjä, V.-M. Kerminen, K. Hämeri, P. Vaattovaara, J. Joutsensaari, W.
Junkermann, A. Laaksonen, M. Kulmala
To cite this version:
T. Petäjä, V.-M. Kerminen, K. Hämeri, P. Vaattovaara, J. Joutsensaari, et al.. Effects of SO2 oxida-tion on ambient aerosol growth in water and ethanol vapours. Atmospheric Chemistry and Physics Discussions, European Geosciences Union, 2004, 4 (6), pp.7725-7755. �hal-00301512�
ACPD
4, 7725–7755, 2004
Air mass history dependency of aerosol water and
ethanol uptake
T. Pet ¨aj ¨a et al.
Title Page Abstract Introduction Conclusions References Tables Figures J I J I Back Close
Full Screen / Esc
Print Version Interactive Discussion
Atmos. Chem. Phys. Discuss., 4, 7725–7755, 2004 www.atmos-chem-phys.org/acpd/4/7725/
SRef-ID: 1680-7375/acpd/2004-4-7725 European Geosciences Union
Atmospheric Chemistry and Physics Discussions
E
ffects of SO
2
oxidation on ambient
aerosol growth in water and ethanol
vapours
T. Pet ¨aj ¨a1, V.-M. Kerminen2, K. H ¨ameri1, P. Vaattovaara3, J. Joutsensaari3, W. Junkermann4, A. Laaksonen3, and M. Kulmala1
1
Division of Atmospheric Sciences, Department of Physical Sciences, University of Helsinki, Finland
2
Air Quality Research, Finnish Meteorological Institute, Finland 3
Department of Applied Physics, University of Kuopio, Finland 4
Institute for Meteorology and Climate Research, Forschungszentrum Karlsruhe, Germany Received: 14 October 2004 – Accepted: 7 November 2004 – Published: 26 November 2004 Correspondence to: T. Pet ¨aj ¨a (tuukka.petaja@helsinki.fi)
ACPD
4, 7725–7755, 2004
Air mass history dependency of aerosol water and
ethanol uptake
T. Pet ¨aj ¨a et al.
Title Page Abstract Introduction Conclusions References Tables Figures J I J I Back Close
Full Screen / Esc
Print Version Interactive Discussion
EGU
Abstract
Hygroscopicity (i.e. water vapour affinity) of atmospheric aerosol particles is one of the key factors in defining their impacts on climate. Condensation of sulphuric acid onto less hygroscopic particles is expected to increase their hygrocopicity and hence their cloud condensation nuclei formation potential. In this study, differences in the
5
hygroscopic and ethanol uptake properties of ultrafine aerosol particles in the Arctic air masses with a different exposure to anthropogenic sulfur pollution were examined. The main discovery was that Aitken mode particles having been exposed to polluted air were more hygroscopic and less soluble to ethanol than after transport in clean air. This aging process was attributed to sulfur dioxide oxidation and subsequent condensation
10
during the transport of these particle to our measurement site. The hygroscopicity of nucleation mode aerosol particles, on the other hand, was approximately the same in all the cases, being indicative of a relatively similar chemical composition despite the differences in air mass transport routes. These particles had also been produced closer to the observation site typically 3–8 h prior to sampling. Apparently, these particles
15
did not have an opportunity to accumulate sulphuric acid on their way to the site, but instead their chemical composition (hygroscopicity and ethanol solubility) resembled that of particles produced in the local or semi-regional ambient conditions.
1. Introduction
Ambient aerosol particles influence the global climate directly by scattering and
ab-20
sorbing solar radiation and indirectly by acting as cloud condensation nuclei (CCN) (Houghton et al.,2001). While the magnitude of both these effects is highly uncertain, there are some indications that the indirect effect might dominate over the direct one in the global atmosphere (Lohman and Lesins,2002;Sekiguchi et al.,2003). The ability of atmospheric aerosol particles to act as CCN, and hence their potential indirect
cli-25
ACPD
4, 7725–7755, 2004
Air mass history dependency of aerosol water and
ethanol uptake
T. Pet ¨aj ¨a et al.
Title Page Abstract Introduction Conclusions References Tables Figures J I J I Back Close
Full Screen / Esc
Print Version Interactive Discussion
properties in this respect is the particle hygroscopicity, i.e. its affinity to water vapour (Covert et al.,1998;Roberts et al.,2002;Pradeep Kumar et al.,2003;Raymond and Pandis,2003;Snider et al.,2003).
Atmospheric cloud condensation nuclei include primary particles emitted by vari-ous natural and anthropogenic sources, as well as secondary particles formed from
5
gaseous precursors. Some primary particles act readily as CCN (Novakov and Cor-rigan,1996;Ghan et al.,1998), while others, such as small soot particles originating from fossil fuel combustion, need to accumulate hygroscopic matter to convert them into good CCN. Formation of nanometer size secondary particles has been observed to take place all over the world (Kulmala et al.,2004). These particles, however, are not
10
able to act as CCN before they have growth in size and become hygroscopic enough (Kerminen et al.,2000).
Measurements conducted in Hyyti ¨al ¨a, Finland byO’Dowd et al.(2002) demonstrated that newly-formed particles contain a large fraction of organic matter originating most probably from the surrounding boreal forests. The boreal forests emit volatile organic
15
compounds (VOCs, e.g. α-pinene) which are oxidised in the atmosphere by OH (day-time), NO3 (nighttime) or O3 (both). A substantial part of the growth of newly-formed particles in Hyyti ¨al ¨a was attributed to the oxidation products of these organic com-pounds (Janson et al.,2001). Similarly, based on long term statistical analyses in a boreal forest, 8–50% of the observed growth rate of nucleation mode (Dp<10 nm) par-20
ticles could be explained by the condensation of certain organic vapours (Boy et al., 2003). However, the actual contribution may also be over 90%. To characterize the growth of particles under the influence of water vapour a hygroscopic growth factor (HGF) is used. It is determined as the ratio between the particle diameter at an ele-vated relative humidity versus its dry sample diameter. In laboratory experiments, the
25
oxidation products of α-pinene have been found to have a bulk hygroscopic growth fac-tor (HGF) of about 1.1 at 85% relative humidity (Virkkula et al.,1999), and the oxidation products of toluene have been found to have a corresponding factor of 1.1–1.2 at 90% relative humidity (Pet ¨aj ¨a et al., 2002). Some individual organic compounds identified
ACPD
4, 7725–7755, 2004
Air mass history dependency of aerosol water and
ethanol uptake
T. Pet ¨aj ¨a et al.
Title Page Abstract Introduction Conclusions References Tables Figures J I J I Back Close
Full Screen / Esc
Print Version Interactive Discussion
EGU in atmospheric particle samples have, however, hygroscopic growth factors
compara-ble to those of common inorganic salts, (e.g. HGF of 1.80 and 1.85 for sodium methyl sulfonic acid and sodium succinate, respectively, according toPeng et al.,2001).
Condensation of gaseous sulphuric acid increases significantly the water affinity of originally less hygroscopic particles, such as fresh combustion particles or secondary
5
particles consisting predominantly of organic compounds. As a result, the CCN activity of particles affected by high sulphur dioxide mixing ratios during atmospheric transport is expected to increase. Little observational evidence of this kind of an aging process for ambient particles has been obtained, especially regarding particles in the Aitken and nucleation size range.
10
The focus of this study was to examine differences in the hygroscopic properties of aerosol particles in Arctic air masses observed with a Hygroscopic Tandem Differential Mobility Analyser (HTDMA). In addition, variations in the ethanol uptake of these parti-cles were monitored with an Organic Tandem Differential Mobility Analyser (OTDMA). These complementary systems can give an indication of the differences and similarities
15
of gas phase uptake properties of the sampled aerosol particles and of their depen-dency on the air mass histories. For this purpose, particle formation event days with air of different magnitude and timing of exposure to anthropogenic sulphur dioxide con-centrations were selected. Condensation of sulphuric acid onto larger Aitken particles and subsequent enchancement in their hygroscopicity was observed for cases having
20
a longer time for sulphur dioxide oxidation. The dependence of hygroscopic properties and ethanol uptake of nucleation mode particles during new-particle formation events with different air mass histories was also examined.
ACPD
4, 7725–7755, 2004
Air mass history dependency of aerosol water and
ethanol uptake
T. Pet ¨aj ¨a et al.
Title Page Abstract Introduction Conclusions References Tables Figures J I J I Back Close
Full Screen / Esc
Print Version Interactive Discussion
2. Experimental setup
2.1. Site description
The measurements were conducted as a part of “Quantification of Aerosol Nucleation in the European Boundary Layer” (QUEST) intensive field campaign in the SMEAR II (Station for Measuring Forest Ecosystem-Atmosphere Relations) field station in
5
Hyyti ¨al ¨a during March–April 2003. The SMEAR II site is located in the Southern Fin-land (61◦510N, 24◦170E, 181 m a.s.l.), which is surrounded by a 40-year-old pine forest (Pinus Sylvestris L.). A detailed description of the station and the instrumentation within can be found elsewhere (e.g.Vesala et al.,1998; Kulmala et al.,2001b;Aalto et al., 2001).
10
2.2. Aerosol and trace gas measurements
Aerosol size distributions were measured with a Differential Mobility Particle Sizer (DMPS). The system, described by Aalto et al. (2001), can measure particles from 3 nm to about 600 nm in diameter in 10 min. The aerosol size distribution was used to determine the starting time of the nucleation events as well as to characterize aerosol
15
number concentrations during a course of nucleation event days.
Chemical analysis of nucleation mode particles (Dp<20 nm) is extremely difficult.
Excluding the recent study bySmith et al.(2004), information about the chemical com-position of these particles can be obtained only via indirect methods. Indirect methods do not always enable a quantitative analysis of the chemistry but allow to characterize
20
certain key elements based on on their behaviour and changing thermodynamic con-ditions. To study the effects of chemical aging of aerosols on their ability to accumulate water and to act as CCN the chemical composition is not a basic requirement. The physical behaviour might be sufficient to describe the aerosol and to get an estimate of the chemical composition. As an example, observation of water absorption into
25
Mo-ACPD
4, 7725–7755, 2004
Air mass history dependency of aerosol water and
ethanol uptake
T. Pet ¨aj ¨a et al.
Title Page Abstract Introduction Conclusions References Tables Figures J I J I Back Close
Full Screen / Esc
Print Version Interactive Discussion
EGU bility Analyser (HTDMA) (McMurry and Stolzenburg,1989;H ¨ameri et al.,2000) can be
utilized to tentatively identify the particle composition as water accumulation is specifi-cally dependent on the chemical composition. The idea in the TDMA method, in short, is that a monodisperse aerosol sample is first separated from the ambient aerosol with a Differential Mobility Analyzer (DMA,Winklmayr et al.,1991), and then treated with a
5
controlled amount of water vapour. At high relative humidities, soluble compounds in the aerosol sample take up water vapour into the aerosol phase until an equilibrium size is reached. This size change is monitored with the second DMA that is scanned through classifying voltages. Then a Condensation Particle Counter (CPC 3010, TSI Inc., USA) is used to measure particle concentrations in each size bin. As a result, a
10
hygroscopic growth factor (HGF) can be derived. It is defined as the ratio between the particle diameter at an elevated relative humidity versus its dry sample diameter.
In order to gain more information on the chemical composition of the particles, also particle growth factors in ethanol vapour were measured using an Organic Tandem Dif-ferential Mobility Analyzer (OTDMA) (Joutsensaari et al.,2001). This device is similar
15
to the HTDMA, but instead of water vapour, the particles are treated in ethanol vapour with saturation ratios of 0.82±0.02. Many organic species take up ethanol vapour caus-ing the particles to growth, whereas many inorganic species (e.g. ammonium sulphate) do not. Thus, information complementary to the HTDMA measurements is obtained. This can give an estimation of the main constituents of the aerosol particles.
20
In this study, the hygroscopic growth factors of 10, 20 and 50 nm particles were studied using a HTDMA system identical to the system described by H ¨ameri et al. (2000). Each dry size was scanned every 10 min. The relative humidity inside the second DMA was monitored with Vaisala HMM-211 dew point sensors (±2%RH at 0– 100%) within sheath and excess flows. A Hygro M4 dew point monitor with chilled
25
mirror sensor (D-2) operating in the excess flow of the DMA 2 was used as an internal reference for the relative humidity (±1.25% RH at 95%). Also OTDMA revealed growth factors for 10, 20 and 50 nm particles in approximately 10 min time resolution for each dry size. Ethanol saturation ratio inside the system was monitored with A Hygro M4
ACPD
4, 7725–7755, 2004
Air mass history dependency of aerosol water and
ethanol uptake
T. Pet ¨aj ¨a et al.
Title Page Abstract Introduction Conclusions References Tables Figures J I J I Back Close
Full Screen / Esc
Print Version Interactive Discussion
dew point monitor with chilled mirror sensor (D-2).
The functionality of the HTDMA system was verified daily by measuring the hygro-scopic growth factor of ammonium sulphate particles generated with TSI 3076 Con-stant Output Atomizer at 90% relative humidity. Occasionally dry calibrations were conducted, in which the growth factor of pure ammonium sulphate was measured at
5
<2% RH. This correction was less than 3% for all the sizes, which indicates that the
classifying voltages inside the DMAs were set correctly.
The hygroscopic growth factors were inverted from the raw data taking into account diffusion broadening due to Brownian diffusion inside the DMAs (Stolzenburg,1988). Due to small sizes of initial dry particles (50 nm in diameter or less), multiple charging
10
was neglected. Furthermore, both diffusion losses inside sampling lines and deterio-ration of the detection efficiency of TSI 3010 particle counter was neglected in the data analysis. In the OTDMA data analysis, diffusion broadening of the kernels were not taken into account.
Log-normal curves were fitted in a least squares sense to the inverted growth
spec-15
tra. Geometric mean values of only the most dominant (i.e. largest hygroscopic mode numberwise) were calculated. External mixing of aerosols was left out of further anal-ysis. Growth spectra in ethanol vapour were dominantly unimodal, whereas external mixing was frequently observed with the HTDMA especially in the 50 nm particle size.
Sulphur dioxide was measured with a fluorescence analyser (Model 43S, Thermo
20
Environmental Instruments Inc., detection limit 0.1 ppb). Ozone concentration was monitored with an ultraviolet light absorption analyser (TEI 49, Thermo Environmental Instruments, Franklin, MA, USA, detection limit 1 ppb) and NOx with a chemilumines-cence analyser (TEI 42C TL, Thermo Environmental Instruments, Franklin, MA, USA, detection limit 0.1 ppb). Gas phase concentrations were measured from a 70-m-tall
25
mast from different heights. For a characteristic value for the air masses, mean values of 30 min averages at 16.8-m height were used in the study.
ACPD
4, 7725–7755, 2004
Air mass history dependency of aerosol water and
ethanol uptake
T. Pet ¨aj ¨a et al.
Title Page Abstract Introduction Conclusions References Tables Figures J I J I Back Close
Full Screen / Esc
Print Version Interactive Discussion
EGU 2.3. Ancillary data
Ambient air water vapour concentration was measured with an infrared light absorp-tion analyser (URAS 4 H2O, Hartmann & Braun, Frankfurt am Main). The relative humidity was then calculated from measured water vapour concentrations and temper-ature measurements (Pt-100). Ambient tempertemper-ature sensors were ventilated and
pro-5
tected from direct solar radiation. Wind velocity was measured with a cup anemometer (A101M/L, Vector Instruments, Rhyl, Clwyd, UK) (threshold 0.15 m/s) and wind direc-tion at 16 m height with a wind vane (W200P, Vector Instruments, Rhyl, Clwyd, UK) above the tree-top level (threshold 0.6 m/s).
Backtrajectories of air mass during QUEST Hyyti ¨al ¨a campaign were calculated with
10
the HYSPLIT model (Draxler and Rolph,2003;Rolph,2003). According to these tra-jectories, three selected case studies were chosen for a more closer examination.
3. Results
3.1. Nucleation events in the SMEAR II station
During the QUEST project field campaign in March–April 2003, in Hyyti ¨al ¨a, more than
15
20 particle formation events were observed. The production of nucleation mode parti-cles was in accordance with the conclusions byNilsson et al.(2001a) in the way that a high nucleation probability was associated with cold air advection or cold air outbreaks behind cold fronts. In previous studies, bursts of new nuclei have been also been linked to the boundary layer development (Nilsson et al.,2001b;Buzorius et al.,2003) as well
20
as to a low condensation (and coagulation) sink for nucleating vapours and fresh nuclei (Kulmala et al.,2001a;Kulmala,2003).
ACPD
4, 7725–7755, 2004
Air mass history dependency of aerosol water and
ethanol uptake
T. Pet ¨aj ¨a et al.
Title Page Abstract Introduction Conclusions References Tables Figures J I J I Back Close
Full Screen / Esc
Print Version Interactive Discussion
3.2. Selected case studies
Most of the particle formation events during the QUEST measurement campaign took place in cold and originally very clean air coming from the Arctic Ocean or Northern Atlantic. However, there were differences in the levels of anthropogenic pollution, par-ticularly the SO2concentration, that these air masses encountered prior to their arrival
5
to Hyyti ¨al ¨a. In this respect, the observed events were divided into three different cate-gories: 1) air without any major contact with anthropogenic sources of SO2, 2) air pass-ing over the St. Petersburg region and/or the heavy Estonian industry in Narva prior to entering the measurement site, and 3) air that had been affected by SO2emitted from smelters and ore refineries in the Kola Peninsula area. One case corresponding to
10
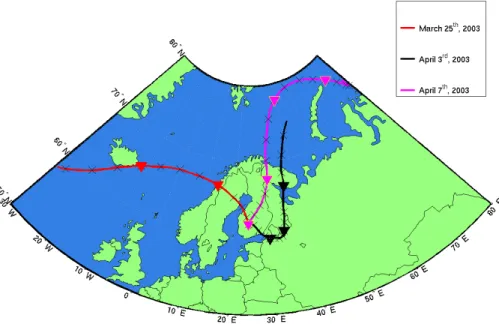
each of the backtrajectory categories was selected for a closer examination (Fig.1). Due to shortness of intensive measurement campaign in Hyyti ¨al ¨a and a strict require-ments of backward trajectories, only a limited number of days were eligible for this study, for polluted Arctic air masses in particular. Clean Arctic (Case 1) type air mass, however, was regularly observed during the QUEST measurement campaign. These
15
days resembled the selected day (25 March 2003) in terms of hygroscopicity, ethanol uptake and gaseous pollutant levels.
The selected three cases were further divided into three time periods: that before, that during and that after the observed nucleation event. For each case and all time periods, the averages of the total particle number concentration, trace gas
concen-20
trations (SO2, NOx, ozone) and meteorological parameters (ambient temperature and and relative humidity, wind direction and velocity) were calculated (Table1). Important parameters describing the functionality of the both TDMA systems were also reported, along with the mean growth factors of 10, 20 and 50 nm particles in both water and ethanol vapours.
25
The hygroscopic growth factors of 50 nm particles reveal the water uptake properties of the “background aerosol” in sampled air masses. Furthermore, this size is close to the lowest observed cloud droplet activation diameter in clean air masses, putting
ACPD
4, 7725–7755, 2004
Air mass history dependency of aerosol water and
ethanol uptake
T. Pet ¨aj ¨a et al.
Title Page Abstract Introduction Conclusions References Tables Figures J I J I Back Close
Full Screen / Esc
Print Version Interactive Discussion
EGU its hygroscopic properties in a key position. Combined with observed ethanol uptake,
this gives a tentative indication of possible composition of these transported aerosol particles. The growth factors of 10 and 20 nm particles, on the other hand, provide information about the hygroscopic properties of particles formed recently in the atmo-sphere by nucleation.
5
3.2.1. Case 1, 25 March 2003
According to HYSPLIT-backtrajectories, the origin of the measured air mass during 25 March 2003 was the Norwegian Sea and Iceland (Fig. 1). Gaseous pollutant levels stayed low during the whole day (SO2<0.2 ppb, NOx<1 ppb, Table1).
The aerosol number size distribution was dominated by the Aitken mode during the
10
night. These particles can be interpreted as a result of a nucleation event a day before. Over the course of the night, the mode grew in size up to 50 nm and at the same time the observed hygroscopic growth factor of 50 nm particles decreased (Fig.2). A minimum in the water uptake was observed at 06:00 (LT) (HGF=1.06), approximately three hours prior to the onset of the nucleation event. This is quite a typical diurnal
15
feature detected earlier byH ¨ameri et al. (2001) in Hyyti ¨al ¨a. One possible explanation for the minimum in HGF is an enchanced source rate of organic vapours of rather low solubility and their subsequent condensation during night-time (Janson et al., 2001). Most of the oxidation products of α-pinene have seen to be only slightly hygroscopic in laboratory experiments (Virkkula et al.,1999). Since the measured air mass had not
20
been in direct contact with any major anthropogenic sulphur dioxide source area, it is likely that the 50 nm particles had accumulated only minor amounts of sulphuric acid along their way to the measurement site.
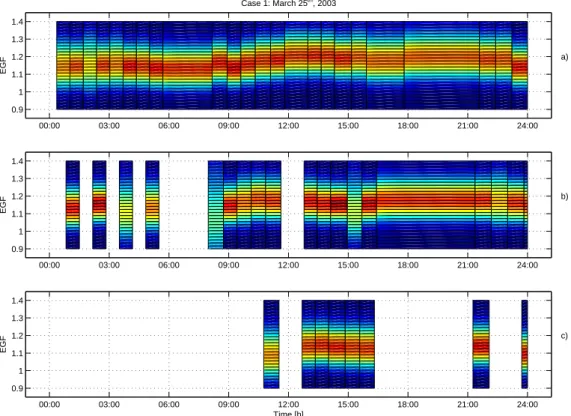
Growth factors in ethanol (EGF) showed a relatively constant value of about 1.14 throughout the night (Fig. 3). Laboratory measurements (Joutsensaari et al., 2004)
25
have shown that the EGF of 100 nm ammonium bisulphate particles is close to this value; however, the HGF measurements clearly rule out high sulphate contents. The EGFs for substances that grow well in ethanol vapour at saturation ratios around 0.83
ACPD
4, 7725–7755, 2004
Air mass history dependency of aerosol water and
ethanol uptake
T. Pet ¨aj ¨a et al.
Title Page Abstract Introduction Conclusions References Tables Figures J I J I Back Close
Full Screen / Esc
Print Version Interactive Discussion
(e.g. citric acid, tartaric acid) are on the order of 1.4–1.5. Thus, the growth factor of 1.14 can either signify compounds that show moderate affinity to ethanol, or inter-nal mixtures of ethanol insoluble (e.g. ammonium sulphate and soot) and well soluble compounds.
At 09:00 (LT), nucleation produced new particles and the observed particle number
5
concentration increased by about a factor of three over the next six hours. Through-out the day, the hygroscopicity of particles increased slightly in all sizes. Unfortunately there was a gap of 2.5 h in the HTDMA data in the beginning of the nucleation event. A subsequent decrease towards the midnight in the water uptake was observed in all sizes. The measured growth factor maximum for the Aitken mode particles (50 nm)
10
was 1.25 while the midnight minimum was 1.1. Correspondingly, the EGF increased to 1.2 at around 12:00 (LT), and decreased after that toward the evening. Interestingly, at around 22:30 (LT), the particle concentrations increased rapidly (Fig.2), which ap-pears as a sudden jump in the growth of the nucleated particles. At the same time, both growth factors dropped (HGF: 1.2 to 1.1, EGF: 1.18 to 1.13, Figs.2and 3).
Ex-15
amination of backtrajectories reveals that the even though the air arriving at Hyyti ¨al ¨a still had the same origin as before, it had made a loop south of Hyyti ¨al ¨a. Also, the local wind direction changed from 360◦ at 18:00 (LT) to 180◦at 23:00 (LT). We interpret the increase in the Aitken mode concentrations as pollution particles originating possibly from the Tampere city area. The fact that both growth factors dropped may indicate
20
that the particles contained a relatively large fraction of soot.
During the day, the 10 nm particle growth factors behaved in much the same way as the 50 nm GFs. Thus the maximum and minimum HGF’s were 1.22 and 1.08, and the maximum and minimum EGF’s 1.19 and 1.08, respectively.
In summary, the hygroscopic and ethanol GFs increased during the daytime,
sug-25
gesting the presence of condensable vapours with a higher affinity to both water and ethanol vapours than that the compounds already present in the particulate phase had. Furthermore, the particle hygroscopicity decreased towards the evening indicating the condensation of some less hygroscopic compound later during the day. The ethanol
ACPD
4, 7725–7755, 2004
Air mass history dependency of aerosol water and
ethanol uptake
T. Pet ¨aj ¨a et al.
Title Page Abstract Introduction Conclusions References Tables Figures J I J I Back Close
Full Screen / Esc
Print Version Interactive Discussion
EGU growth factor started decreasing already earlier. Also heterogenous reactions inside
and on the surface of the particles could alter the water and ethanol uptake of ambient aerosol particles, and they cannot be ruled out by these measurements. Just before midnight, the wind direction turned to south, accompanied by an increase in Aitken mode concentrations and decreases in the values of both growth factors, possibly
indi-5
cating that the increased concentrations were caused by pollution particles containing soot.
3.2.2. Case 2, 3 April 2003
During 3 April 2003, an Arctic air mass originating from the Arctic Ocean passed Kola Peninsula industrial region from the east and made a southerly loop over St. Petersburg
10
in Russia and Narva (Estonian industrial area) (Fig.1). Gas phase pollutant concentra-tions were 3–21 (SO2) and 2–4 (NOx) times higher during this day than in the 25 March 2003. This is a clear indication of the interaction of the measured air mass with an-thropogenic sources. The transport of air from Estonia to Hyyti ¨al ¨a took approximately 24 h, which was not enough for a complete oxidation of sulphur dioxide into gaseous
15
sulphuric acid.
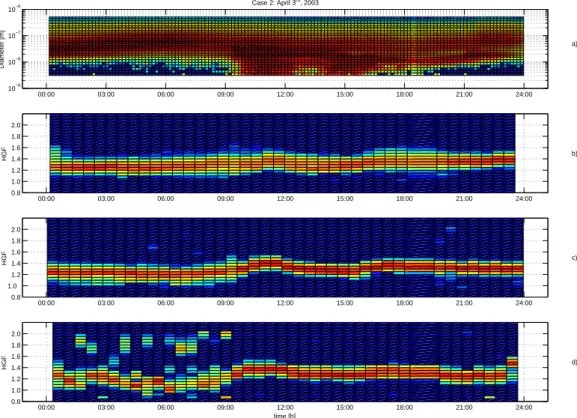
The total particle number concentration before the nucleation event was of the same order of magnitude as in Case 1 after the burst of new particles. Despite the larger condensation sink in this case, formation was observed in Hyyti ¨al ¨a (Fig.4).
The hygroscopicity of the background aerosol (50 nm) was higher during 3 April
20
2003, than in Case 1 throughout the day. This suggests that these particles had a larger sulphate fraction, most likely as a result of condensation from the gas phase dur-ing atmospheric transportation (aerosol agdur-ing). The water uptake of the background aerosol increased during the morning with a maximum at 11:00 (HGF=1.32), followed by a minimum at at 13:00 (HGF=1.20). In the afternoon hygroscopicity increased again
25
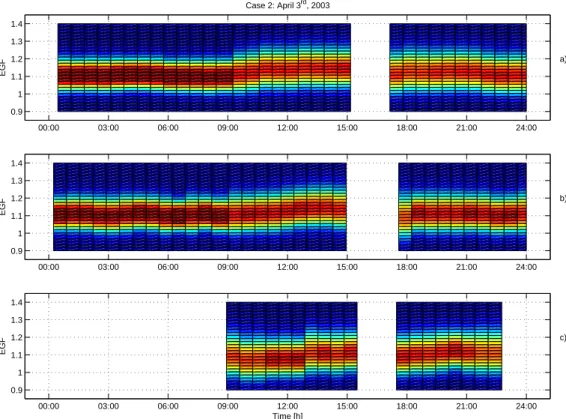
and by midnight a growth factor of 1.38 was reached (Fig.4). In contrast, growth factors in ethanol (Fig.5) were lower compared to case 1 indicating higher inorganic or soot fraction in the particles. The mean EGF of 50 nm particles had a more or less constant
ACPD
4, 7725–7755, 2004
Air mass history dependency of aerosol water and
ethanol uptake
T. Pet ¨aj ¨a et al.
Title Page Abstract Introduction Conclusions References Tables Figures J I J I Back Close
Full Screen / Esc
Print Version Interactive Discussion
value of 1.1 throughout the night, increased to a maximum of 1.18 at 14:00 (LT), and decreased back to 1.1 by 22:00 (LT).
The diurnal variation of the hygroscopicity of 10 nm particles resembled that of the background particles, even though the maximum was reached slightly earlier (10:00 (LT), HGF=1.35). Towards the evening measured growth factors approached
5
the value of 1.2 which is equal to that of 20 nm particles in Case 1. Therefore, the wa-ter soluble fraction was higher during this day. The maximum EGF for 10 nm particles was 1.12 at around 20:00 (LT), i.e. lower than in Case 1 (1.14). This also suggests a higher sulphate content, since laboratory experiments have shown that 10 nm ammo-nium bisulphate and ammoammo-nium sulphate particles do not grow in ethanol vapour at
10
ethanol saturation ratio of 86% (Vaattovaara et al.,2004).
One distict feature for the nucleation mode particles was that their water uptake had a similar minimum prior to the nucleation event as in the clean case (Case 1). The background particles, on the other hand, did not have a corresponding minimum. This indicates tentatively that compounds with very similar hygroscopic properties
partici-15
pated in the formation of atmospheric particles in the both Case 1 and Case 2.
3.2.3. Case 3, 7 April 2003
The trajectory analysis showed that the air mass during 7 April 2003 came from the Arc-tic Ocean passing the Kola Peninsula industrial areas on their way to Hyyti ¨al ¨a (Fig.1). This region is the main source area of gaseous sulphur pollution and primary
partic-20
ulate matter in the Arctic (Kashulina and Reimann,2001). Increased sulphur dioxide, nitrogen oxide and aerosol number concentrations have been addressed to air masses passing over Kola region also in Eastern Lapland, Finland byRuuskanen et al.(2003). Furthermore, the signals from the emissions of Kola region industry has been detected as far as Alaska (Polissar et al.,1999).
25
Prior to nucleation the particle size distribution was bimodal, typical for the ma-rine aerosol (Covert et al., 1992). The total concentration was, on average, 2000 particles cm−3 (Fig. 6). During the transport from Kola Peninsula, sulphur
diox-ACPD
4, 7725–7755, 2004
Air mass history dependency of aerosol water and
ethanol uptake
T. Pet ¨aj ¨a et al.
Title Page Abstract Introduction Conclusions References Tables Figures J I J I Back Close
Full Screen / Esc
Print Version Interactive Discussion
EGU ide released into the air was oxidised to sulphuric acid. It condensed onto Aitken and
accumulation mode particles on the way to the measurement site converting the par-ticles into more hygroscopic ones. The average hygroscopic growth factors of 50 nm particles during the night was 1.45, being indicative of a large volume fraction of e.g. ammonium sulphate or compounds with similar hygroscopic properties. Consistently
5
with the large ammonium sulfate fraction, the ethanol growth factor was rather low with the mean value below 1.1 most of the time (pure ammonium sulfate particles do not grow in ethanol vapour). However, it appears that the mean EGF fluctuated more than in the other two cases during the nighttime.
Although the air mass had traversed through a major SO2source area, the
concen-10
tration of gaseous sulphur dioxide was similar to that in Case 1, in which the air had not been in contact with major anthropogenic emission sources. The transport time from Kola Peninsula to Hyyti ¨al ¨a was approximately 30 h (Fig. 1). According to Boy et al. (2004), measured sulphuric acid concentrations were approximately by a factor of three higher during this day than during Case 1. Furthermore, based on the
mea-15
surements with the University of Manchester aerosol mass spectrometer, the aerosol composition was dominated by sulphate compounds during this day. This contrasts to Case 2, when the particles included significant fractions of both sulphate and organics (Allen, J., personal communication, 2003).
Nucleation mode particles appeared at 08:00 (Fig. 6). The hygroscopicity of the
20
background aerosol started to increase at 05:00–06:00 and the maximum was reached at noon when the hygroscopic growth factors corresponded to an aerosol consisting of pure ammonium sulphate (H ¨ameri et al.,2000). However, the EGF also increased after the onset of the nucleation, reaching 1.17 at around 15:00 (LT). This rules out pure ammonium sulphate particles, a more likely composition being a mixture of more acidic
25
sulphate and/or condensed organics. Subsequently, as both growth factors decreased, the HGF remained higher than in the other cases whereas the EGF had rather similar values (Figs.6and7).
ACPD
4, 7725–7755, 2004
Air mass history dependency of aerosol water and
ethanol uptake
T. Pet ¨aj ¨a et al.
Title Page Abstract Introduction Conclusions References Tables Figures J I J I Back Close
Full Screen / Esc
Print Version Interactive Discussion
particles but the noon maximum was not as pronounced. The plausible reason for this is that the nucleation mode particles had been formed more locally and had not been in the polluted air mass long enough to accumulate sulphuric acid on the way to the site. Also, the Kelvin effect of the small particles limits the growth factor to some extent. By midnight the water uptake of ultrafine particles resembled that in the other cases.
5
The ethanol growth factors of the 10 nm particles where somewhat lower than in the other cases, with values close to 1.08 during the nucleation event. Thus, compared with Case 1 and 2, the HGF was higher and the EGF lower during nucleation, which indicates a larger sulphate content of 10 nm particles in Case 3. Although the gas-phase sulphuric acid concentration was somewhat higher in Case 2 (3 April) than Case
10
3 (7 April), the nucleation mode growth was clearly more rapid during Case 2, indicating more condensation of organics relative to sulphuric acid. These differences in the water and ethanol uptake of 10 nm particles are, however, small compared to the differences in the 50 nm growth factors.
4. Discussion and conclusions
15
The influence of air mass history, especially with regard of an exposure to anthro-pogenic sulphur pollution, on the observed hygroscopic properties of ultrafine Aitken and nucleation mode particles was investigated. Also due to complementary TDMA systems, an indication of particle composition based on their measured water and ethanol uptakes, a tentative indications of the possible chemical composition di
fferen-20
cies, was available. Based on carefully selected case studies, the following picture emerged:
When originally relatively clean Arctic air traversed over major industrial areas, in this case Kola Peninsula, it captured anthropogenic pollutants such as sulphur diox-ide. During the subsequent air mass transport, this SO2 was gradually oxidised to
25
gaseous sulphuric acid, which then condensed onto the aerosol particles residing in the air mass. This kind of an aging process enhanced the water affinity of originally
ACPD
4, 7725–7755, 2004
Air mass history dependency of aerosol water and
ethanol uptake
T. Pet ¨aj ¨a et al.
Title Page Abstract Introduction Conclusions References Tables Figures J I J I Back Close
Full Screen / Esc
Print Version Interactive Discussion
EGU less hygroscopic Aitken mode particles making them eventually better cloud
conden-sation nuclei. When the transport time from major sulphur sources was shorter, as it was the case for air masses passing St. Petersburg and Estonian industrial areas, there was less time for the particles to accumulate sulphuric acid. Accompanied with possibly larger soot content in the aerosol phase this lead to lower water affinity.
Fi-5
nally, when clean Arctic air had no contact with any major sulphur sources, originally less hygroscopic particles remained as such during further advection. These particles were likely to have a significant organic fraction which, on average, is substantially less hygroscopic than sulphate and other common inorganic salt present in atmospheric particulate matter.
10
The hygroscopicity of nucleation mode particles was approximately the same in all the cases, being indicative of a relatively similar chemical composition despite the differences in the air mass transport routes. However, a careful examination of hy-groscopic and ethanol growth factors revealed some differences: in particular, the sulphate-to-organics ratio of the nucleation mode particles appeared to be larger in
15
the air mass arriving from Kola Peninsula compared with the air mass arriving from the St. Petersburg area. It is likely, however, that this was caused by local conditions, i.e. concentrations of condensable organics in the air, than by differences in the air masses.
Based on their growth rates, the observed nucleation mode particles had been
20
formed 3–8 h before the measurements. As a result, they had not as much time to accumulate gaseous sulphuric acid as did the larger and more aged Aitken mode par-ticles. The nucleation mode particles are formed in the local or semi-local environment and thus their hygroscopicity, and therefore probably also the chemical composition, reflect local conditions in which the formation of new particles had occured.
25
Investigating the diurnal variation of the hygroscopic properties of ultrafine particles provided to be another useful way to analyse the contribution of different condensing vapours. Gaseous sulfuric acid, for example, is produced almost solely via the oxida-tion sulphur dioxide by OH radicals. Thus, sulphuric acid has a strong diurnal cycle
ACPD
4, 7725–7755, 2004
Air mass history dependency of aerosol water and
ethanol uptake
T. Pet ¨aj ¨a et al.
Title Page Abstract Introduction Conclusions References Tables Figures J I J I Back Close
Full Screen / Esc
Print Version Interactive Discussion
with a maximum at noon. Condensing organic vapours are produced not only via OH radical oxidation but also via ozone and nitrate radical oxidation. Condensable organic vapours are produced therefore more steadily and even during the night-time. In any case, both organic and inorganic condensable vapours are expected to influence the hygroscopic properties of ultrafine aerosol particles.
5
Our results, while informative, are based on a rather limited set of measurements. Longer time series of particle hygroscopicity measurements are clearly needed to con-firm the observed aging of pre-existing Aitken mode particles due to anthropogenic sulphur pollution in the clean air masses, as well as the observed similarity in the water uptake of the nucleation mode particles produced via secondary pathways despite
dif-10
ferent degree of anthropogenic influence. It might also be valuable to repeat this kind of an analyses for totally different air mass transport patterns, including the advection of originally polluted air into a clean marine or continental environment.
Acknowledgements. This work was partly supported by the European Commission via the project “Quantification of Aerosol Nucleation in the European Boundary Layer” (QUEST)
15
(EVK2-CT2001-00127). Also financial support of Emil Aaltonen foundation and the Academy of Finland is greatly appreciated. This study would not be possible without the help of person-nel of SMEAR II station and Hyyti ¨al ¨a Forestry Field Station. NOAA Air Resources Laboratory (ARL) is acknowledged for the provision of the HYSPLIT transport and dispersion model and READY website (http://www.arl.noaa.gov/ready.html) used in this publication.
20
References
Aalto, P., H ¨ameri, K., Becker, E., Weber, R., Salm, J., M ¨akel ¨a, J. M., Hoell, C., O’Dowd, C. D., Karlsson, H., Hansson, H.-C., V ¨akev ¨a, M., Koponen, I. K., Buzorius, G., and Kulmala, M.: Physical characterization of aerosol particles during nucleation events, Tellus, 53B, 344–358, 2001. 7729
25
Boy, M., Rannik, U., Lehtinen, K., Tarvainen, V., Hakola, H., and Kulmala, M.: Nucleation events in the continental boundary layer: long-term statistical analyses of aerosol relevant characteristics, J. Geophys. Res., 108 (D21), 4667, doi:10.1029/2003JD003838, 2003. 7727
ACPD
4, 7725–7755, 2004
Air mass history dependency of aerosol water and
ethanol uptake
T. Pet ¨aj ¨a et al.
Title Page Abstract Introduction Conclusions References Tables Figures J I J I Back Close
Full Screen / Esc
Print Version Interactive Discussion
EGU Boy, M., Kulmala, M., Ruuskanen, T., Pihlatie, M., Reissell, A., Aalto, P. P., Keronen, P.,
Dal Maso, M., Hellen, H., Hakola, H., Jansson, R., Hanke, M., and Arnold, F.: Sulphuric acid closure and contribution to nucleation mode particle growth, Atmos. Chem. Phys. Dis-cuss., 4, 6341–6377, 2004,
SRef-ID: 1680-7375/acpd/2004-4-6341. 7738
5
Buzorius, G., Rannik, U., Aalto, P., dal Maso, M., Nilsson, E. D., Lehtinen, K., and Kulmala, M.: On particle formation prediction in continental boreal forest using micrometeorological parameters, J. Geophys. Res., 108 (D13), 4377, doi:10.1029/2002JD002850, 2003. 7732
Covert, D. S., Kapustin, V. N., Quinn, P. K., and Bates, T. S.: New particle formation in the marine boundary layer, J. Geophys. Res., 97, 20 581–20 589, 1992. 7737
10
Covert, D., Gras, J., Wiedensohler, A., and Stratmann, F.: Comparison of directly mea-sured CCN with CCN modeled from the number-size distribution in the marine boundary layer during ACE 1 at Cape Grim, Tasmania, J. Geophys. Res., 103 (D13), 16 597–16 608, doi:10.1029/98JD01093, 1998. 7727
Draxler, R. and Rolph, G.: HYSPLIT (HYsplit Single-Particle Lagrangian Intregrated Trajectory)
15
model, Website (http://www.arl.noaa.gov/ready/hysplit4.html), NOAA Air Resources Labora-tory, Silver Spring, MD, USA, 2003. 7732
Ghan, S., Guzman, G., and Abdul-Razzak, H.: Competition between sea salt and sulphate particles as cloud condensation nuclei, J. Atmos. Sci., 55, 3340–3347, 1998. 7727
H ¨ameri, K., V ¨akev ¨a, M., Hansson, H.-C., and Laaksonen, A.: Hygroscopic growth of ultrafine
20
ammonium sulphate aerosol measured using an ultrafine tandem differential mobility anal-yser, J. Geophys. Res., 105 (D17), doi:10.1029/2000JD900220, 22 231–22 242, 2000. 7730,
7738
H ¨ameri, K., V ¨akev ¨a, M., Aalto, P. P., Kulmala, M., Swietlicki, E., Zhou, J., Seidl, W., Becker, E., and O’Dowd, C. D.: Hygroscopic and CCN properties of aerosol particles in boreal forests,
25
Tellus, 53B, 359–379, 2001. 7734
Houghton, J., Ding, Y., Griggs, D., and Noguer, M.: Climate Change 2001: The Scientific Basis, Cambridge University Press, 2001. 7726
Janson, R., Rosman, K., Karlsson, A., and Hansson, H.-C.: Biogenic emissions and gaseous precursors to forest aerosols, Tellus, 53B, 423–440, 2001. 7727,7734
30
Joutsensaari, J., Vaattovaara, P., Vesterinen, M., H ¨ameri, K., and Laaksonen, A.: A novel tandem differential mobility analyzer with organic vapor treatment of aerosol particles, Atmos. Chem. Phys., 1, 51–60, 2001,
ACPD
4, 7725–7755, 2004
Air mass history dependency of aerosol water and
ethanol uptake
T. Pet ¨aj ¨a et al.
Title Page Abstract Introduction Conclusions References Tables Figures J I J I Back Close
Full Screen / Esc
Print Version Interactive Discussion
SRef-ID: 1680-7324/acp/2001-1-51. 7730
Joutsensaari, J., Toivonen, T., Vaattovaara, P., Vesterinen, M., Veps ¨al ¨ainen, J., and Laaksonen, A.: Time-resolved growth behaviour of acid aerosols in ethanol vapor with a tandem-TDMA technique, J. Aerosol Sci., 35, 851–867, 2004. 7734
Kashulina, G. and Reimann, C.: Sulphur in the Arctic environment (1): results of a
catchment-5
based multi-medium study, Env. Poll., 114, 3–19, 2001. 7737
Kerminen, V. M., Virkkula, A., Hillamo, R., Wexler, A. S., and Kulmala, M.: Secondary organics and atmospheric cloud condensation nuclei production, J. Geophys. Res., 105 (D7), 9255– 9264, doi:10.1029/1999JD901203, 2000. 7727
Kulmala, M.: How Particles Nucleate and Grow, Science, 302, 1000–1001, 2003. 7732
10
Kulmala, M., Dal Maso, M., M ¨akel ¨a, J., Pirjola, L., V ¨akev ¨a, M., Aalto, P., Miikkulainen, P., H ¨ameri, K., and O’Dowd, C.: On the formation, growth and composition of nucleation mode particles, Tellus, 53B, 479–490, 2001a. 7732
Kulmala, M., H ¨ameri, K., Aalto, P. P., M ¨akel ¨a, J. M., Pirjola, L., Nilsson, E. D., Buzorius, G., Rannik, ¨U., Dal Maso, M., Seidl, W., Hoffman, T., Janson, R., Hansson, H. C., Viisanen, Y.,
15
Laaksonen, A., and O’Dowd, C. D.: Overview of the international project on biogenic aerosol formation in the boreal forest (BIOFOR), Tellus 53B, 324–343, 2001b. 7729
Kulmala, M., Vehkam ¨aki, H., Pet ¨aj ¨a, T., Dal Maso, M., Lauri, A., Kerminen, V.-M., Birmili, W., and McMurry, P.: Formation and growth rates of ultrafine atmospheric particles: a review of observations, J. Aerosol Sci., 35, 143–176, 2004. 7727
20
Lohman, U. and Lesins, G.: Stronger constraints on the anthropogenic indirect aerosol effect, Science, 298, 1012–1015, 2002. 7726
McMurry, P. and Stolzenburg, M. R.: On the sensitivity of particle size to relative humidity for Los Angeles aerosols, Atmos. Environ., 23, 497–507, 1989. 7730
Nilsson, E., Rannik, ¨U., Kulmala, M., Buzorius, G., and O’Dowd, C.: Effects of the
continen-25
tal boundary layer evolution, convection, turbulence and entrainment on aerosol formation, Tellus, 53B, 441–461, 2001a. 7732
Nilsson, E. D., Paatero, J., and Boy, M.: Effects of air masses and synoptic weather on aerosol formation in the continental boundary layer, Tellus, 53B, 2001b. 7732
Novakov, T. and Corrigan, C.: Cloud condensation nucleus activity of the organic component of
30
biomass smoke particles, Geophys. Res. Lett., 23, 2141–2144, 1996. 7727
O’Dowd, C. D., Aalto, P., H ¨ameri, K., Kulmala, M., and Hoffmann, T.: Atmospheric particles from organic vapours, Nature, 416, 497–498, 2002. 7727
ACPD
4, 7725–7755, 2004
Air mass history dependency of aerosol water and
ethanol uptake
T. Pet ¨aj ¨a et al.
Title Page Abstract Introduction Conclusions References Tables Figures J I J I Back Close
Full Screen / Esc
Print Version Interactive Discussion
EGU Peng, C., Chan, M., and Chan, C.: The hygroscopic properties of dicarboxylic and
multifunc-tional acids: measurements and UNIFAC predictions., Environ. Sci. Technol., 35, 4495– 4501, 2001. 7728
Pet ¨aj ¨a, T., Aalto, P., and H ¨ameri, K.: Hygroscopicity of toluene oxidation products, Abstracts of the Sixth International Aerosol Conference, edited by: Wang, Chiu-Sen, 9–13 September
5
2002, Taipei, Taiwan, 851–852, 2002. 7727
Polissar, A., Hopke, P., Paatero, P., Kaufmann, Y., Hall, D., Bodhaine, B., Dutton, E., and Harris, J.: The aerosol at Barrow, Alaska: long term trends and source locations, Atmos. Environ., 33, 2441–2458, 1999. 7737
Pradeep Kumar, P., Broekhuizen, K., and Abbatt, J.: Organic acids as cloud condensation
10
nuclei: Laboratory studies of highly soluble and insoluble species, Atmos. Chem. Phys., 3, 509–520, 2003,
SRef-ID: 1680-7324/acp/2003-3-509. 7727
Raymond, T. and Pandis, S.: Formation of cloud droplets by multicomponent organic particles, J. Geophys. Res., 108 (D15),4469, doi:10.1029/2003JD003503, 2003. 7727
15
Roberts, G., Artaxo, P., Zhou, J., Swietlicki, E., and Andreae, M.: Sensitivity of CCN spectra on chemical and physical properties of aerosol: A case study from the Amazon Basin, J. Geophys. Res., 107 (D20), 8070, doi:10.1029/2001JD000583, 2002. 7727
Rolph, G.: Real-time Environmental Applications and Display sYstem (READY), Website (http:
//www.arl.noaa.gov/ready/), NOAA Air Resources Laboratory, Silver Spring, MD, USA, 2003.
20
7732
Ruuskanen, T., Reissell, A., Keronen, P., Aalto, P., Laakso, L., Gr ¨onholm, T., Hari, P., and Kulmala, M.: Atmospheric trace gas and aerosol particle concentration measurements in Eastern Lapland, Finland 1992–2001, Boreal Env. Res., 8, 335–349, 2003. 7737
Sekiguchi, M., Nakajima, T., Suzuki, K., Kawamoto, K., Higurashi, A., Rosenfeld, D., Sano,
25
I., and Mukai, S.: A study of the direct and indirect effects of aerosol using global satellite data sets of aerosol and cloud parameters, J. Geophys. Res., 108 (D22), 4699, doi:10.1029/2002JD003359, 2003. 7726
Smith, J., Moore, K., McMurry, P., and Eisele, F.: Atmospheric measurements of sub-20 nm diameter particle chemical composition by Thermal Desorption Chemical Ionization Mass
30
Spectrometry, Aerosol Sci. Technol., 38, 100–111, 2004. 7729
Snider, J., Guibert, S., Brenguier, J.-L., and Putaud, J.-P.: Aerosol activation in marine stra-tocumulus clouds: 2. K ¨ohler and parcel theory closure studies, J. Geophys. Res., 108 (D15),
ACPD
4, 7725–7755, 2004
Air mass history dependency of aerosol water and
ethanol uptake
T. Pet ¨aj ¨a et al.
Title Page Abstract Introduction Conclusions References Tables Figures J I J I Back Close
Full Screen / Esc
Print Version Interactive Discussion
8629, doi:10.1029/2002JD002692, 2003. 7727
Stolzenburg, M. R.: An ultrafine aerosol size distribution measuring system, PhD thesis, Uni-versity of Minnesota, 1988. 7731
Vaattovaara, P., R ¨as ¨anen, M., K ¨uhn, T., and Laaksonen, A.: A novel method for determining presence of carbonaceous fraction in nucleation mode particles, Abstracts of 8th
interna-5
tional conference on carbonaceous particles in the Atmosphere, 14–16 September, 2004, Vienna, Austria. 7737
Vesala, T., Haataja, J., Aalto, P., Altimir, N., Buzorius, G., Garam, E., H ¨ameri, K., Ilvesniemi, H., Jokinen, V., Keronen, P., Lahti, T., Markkanen, T., M ¨akel ¨a, J., Nikinmaa, E., Palmroth, S., Palva, L., Pohja, T., Pumpanen, J., Rannik, ¨U., Siivola, E., Ylitalo, H., Hari, P., and Kulmala,
10
M.: Long-term field measurements of atmosphere-surface interactions in boreal forest com-bining forest ecology, micrometeorology, aerosol physics and atmospheric chemistry, Trends in Heat, Mass & Momentum Transfer, 4, 17–35, 1998. 7729
Virkkula, A., Van Dingenen, R., Raes, F., and Hjort, J.: Hygroscopic properties of aerosol formed by oxidation of limonene, alpha-pinene, and beta-pinene, J. Geophys. Res., 104
15
(D3), 3569–3579, doi:10.1029/1998JD100017, 1999. 7727,7734
Winklmayr, W., Reischl, G., Lindner, A., and Berner, A.: A new electromobility spectrometer for the measurement of aerosol size distributions in the size range from 1 to 1000 nm, J. Aerosol Sci., 22, 289–296, 1991. 7730
ACPD
4, 7725–7755, 2004
Air mass history dependency of aerosol water and
ethanol uptake
T. Pet ¨aj ¨a et al.
Title Page Abstract Introduction Conclusions References Tables Figures J I J I Back Close
Full Screen / Esc
Print Version Interactive Discussion
EGU
Table 1. Characteristic averages for different air masses before, during, and after selected
nucleation event days. EGF denotes the growth factors in ethanol vapour and HGF, in turn, in-dicate the observed growth of particles in water vapour. Standard deviations of mean quantities are in parentheses. The second value in the parenthesis after mean growth factors indicates the number of observations. Missing data is marked with n.a. (not available).
Clean Arctic Arctic and Estonia Arctic and Kola Before nucleation burst (0–9 a.m.)
Aerosol Concentration [cm−3] 3400 (600) 5900 (800) 1700 (600) Temperature [◦C] −0.2 (0.7) −5.7 (0.5) −7.2 (1.4) Relative humidity [%] 90 (4) 66 (3) 92 (9) Wind velocity [m s−1] 2.0 (0.3) 2.0 (0.4) 2.7 (0.5) Wind direction [◦] 303 (20) 102 (20) 25 (11) SO2conc. [ppb] 0.2 (0.2) 1.4 (0.6) 0.4 (0.3) O3conc. [ppb] 38 (1.2) 36 (2) 27 (1.0) NOxconc. [ppb] 0.96 (0.13) 2.8 (0.8) 0.9 (0.4) S in OTDMA [%] 82.2 (0.9) 83.8 (0.3) 83.0 (0.3) T in OTDMA [◦C] 24.8 (0.02) 24.9 (0.01) 24.9 (0.03) EGF (50 nm) 1.14 (0.01) (11) 1.10 (0.01) (13) 1.10 (0.02) (10) EGF (20 nm) 1.12 (0.03) (6) 1.10 (0.01) (13) 1.11 (0.01) (10)
EGF (10 nm) n. a. 1.08 (n.a) (1) n.a.
RH in HTDMA [%] 89.46 (0.02) 89.42 (0.04) 89.38 (0.03) T in HTDMA [◦C] 24.40 (0.01) 24.60 (0.01) 23.20 (0.03) HGF (50 nm) 1.09 (0.03) (17) 1.23 (0.03) (17) 1.44 (0.15) (16) HGF (20 nm) 1.09 (0.11) (17) 1.20 (0.04) (17) 1.24 (0.06) (15) HGF (10 nm) 1.14 (0.11) (14) 1.15 (0.08) (17) 1.21 (0.07) (16)
ACPD
4, 7725–7755, 2004
Air mass history dependency of aerosol water and
ethanol uptake
T. Pet ¨aj ¨a et al.
Title Page Abstract Introduction Conclusions References Tables Figures J I J I Back Close
Full Screen / Esc
Print Version Interactive Discussion
Table 1. Continued.
Clean Arctic Arctic and Estonia Arctic and Kola During nucleation burst (9–12 a.m.)
Aerosol Concentration [cm−3] 4000 (1200) 13000 (4000) 7000 (4000) Temperature [◦C] 3.6 (1.1) −2 (2) −2.8 (0.8) Relative humidity [%] 59 (10) 50 (7) 51 (6) Wind velocity [m s−1] 2.7 (0.6) 1.8 (0.4) 4.5 (0.6) Wind direction [◦] 347 (8) 71 (12) 39 (5) SO2conc. [ppb] 0.15 (0.15) 3.2 (1.3) 0.4 (0.2) O3conc. [ppb] 41 (1.1) 37 (2) 35 (1.2) NOxconc. [ppb] 0.78 (0.14) 3.2 (0.7) 0.75 (0.14) S in OTDMA [%] 82.3 (0.5) 83.9 (0.2) 82.7 (0.4) T in OTDMA [◦C] 24.8 (0.03) 24.9 (0.01) 25.0 (0.02) EGF (50 nm) 1.17 (0.02) (4) 1.12 (0.01) (5) 1.13 (0.04) (3) EGF (20 nm) 1.16 (0.01) (3) 1.11 (0.01) (5) 1.13 (0.01) (3) EGF (10 nm) 1.08 (n.a.) (1) 1.07 (0.01) (4) 1.06 (0.04) (3) RH in HTDMA [%] 89.2 (0.01) 89.3 (0.01) 89.5 (0.01) T in HTDMA [◦C] 24.5 (0.01) 24.7 (0.01) 24.2 (0.02) HGF (50 nm) 1.10 (0.01) (2) 1.30 (0.03) (5) 1.73 (0.05) (6) HGF (20 nm) 1.15 (0.01) (2) 1.33 (0.04) (5) 1.42 (0.06) (6) HGF (10 nm) 1.19 (0.03) (3) 1.33 (0.03) (5) 1.28 (0.06) (4)
ACPD
4, 7725–7755, 2004
Air mass history dependency of aerosol water and
ethanol uptake
T. Pet ¨aj ¨a et al.
Title Page Abstract Introduction Conclusions References Tables Figures J I J I Back Close
Full Screen / Esc
Print Version Interactive Discussion
EGU
Table 1. Continued.
Clean Arctic Arctic and Estonia Arctic and Kola After nucleation burst (12 a.m.–12 p.m.)
Aerosol Concentration [cm−3] 6900 (2000) 6600 (3300) 7100 (3700) Temperature [◦C] 5 (2) −0.4 (1.2) −3 (2) Relative humidity [%] 42 (7) 51 (20) 49 (10) Wind velocity [m s−1] 1.8 (0.8) 2.5 (0.6) 3.6 (1.0) Wind direction [◦] 87 (130) 6 (40) 37 (8) SO2conc. [ppb] 0.17 (0.14) 0.6 (0.3) 0.4 (0.3) O3conc. [ppb] 44 (2) 41 (3) 39 (2) NOxconc. [ppb] 1.0 (0.6) 1.7 (0.3) 0.7 (0.2) S in OTDMA [%] 81.9 (0.8) 83.9 (0.2) 82.9 (0.4) T in OTDMA [◦C] 24.8 (0.07) 24.9 (0.02) 25.0 (0.01) EGF (50 nm) 1.18 (0.02) (9) 1.12 (0.01) (15) 1.14 (0.02) (11) EGF (20 nm) 1.15 (0.02) (10) 1.11 (0.02) (14) 1.11 (0.02) (12) EGF (10 nm) 1.12 (0.02) (7) 1.10 (0.01) (13) 1.08 (0.01) (13) RH in HTDMA [%] 89.4 (0.06) 89.4 (0.02) 89.2 (0.2) T in HTDMA [◦C] 24.4 (0.01) 24.8 (0.02) 24.9 (0.01) HGF (50 nm) 1.21 (0.06) (20) 1.32 (0.04) (19) 1.42 (0.15) (19) HGF (20 nm) 1.18 (0.06) (20) 1.28 (0.03) (20) 1.25 (0.09) (19) HGF (10 nm) 1.17 (0.05) (16) 1.26 (0.06) (18) 1.27 (0.06) (19)
ACPD
4, 7725–7755, 2004
Air mass history dependency of aerosol water and
ethanol uptake
T. Pet ¨aj ¨a et al.
Title Page Abstract Introduction Conclusions References Tables Figures J I J I Back Close
Full Screen / Esc
Print Version Interactive Discussion
Fig. 1. HYSPLIT backward trajectories arriving to Hyyti ¨al ¨a site at 10:00 UTC during selected
days. During 25 March 2003 air parcels arrived to the Hyyti ¨al ¨a site without any major contact with anthropogenic sources of SO2(Case 1). The route is identified with a red line. On 3 April 2003 the Arctic air circumvented Kola Peninsula industrial regions from the east and passed over the St. Petersburg region and the Estonian heavy industry in Narva prior to entering the measurement site (Case 2, indicated with a black line). On 7 April 2003 initially clean Arctic air passed over the source area of gaseous sulphur dioxide pollution in the Kola region approxi-mately 30 h prior sampling in Hyyti ¨al ¨a (Case 3, indicated with a magenta line). Starting height for all the trajectory calculatios was 180 m above ground level. Crosses and closed triangles are 6 and 24 h time marks, respectively.
ACPD
4, 7725–7755, 2004
Air mass history dependency of aerosol water and
ethanol uptake
T. Pet ¨aj ¨a et al.
Title Page Abstract Introduction Conclusions References Tables Figures J I J I Back Close
Full Screen / Esc
Print Version Interactive Discussion EGU 00:00 03:00 06:00 09:00 12:00 15:00 18:00 21:00 24:00 10−9 10−8 10−7 10−6 Diameter [m] a) Case 1: March 25th, 2003 00:00 03:00 06:00 09:00 12:00 15:00 18:00 21:00 24:00 0.8 1.0 1.2 1.4 1.6 1.8 2.0 HGF b) 00:00 03:00 06:00 09:00 12:00 15:00 18:00 21:00 24:00 0.8 1.0 1.2 1.4 1.6 1.8 2.0 HGF c) 00:00 03:00 06:00 09:00 12:00 15:00 18:00 21:00 24:00 0.8 1.0 1.2 1.4 1.6 1.8 2.0 HGF d) time [h]
Fig. 2. Aerosol number size distribution during 25 March 2003 (Case 1) in Hyyti ¨al ¨a as a
con-tour plot (panel a). Nucleation burst occured at 9 (LT). Hygroscopic growth factors of 50 nm
(panelb), 20 nm (panel c) and 10 nm (panel d) particles measured with HTDMA at 90%
rela-tive humidity is presented in contour plots. Colors represent the relarela-tive contribution of a certain growth factor to the total measured spectra. The hygroscopicity of all sizes remained unimodal throught the day i.e. the particles were internally mixed with respect to their affinity to water vapour. A slight increase in the water uptake was observed after nucleation burst in all the sizes. Note a measurement break due to malfunction of the HTDMA system between 10 a.m. and 12 a.m. Scatter in the measured growth factors prior to the nucleation event is a result of low concentration of ultrafine particles prior to nucleation burst.
ACPD
4, 7725–7755, 2004
Air mass history dependency of aerosol water and
ethanol uptake
T. Pet ¨aj ¨a et al.
Title Page Abstract Introduction Conclusions References Tables Figures J I J I Back Close
Full Screen / Esc
Print Version Interactive Discussion 00:00 03:00 06:00 09:00 12:00 15:00 18:00 21:00 24:00 0.9 1 1.1 1.2 1.3 1.4 EGF a) Case 1: March 25th, 2003 00:00 03:00 06:00 09:00 12:00 15:00 18:00 21:00 24:00 0.9 1 1.1 1.2 1.3 1.4 EGF b) 00:00 03:00 06:00 09:00 12:00 15:00 18:00 21:00 24:00 0.9 1 1.1 1.2 1.3 1.4 EGF c) Time [h]
Fig. 3. Observed growth factors in ethanol vapour during 25 March 2003 (Case 1) in Hyyti ¨al ¨a
for 50 nm (panela), 20 nm (panel b) and 10 nm initially dry particles. An increase in the ethanol
ACPD
4, 7725–7755, 2004
Air mass history dependency of aerosol water and
ethanol uptake
T. Pet ¨aj ¨a et al.
Title Page Abstract Introduction Conclusions References Tables Figures J I J I Back Close
Full Screen / Esc
Print Version Interactive Discussion EGU 00:00 03:00 06:00 09:00 12:00 15:00 18:00 21:00 24:00 10−9 10−8 10−7 10−6 Diameter [m] a) Case 2: April 3rd, 2003 00:00 03:00 06:00 09:00 12:00 15:00 18:00 21:00 24:00 0.8 1.0 1.2 1.4 1.6 1.8 2.0 HGF b) 00:00 03:00 06:00 09:00 12:00 15:00 18:00 21:00 24:00 0.8 1.0 1.2 1.4 1.6 1.8 2.0 HGF c) 00:00 03:00 06:00 09:00 12:00 15:00 18:00 21:00 24:00 0.8 1.0 1.2 1.4 1.6 1.8 2.0 HGF d) time [h]
Fig. 4. Aerosol number size distribution during 3 April 2003 (Case 2) in Hyyti ¨al ¨a as a contour
plot (panela). Nucleation burst occured at 9 (LT). Hygroscopic growth factors of 50 nm (panel b), 20 nm (panel c) and 10 nm (panel d) particles measured with HTDMA at 90% relative
hu-midity are presented in contour plots. Colors represents the relative contribution of a certain growth factor to the total measured spectra. Minimum water uptake occured approximately 3 h before the nucleation event for all sizes, but was more prominent in the smaller sizes. The maximum was, in turn, observed during the nuclation burst.
ACPD
4, 7725–7755, 2004
Air mass history dependency of aerosol water and
ethanol uptake
T. Pet ¨aj ¨a et al.
Title Page Abstract Introduction Conclusions References Tables Figures J I J I Back Close
Full Screen / Esc
Print Version Interactive Discussion 00:00 03:00 06:00 09:00 12:00 15:00 18:00 21:00 24:00 0.9 1 1.1 1.2 1.3 1.4 EGF a) Case 2: April 3rd, 2003 00:00 03:00 06:00 09:00 12:00 15:00 18:00 21:00 24:00 0.9 1 1.1 1.2 1.3 1.4 EGF b) 00:00 03:00 06:00 09:00 12:00 15:00 18:00 21:00 24:00 0.9 1 1.1 1.2 1.3 1.4 EGF c) Time [h]
Fig. 5. Observed growth factors in ethanol vapour during 3 April 2003 (Case 2) in Hyyti ¨al ¨a
as a contour plot for 50 nm (panela), 20 nm (panel b) and 10 nm (panel c) particles. Average
ACPD
4, 7725–7755, 2004
Air mass history dependency of aerosol water and
ethanol uptake
T. Pet ¨aj ¨a et al.
Title Page Abstract Introduction Conclusions References Tables Figures J I J I Back Close
Full Screen / Esc
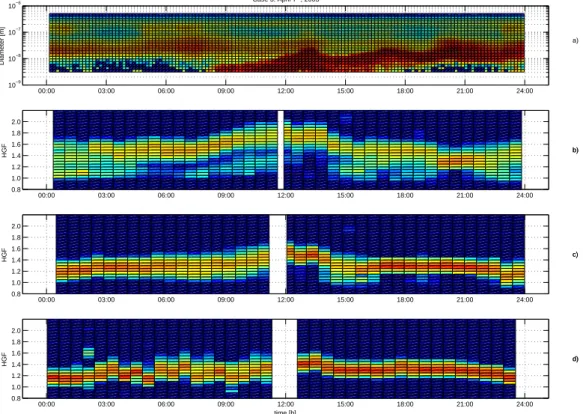
Print Version Interactive Discussion EGU 00:00 03:00 06:00 09:00 12:00 15:00 18:00 21:00 24:00 10−9 10−8 10−7 10−6 Diameter [m] a) Case 3: April 7th, 2003 00:00 03:00 06:00 09:00 12:00 15:00 18:00 21:00 24:00 0.8 1.0 1.2 1.4 1.6 1.8 2.0 HGF b)b) 00:00 03:00 06:00 09:00 12:00 15:00 18:00 21:00 24:00 0.8 1.0 1.2 1.4 1.6 1.8 2.0 HGF c)c) 00:00 03:00 06:00 09:00 12:00 15:00 18:00 21:00 24:00 0.8 1.0 1.2 1.4 1.6 1.8 2.0 HGF d) time [h] d)
Fig. 6. Aerosol number size distribution during 7 April 2003 (Case 3) in Hyyti ¨al ¨a as a contour
plot (panela). Nucleation burst occured at 8 (LT). Prior to the nucleation burst, the
hygroscop-icity of 50 nm particles (panelb) is higher than in Case 1 and 2. These particles accumulated
sulphuric acid as they traversed with sulfur dioxide laden Arctic air to the measurement site. The water uptake increased further and reached a maximum at noon (LT), when it was compa-rable to values of pure ammonium sulphate aerosol. During the afternoon hours hygroscopicity decreased to similar values as in Case 2. The observed water uptake for 10 nm particles (panel
ACPD
4, 7725–7755, 2004
Air mass history dependency of aerosol water and
ethanol uptake
T. Pet ¨aj ¨a et al.
Title Page Abstract Introduction Conclusions References Tables Figures J I J I Back Close
Full Screen / Esc
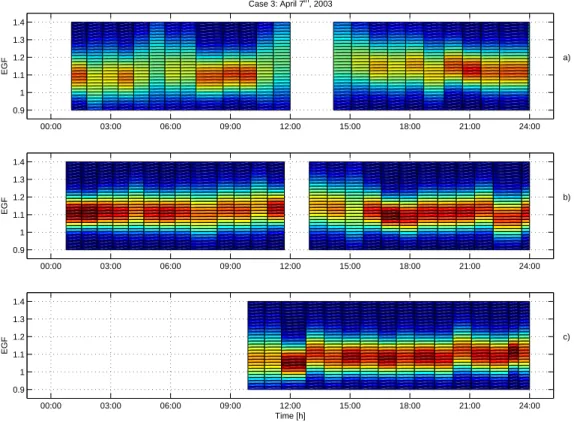
Print Version Interactive Discussion 00:00 03:00 06:00 09:00 12:00 15:00 18:00 21:00 24:00 0.9 1 1.1 1.2 1.3 1.4 EGF a) Case 3: April 7th, 2003 00:00 03:00 06:00 09:00 12:00 15:00 18:00 21:00 24:00 0.9 1 1.1 1.2 1.3 1.4 EGF b) 00:00 03:00 06:00 09:00 12:00 15:00 18:00 21:00 24:00 0.9 1 1.1 1.2 1.3 1.4 EGF c) Time [h]
Fig. 7. Observed growth factors in ethanol vapour during 7 April 2003 (Case 3) in Hyyti ¨al ¨a as