Structural Connectivity Alterations in Amyotrophic Lateral Sclerosis: A Graph Theory Based Imaging Study
Texte intégral
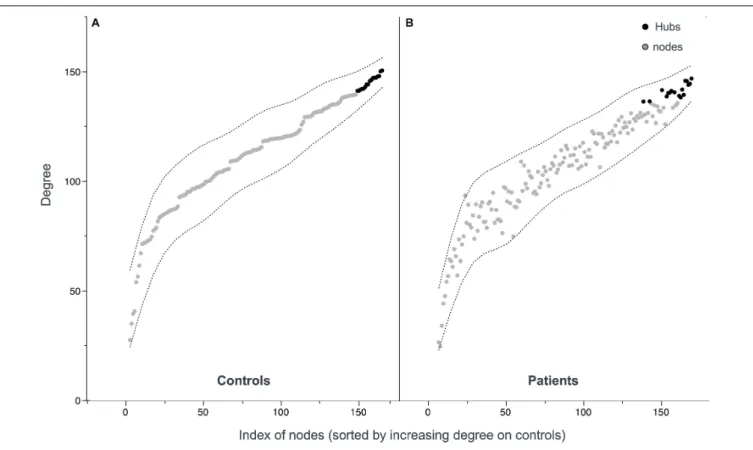
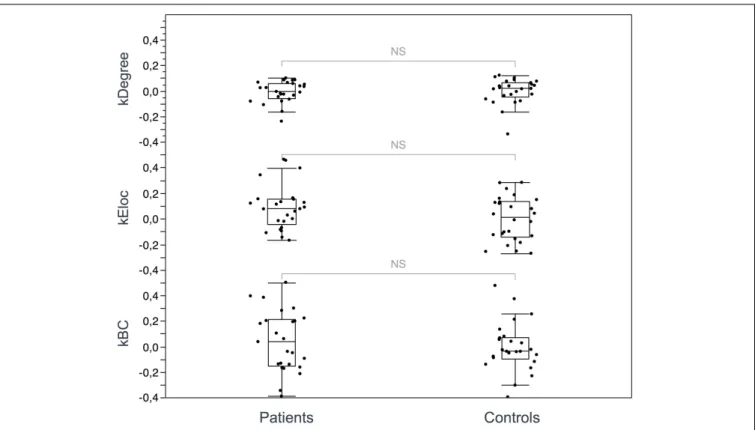
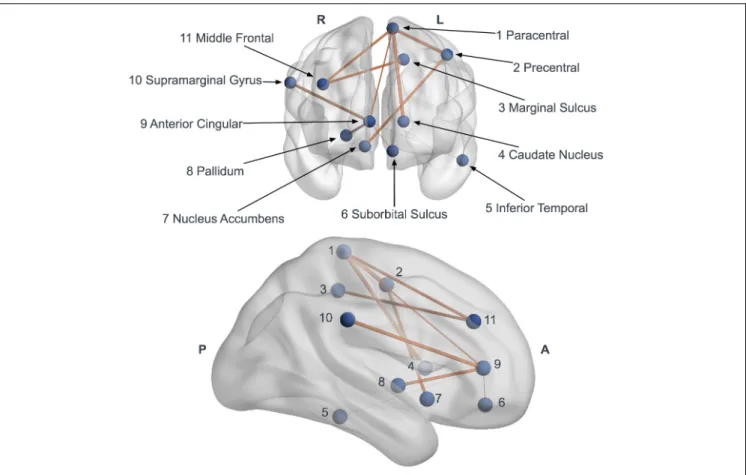
Figure
Documents relatifs
An obvious problem with the electrical resistance type of soil moisture meter is created by the hysteresis effects between wetting and drying conditions. When using a meter s i rnp l
In this work, we addressed the choice of transformed normalized expression profiles rather than raw counts for RNA-seq co-expression analysis under the framework of Gaussian mix-
Moreover, empirical studies on the impact of media coverage and freedom don’t investigate the effect of mass media on electoral participation in developing
Pour atteindre cet objectif, nous allons (1) caractériser la rétention et la dégradation de l'amitrole dans le contexte pédo-climatique français ; (2) identifier les
Artificial Neural Network Answer Set Programming Clinically Isolated Syndrome Convolutional Neural Network Central Nervous System Cerebrospinal Fluid Cortico-Spinal Tract
L’archive ouverte pluridisciplinaire HAL, est destinée au dépôt et à la diffusion de documents scientifiques de niveau recherche, publiés ou non, émanant des
• the various fluxes are also uncertain, e.g. plant losses might be less than or greater than expected, and solar gain will reduce over time due to the accumulation of a dirt film
