HAL Id: hal-02115253
https://hal.archives-ouvertes.fr/hal-02115253
Submitted on 30 Apr 2019
HAL is a multi-disciplinary open access
archive for the deposit and dissemination of
sci-entific research documents, whether they are
pub-lished or not. The documents may come from
teaching and research institutions in France or
abroad, or from public or private research centers.
L’archive ouverte pluridisciplinaire HAL, est
destinée au dépôt et à la diffusion de documents
scientifiques de niveau recherche, publiés ou non,
émanant des établissements d’enseignement et de
recherche français ou étrangers, des laboratoires
publics ou privés.
STEM-EELS identification of TiOXNY, TiN, Ti2N and
O, N dissolution in the Ti2642S alloy oxidized in
synthetic air at 650 °C
Iman Abdallah, Charlotte Dupressoire, Lydia Laffont, Daniel Monceau,
Aurélie Vande Put
To cite this version:
Iman Abdallah, Charlotte Dupressoire, Lydia Laffont, Daniel Monceau, Aurélie Vande Put.
STEM-EELS identification of TiOXNY, TiN, Ti2N and O, N dissolution in the Ti2642S alloy oxidized in
syn-thetic air at 650 °C. Corrosion Science, Elsevier, 2019, 153, pp.191-199. �10.1016/j.corsci.2019.03.037�.
�hal-02115253�
OATAO is an open access repository that collects the work of Toulouse
researchers and makes it freely available over the web where possible
Any correspondence concerning this service should be sent
to the repository administrator:
tech-oatao@listes-diff.inp-toulouse.fr
This is an author’s version published in:
http://oatao.univ-toulouse.fr/23796
To cite this version:
Abdallah, Iman
and Dupressoire, Charlotte
and Laffont, Lydia
and
Monceau, Daniel
and Vande Put, Aurélie
STEM-EELS identification of
TiOXNY, TiN, Ti2N and O, N dissolution in the Ti2642S alloy oxidized in synthetic
air at 650 °C. (2019) Corrosion Science, 153. 191-199. ISSN 0010-938X
STEM-EELS identification of TiO
X
N
Y
, TiN, Ti
2
N and O, N dissolution in the
Ti2642S alloy oxidized in synthetic air at 650 °C
Iman Abdallah
⁎, Charlotte Dupressoire, Lydia Laffont, Daniel Monceau, Aurelie Vande Put
CIRIMAT, Université de Toulouse, CNRS, INP-ENSIACET, 4 allée Emile Monso, BP 44362, 31030, Toulouse Cedex 4, France
A R T I C L E I N F O Keywords: A. Titanium A. Alloys B. STEM C. Interfaces C. Oxidation A B S T R A C T
Oxide-alloy interface of Ti6242S Ti-based alloy was investigated by STEM-EELS technique, after oxidation in both N2-free and synthetic air atmospheres at 650 °C for 1000 h. The chemical shift of Ti-L2,3edge and its specific fine structure along the oxide-alloy interface were used as fingerprint to distinguish the different compositions of titanium nitrides and oxynitrides. TiN, Ti2N and TiNxOywere identified in the sample oxidized in synthetic air at the oxide-alloy interface. Moreover, a decreasing in the oxidation state of Ti oxides was found along with Sn segregation at the oxide-alloy interface for the sample oxidized in N2-free atmosphere.
1. Introduction
Titanium-based alloys such as Ti6Al2Sn4Zr2Mo0.1Si (Ti6242S) are widely used in the aerospace industry because of their high specific mechanical strength. However, at high temperatures and under oxi-dizing conditions, Ti-based alloys undergo oxygen dissolution in addi-tion to the growth of an oxide scale. Depending on time and duraaddi-tion, the oxygen dissolution can affect large depths, which can greatly alter mechanical properties [1,2]. Nitrogen, main air constituent, can also dissolve in titanium and its alloys [3]. In 1986, Chaze and Coddet early reported the decrease in oxidation kinetics of titanium and Ti-X alloys (with X = Al, Cr or Si) when oxidized in a nitrogen-rich environment [4]. They set out three hypotheses to explain such nitrogen effect: (i) decrease in oxygen vacancy concentration in the rutile, (ii) decrease in oxygen solubility within the metallic alloy, (iii) nitride formation at the oxide-alloy interface. However, they did not show any experimental data proving any of these hypotheses. Three recent works brought ex-perimental evidences on the nitrogen effect on the oxidation behavior along the oxide-alloy interface [5–7]. Kanjer et al. reported the for-mation of a continuous nitrogen-rich layer observed by nuclear reaction analysis between the oxide layer and shot-peened grade I titanium, after oxidation at 700 °C for 100 h in dry air [5]. Dupressoire et al. compared the oxidation behavior of Ti6242S Ti-based alloy at 650 °C in synthetic air (80% N2- 20% O2) and under 80% Ar- 20% O2for 100 [6] and
1000 h [7]. Whatever the duration, they observed a decrease in mass variation as well as a decrease in dissolved oxygen and oxygen con-centration at the oxide-alloy interface when the alloy was exposed to the nitrogen-rich environment. Micro-tips were then prepared from
Ti6242S samples exposed to both atmospheres and atom probe tomo-graphy (APT) was performed [7]. While TiO was noticed above the α-Ti phase containing up to 24.5 at. % of oxygen in the tip related to the oxidation in 80% Ar- 20% O2, concentration profiles close to Ti2N and
an oxynitride were noticed in the tip associated to the synthetic air exposure, above a metallic phase containing only 0.8 at. % of oxygen. To confirm this, the oxide-alloy interface of Ti6242S alloy exposed in the same conditions (1000 h at 650 °C under synthetic air or 80% Ar-20% O2) was characterized by electron energy loss spectroscopy (EELS)
technique.
The EELS technique allows obtaining local information at a nan-ometer scale and quantifying the element contents and phase evolution at an atomic level across the interface. Besides, based on the fine structure, the energy threshold and the shift of the Ti-L2,3edges could
differentiate the chemical composition and its crystallographic struc-ture such as TiN, Ti2N and metallic α-Ti [8–10].
2. Experimental techniques
2.1. Materials
Ti6242S alloy studied in this work was forged by Aubert & Duval (Pamiers, France) and presented a duplex microstructure. Its chemical composition, determined by energy dispersive X-ray spectroscopy (EDX), was 10.5 Al, 2.1 Zr, 1.0 Mo, 0.7 Sn, 0.2 Si in at. %. Its compo-sition in gas forming elements, measured by instrumental gas analyses by Evans Analytical Group (Tournefeuille, France) was 3550 O, 2062 H, 103 C, 12 S and < 17 N in at. % ppm. 15 × 10 × 1 mm3samples were
https://doi.org/10.1016/j.corsci.2019.03.037 ⁎Corresponding author.
±
scale on Ti6242S after a change in oxidation behavior from parabolic to linear above 700 °C [11,12]. Stratification of the oxide layer near the oxide-alloy interface is also observed. This phenomenon is mostly ex-plained by the development of compressive stresses within the oxide and tensile stresses in the alloy, due to the high value of the Ti/TiO2
Pilling and Bedworth ratio. When the stresses at the oxide-alloy inter-face reach a bearable maximum value, corresponding to a critical TiO2
thickness, cracking at the oxide-alloy occurs [13–15].
Rutile TiO2 (space group: P42/mnm, lattice parameters:
a = 4.5933 Å and c = 2.9592 Å from JCPDS no. 00-021-1276) was identified within the oxide scale, as highlighted by the selected area electron diffraction (SAED) pattern inFig. 1a taken from an aperture of 300 nm size denoted by the small circle in the oxide layer. This is consistent with our previous study where rutile TiO2was detected by
X-ray diffraction and Raman spectroscopy in addition to α-alumina identified by fluorescence spectroscopy [6]. In the Ti6242S alloy, the β-phase (white contrast inFig. 1a) was easily visible within the α-matrix. Among the alloying elements, Al and O are α-stabilizers and Mo is β-stabilizer, Zr and Si being neutral elements. Qualitative EDX maps of the whole area are presented inFig. 1b; where four chemical elements are highlighted as: Ti-Kα, Al-Kα, O-Kαand Mo-Lα. It confirms that Mo
partitions preferentially form in the β-phase.
Two regions ofFig. 1a were selected to check their chemical com-positions: 1- red square in the upper oxide layer and 2- green square at the oxide-alloy interface.Fig. 2presents the zoom of the STEM-HAADF image on the upper oxide layer and its corresponding EDX maps where Ti-Kα, Al-Kα, O-Kαwere selected. Al-rich oxides were detected on top of
the TiO2layer, which was confirmed by EDX and coherent with our
previous work [6]. Its presence in the upper part of the oxide layer is also in agreement with a study of Chaze and Coddet [16] on the effect of aluminum on the oxidation behavior of titanium between 550 and 750 °C. The presence of an alumina layer, which is a very stable oxide, at the external surface of the TiO2scale has been observed on different
alloys which form a rutile oxide scale: Ti3Al [17], TA6V [18],
Ti-46Al-8Nb [19]. This phenomenon was explained by relative diffusion ki-netics, i.e. kinetic demixing. Indeed, it is known that Al diffuses very fast along channels in the c-axis of the rutile crystal, therefore this specie segregates at the external part of the scale (see [17]). Passing through the oxide-alloy interface as shown inFig. 3, a particular at-tention was made on the nitrogen content in the EDX maps. It is no-ticeable the Al, Ti and O are present in the oxide layer just before the interface, whereas nitrogen is ambiguously present in the alloy next to the interface. To verify the nitrogen content, EDX acquisitions were
Fig. 1. (a) STEM-HAADF image of region (I) of the Ti6242S sample oxidized in synthetic air at 650 °C for 1000 h with an inset of selected area electron diffraction pattern of the oxide layer obtained from a 300 nm aperture. (b) Qualitative EDX maps of the whole area showing Ti, Mo, Al and O chemical elements. (For interpretation of the references to colour in the text, the reader is referred to the web version of this article.)
ground using P240 SiC paper and then cleaned in acetone and ethanol in ultrasound baths before oxidation under synthetic air and 80% Ar-20% O2 for 1000 h at 650 °C. More details on the oxidation tests can be
found in [6,7].
2.2. Characterization
Three cross-sectional 10 × 10 μm2 samples were prepared using a
focused-ion beam (FIB) FEI HELIOS 600i apparatus. Two samples were made from two regions, so called Region I and Region II, randomly chosen from the surface of the Ti6242S specimen oxidized for 1000 h in synthetic air while only one sample was obtained from the same alloy oxidized for 1000 h under 80% Ar- 20% O2. These samples were studied
and chemically analyzed using a JEOL cold-FEG JEM-ARM 200 F transmission electron microscope (TEM), operated at 200 kV and equipped with a Cs corrector probe of 0.078 nm spatial resolution. Characterizations were done using the high-angle annular dark field (HAADF) scanning TEM (STEM) mode. Energy dispersive X-ray (EDX) and electron energy loss spectroscopy (EELS) techniques were used to identify the oxygen and nitrogen content evolution across the oxide-alloy interface. EDX qualitative maps and line scans of the sample were acquired with a JEOL CENTURIO SDD detector. EELS spectra were recorded using a GIF Quantum ER imaging filter. Collective and con-vergence semi angles were 19.4 and 14.8 mrad respectively. The energy resolution of 0.5 eV was determined using the full width half maximum (FWHM) of the recorded zero-loss peak. EELS line scans were recorded from the oxide scale towards the alloy passing through the oxide-alloy interface. An energy dispersion of 0.1 eV/channel was chosen to acquire the Ti-L2,3, N-K and O-K energy loss near edge spectra (ELNES). Each
spectrum was acquired every 0.5 nm to monitor the evolution of the chemical shift and the fine structure changes in the Ti-L2,3 edge profile. 3. Results and discussion
3.1. Ti6242S sample oxidized in synthetic air: (Region I)
Fig. 1a presents a low magnification STEM-HAADF image showing the oxide layer, the oxide-alloy interface and the Ti6242S alloy. STEM-HAADF image contrast depends on the atomic number (Z), such that the brighter and darker regions correspond to higher and lower Z respec-tively. The oxide scale formed in synthetic air was 2 0.1 μm thick and exhibited porosity in its upper part and close to the oxide-alloy inter-face. Several researchers also reported the formation of a porous oxide
done on selected areas on the same STEM image ofFig. 3. The selected areas were chosen to be large enough so the intensity counts are suf-ficient to quantify the composition of the constituent element (Fig. 4). The selected areas taken at positions 1, 2 and 3 indicate a Ti-rich oxide phase in the oxide layer, whereas the other elements have a composi-tion less than 4 at. %. At posicomposi-tion 4, the selected area is taken at the oxide-alloy interface and monitors an abrupt increase in the nitrogen content and a decrease in the oxygen content respectively. After the oxide layer, in the α-phase of Ti6242S, at position 5, the decrease in oxygen content is clear along with the decrease in nitrogen. It is no-ticeable also that Ti and Al contents increase which indicates the α-Ti phase.
In general, EDX technique presents a qualitative information of al-most all contained elements of the periodic table with detection lim-itations for light elements. EELS technique offers much more sensitivity compared to EDX for light element detection such as nitrogen and oxygen. For this, EELS line scan probe passing from the oxide scale towards the alloy was acquired in a 0.5 nm step size to identify the phases present at the oxide-alloy interface and their compositions.
Transition metals (such as Ti) ELNES spectra are identified by the white L3and L2 lines due to spin-orbit splitting of 2p core hole and
transition to 3d states [20,21]. The L3(2p3/2→ 3d) and L2(2p1/2→ 3d)
white lines of metallic Ti are usually detected at 457 and 462.5 eV re-spectively [8]. In all of the following EELS treatment, the background prior to the edges was fitted by a power law method and subtracted off so that only the Ti-L2,3, N-K and O-K edges are shown.Fig. 5a presents a
STEM-HAADF image of the oxide-alloy interface. The latter is composed of four regions: (i) oxide (40 ± 2 nm), (ii) interface (13± 2 nm), (iii) nitride (30± 2 nm) and (iv) Ti6242S alloy. By APT, a nitrogen, oxygen and titanium rich phase was detected over few nanometers on the very end of one micro-tip at the oxide-alloy interface [7]. On this same micro-tip, an oxygen concentration of 4 at. % and 0.8 at. % was mea-sured within Ti2N (∼ 20 nm thick) and the α-phase below the
oxyni-tride region respectively [7].Fig. 5b presents all the EELS spectra of Ti-L2,3, O-K and N-K edges where the modification of the fine structure of
the Ti-L2,3along the line scan and the energy shift of the three edges for
the four regions from oxide to Ti6242S can be seen. In this study, i.e. using the EELS technique, it is interesting to note the absence of N-K Fig. 2. STEM-HAADF image on the upper part of the oxide layer with its corresponding EDX qualitative maps of region (I) of Ti6242S oxidized at 650 °C for 1000 h in synthetic air.
Fig. 3. STEM-HAADF image on the oxide-alloy interface with its corresponding EDX qualitative map of region (I) of the Ti6242S oxidized at 650 °C for 1000 h in synthetic air.
Fig. 4. STEM-HAADF image of region (I) of Ti6242S oxidized at 650 °C for 1000 h in synthetic air at (a) the oxide-alloy interface and (b) corresponding atomic compositions of 5 EDX selected areas positions.
edge in the oxide region as well as the absence of O-K edge in the ti-tanium nitride and Ti6242S region.
To follow the variation of the fine structure from the acquired EELS spectra, one N-K, Ti-L2,3and O-K ELNES spectrum of each region is
plotted inFig. 6a indicated by red, green, blue and brown. The core loss spectra of N-K, O-K and Ti-L2,3provide local information about the
chemical bonding around the excited atoms. Thus, changes in the fine structure or an energy shift is an indication of different chemical compositions and/or crystallographic structure modifications. The oxide layer shows Ti-L2,3and O-K edge ELNES spectra with the absence
of N-K edge. Besides, the Ti-L2,3and O-K edges were compared with
those of reference samples of rutile and anatase where the asymmetry of the peaks and threshold energy position is a direct indication of the crystalline structure [19,22–25]. Brydson et al. and Ruus et al. showed that this asymmetry is resolved into two peaks by high resolution X-ray absorption (XAS) [23,26]. As also seen by electron diffraction, the presence of TiO2rutile is confirmed by the fingerprint approach of the
fine structure. The oxidation state of rutile TiO2is shown by the split of
Ti-L2and L3white lines into 4 peaks as shown inFig. 6a. In rutile (or
anatase) structure, the octahedral coordination of Ti atoms with oxygen splits the degeneracy of unoccupied 3d states (each white line) into lower t2g and higher eg bands [27]. At the interface, the O-K edge
intensity decreases and its profile changes along with the appearance of the N-K edge, highlighting the presence of a titanium oxynitride and confirming the APT observations. It is also noticeable that the white lines L3and L2of Ti have changed. A shift to a lower energy loss value is
also detected. For this, the modifications of Ti-L3and L2fine structure
(four to two peaks) are due to changes in the atomic structure of the first atomic shells around the absorbed atoms. After the oxynitrides of titanium and as nitrogen occupies all the anionic vacancies, the N-K edge peak increased in intensity indicating the nitrogen concentration was greater in the nitride region with the absence of oxygen O-K edge. Oxygen/nitrogen vacancies, defects and changes in lattice parameter from TiO2tetragonal rutile to cubic rock salt TiNxstructure (x changes
as a function of the chemical shift observed inFig. 6b) affected the electron energy loss intensity and led to a shift to lower energy values. To identify the formed titanium nitride, Ti-L2,3and N-K edges were
compared with the study of Terada et al. on the chemical shift of Ti-L3
edge at TiN/Ti interface [8]. They attributed this shift to a change in the chemical bonding of Ti with nitrogen atoms where a certain amount of charge transfers from Ti to N. Experimental ELNES were also verified with simulation using calculated band structure by Khin et al. and Terada et al. [8–10]. In [8], experimental ELNES spectra were com-pared with calculated Ti-L3ELNES depending on the nitrogen vacancies Fig. 5. STEM-HAADF image of region (I) of Ti6242S oxidized at 650 °C for 1000 h in synthetic air at (a) the oxide-alloy interface and (b) its corresponding ELNES spectra of N-K, Ti-L2,3and O-K edges acquired along the line drawn on (a).
Fig. 6. A zoom on ELNES N-K, Ti-L2,3and O-K spectra showing the fine structure changes and the chemical shift of these edges for each region through the oxide-alloy interface in (a) and (b) the evolution of Ti-L2,3spectra passing from TiN to Ti2N and Ti(N) in the nitride region with an inset of N-K edge comparison between TiN and Ti(N). (For interpretation of the references to colour in the text, the reader is referred to the web version of this article.)
present in the TiN crystal structure. In our study and according to the Ti-L2,3energy shift, the nitride region can be divided into three parts.
From the oxide layer towards Ti6242S alloy, the nitrogen concentration decreases from TiN (4 nm), few nanometers of TiN0.5 < x < 1 to Ti2N
(11 nm) and then a nitrogen-rich α-phase within the alloy. The shift to lower energy value in the Ti-L2,3edge from TiN to Ti2N was reported in
Terada et al. as being equal to ∼1 eV [8]. The increase in nitrogen vacancy closer to the alloy would increase the valence charge of Ti that leads to a decrease in L3DOS of Ti. N-K edge of TiN also exhibits a shift
to lower energy loss value compared to N-K edge of N enriched Ti as present in the inset ofFig. 6b. Our results are in good agreement with the work of Terada et al. [8] for both Ti and N energy shifts to lower and higher energy loss values, respectively when nitrogen vacancy in-creases from TiN to Ti(N).
3.2. Sample oxidized in synthetic air: (Region II)
A second TEM FIB sample was extracted from a different region of the Ti6242S oxidized in synthetic air at 650 °C for 1000 h. In this
region, similar analysis was performed on a low magnification STEM-HAADF micrograph where the overall morphology (Fig. 7a) is almost identical to that ofFig. 1a. The oxide scale also measures 2± 0.1 μm in thickness and porosity and stratification are present in the upper region of the oxide scale. The latter is also identified as rutile TiO2by SAED
acquired in similar conditions as in region I. Qualitative EDX maps of the four chemical elements shown inFig. 7b are similar to Fig. 1b. However, in this sample, EELS spectra show no detection of nitrogen in the oxide-alloy interface. For this, different positions of EELS spectra along a line profile are represented on the STEM image (Fig. 8a). In
Fig. 8b, the spectra are divided into three parts: oxide, interface and Ti6242S regions. A decrease in oxygen intensity peak passing from Ti-rich oxide spectrum (A) to a slight oxygen detection in the alloy at spectrum (R) can be noticed. Ti-L2,3 and O-K edges (Spectrum (A))
doesn’t resemble to a rutile or anatase-TiO2where the asymmetry of the
four peaks is different from the rutile TiO2presented in Region I or to
literature data of anatase. Stoyanov et al investigated the lattice dis-tortion accompanied with oxygen vacancies in seven kinds of Ti oxides from tetragonal rutile TiO2 to cubic TiO structure [28]. They also Fig. 7. (a) STEM-HAADF image of region (II) of the Ti6242S sample oxidized in synthetic air at 650 °C for 1000 h with an inset of selected area electron diffraction pattern of the oxide layer obtained from a 300 nm aperture. (b) Qualitative EDX maps of the whole area showing Ti, Mo, Al and O chemical elements.
Fig. 8. STEM-HAADF image of region (II) of the Ti6242S oxidized in synthetic air of (a) the oxide-alloy interface and (b) its corresponding ELNES spectra of N-K, Ti-L2,3and O-K edges in each zone.
monitored that the energy position of the Ti-L2,3edges shift to lower
energy when the oxidation state decreases. The major difference in the electron structure of different oxides such as TiO, Ti2O3and TiO2is the
degree of occupancy of the 2t2glevel where TiO has two electrons,
Ti2O3has one and none for TiO2. In rutile/anatase, the energy position
of Ti-L2,3edge shifts to higher energy compared to Ti because there is
no electron on the first unoccupied 2t2glevel where the screening is
poorest. As the oxidation state decreases, the screening is better and the energy position of Ti-L2,3edge is closer to metallic Ti. The fine structure
of Ti-L2,3and O-K edges of spectrum (A) was compared to the different
oxidation states of Ti oxides presented in the work of Stoyanov et al. [28] and was identified as Ti4O7. Along the oxide-alloy interface, the
fine structure of Ti-L2,3edge exhibiting four peaks corresponding to
Ti4O7progressively changes to only exhibits two peaks for Ti. At the
interface, without nitrogen detected, the shift in energy position of Ti-L2,3edge to lower energy values indicates the decrease in oxidation
state.
A comparison between spectra (B), (I) and (R), shows that at lower
oxidation states, L3and L2split to four peaks (Fig. 9). The decrease in
oxidation state from Ti4O7to TiOx(x < 1.7) and to a solid solution of Ti
(O) is then attributed to an increase in valence charge of Ti atoms and consequently a decrease in its binding energy. Therefore, a shift to lower energy loss value in EELS spectra is observed.
It is also worth noting that Ti-L2,3edges acquired in the α-Ti6242S
after the oxide-alloy interface in both regions are identical as shown in
Fig. 10. This means that the solubility of oxygen or nitrogen in small quantities does not strongly affect the chemical nature of Ti in α-Ti6242S. Also, it is worth noting that neither oxygen nor nitrogen was detected by EELS in a TEM lamella extracted 300 μm underneath the oxide layer of the sample oxidized in synthetic air for 1000 h at 650 °C (the data are not presented in this article).
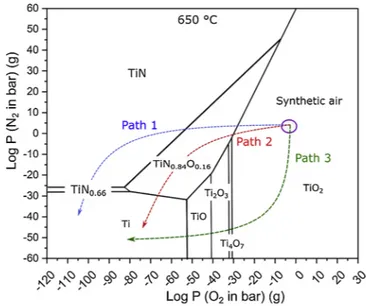
Both observations of Ti6242S oxidized in synthetic air at 650 °C for 1000 h can be explained thanks to TieOeN phase diagram generated at 650 °C using HSC software [29], presented inFig. 11for an oxidation environment made in synthetic air. There exist few diffusion paths to reach titanium. One can cross the oxynitride, TiN and Ti2N (path 1), as
observed in region I, where another one can reach titanium right after the oxynitride (path 2). Another possible diffusion path would only cross oxides (path 3), like region II.
EELS spectra taken in region II of Ti6242S oxidized in synthetic air confirm ‘path 3’ with the decrease in oxidation states of Ti oxide as oxygen partial pressure decreases. On the other hand, formation of oxynitride/nitride layer confirms ‘path 1’ at low oxygen partial pressure plus at the interface of TiO2. At high nitrogen partial pressure, inclusion
of nitrogen atoms starts to fill the oxygen vacancies and oxynitrides are formed.. Formation of oxynitride/nitride could act as a diffusion barrier for oxygen. Therefore, EELS spectra of region I confirm the previous hypothesis.
3.3. Sample oxidized in 80% Ar- 20% O2atmosphere
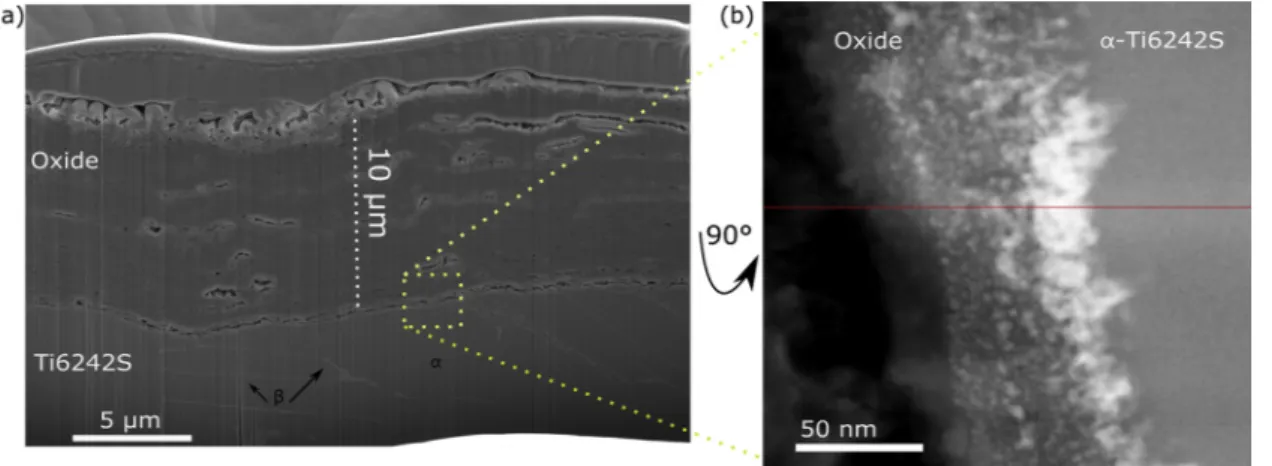
Same analysis as the two previous samples was performed on Ti6242S oxidized in 80% Ar- 20% O2atmosphere. The oxide scale of
this sample is 10 μm thick (Fig. 12a), five times thicker than that of the sample oxidized in synthetic air. The difference in oxide scale is indeed relevant to the oxidizing environment. A selected region of the FIB TEM sample is represented by STEM-HAADF image at the interface region (Fig. 12b). The STEM image shows clearly a difference in contrast from the alloy (light gray) to the oxide layer (dark gray). To identify the bright contrast in the STEM image, an EDX line scan is drawn to show qualitatively the chemical element variation at the oxide-alloy inter-face.Fig. 13shows the intensity of the detected elements as a function Fig. 9. Ti-L2,3electron energy loss spectra (B), (I) and (R) taken from region (II)
of the Ti6242S oxidized in synthetic air. The L2and L3peaks splits into four peaks as oxidation state increases.
Fig. 10. Superposition of the Ti-L2,3edge peaks in α-Ti6242S alloy for the sample oxidized in synthetic air for regions I and II.
of the measured distance. Starting from the oxide region on the left, apart from Ti and O elements, we notice the inclusion of Al for few nanometers in the oxide layer. Afterwards, on the bright region, the intensity of Sn increases along with a decrease in Ti and O intensities. This region corresponds to the oxide-alloy interface. Reaching the alloy,
Ti has the highest intensity counts compared with the presence of Al and O chemical elements that reflects the α-phase of Ti6242S.
In order to better study the chemical nature of this sample, EELS line scan is performed along the oxide-alloy interface on the STEM-HAADF image (Fig. 14a).Fig. 14b presents selected spectra of Ti-L2,3and O-K
edges.
Similar to the sample oxidized in synthetic air (region II), where no nitrogen is detected, O-K edge decreases in intensity as oxygen con-centration is reduced passing from oxide to the alloy region. Ti-L2,3
edge of spectrum (A) is identified as Ti5O9 after comparing its fine
structure with Stoyanov et al. along with O-K edge composed of two peaks at 532.5 and 535 eV. The O-K edge for spectra (B) and (C) de-creases in intensity along with a change of the fine structure and a small shift to higher energy values. This is accompanied with a small shift of Fig. 12. (a) FIB SE image of Ti6242S oxidized in 80% Ar- 20% O2and (b) STEM-HAADF image of the selected area in (a) showing the oxide-alloy interface.
Fig. 13. EDX line scan across the oxide-alloy interface showing qualitatively the present chemical elements: Ti, Sn, and O elements.
Fig. 14. STEM-HAADF image of the sample oxidized in 80%Ar-20% O2of (a) the oxide-alloy interface and (b) its corresponding ELNES spectra of N-K, Ti-L2,3and O-K edges in each zone.
Table 1
Comparison of the Ti-L3energy position of Ti6242S oxidized in 80%Ar-20% O2 atmosphere.
Spectrum Ti-L3edge peak position (eV)
A a: 459 b: 461.1 B 460.9 C 460.1 D 459.4 E 459 F 458.5 G 458.3
Ti-L2,3edge towards lower energy losses indicating a decrease in
oxi-dation state. Closer to the interface, less oxygen concentration is de-tected as shown in the O-K edge of spectrum (D). At the interface, where Sn is segregated, the identified Ti-L2,3edge intensity decrease at
spec-trum (E) is noticed. This is due to the diffusion of Sn identified as well by EDX. The shift of the Ti-L3edge peaks (between 458 and 461 eV)
from spectrum (A) to (G) is summarized inTable 1. Indeed the values of Ti-L3 edge are slightly higher than Stoyanov et al. by less than 1 eV
[28]. This might be because the titanium oxide grew on top of the Ti6242S alloy oxidized at high temperature. The oxygen dissolution deep in the alloy was detected by EELS spectra, where oxygen dis-solution is present after few hundreds of nm.
As a summary, the microstructure of the observed lamellas char-acterized by EELS is presented inFig. 15. It has been observed that in the nitrogen-rich atmosphere, the two samples present different beha-viors at the oxide-alloy interface keeping the same oxide scale. After oxidation in synthetic air, the nitride region is discontinuous along the oxide-alloy interface coupled with the decrease in the oxidation state of the titanium oxide. In the nitrogen-free atmosphere, nitrogen is not present at the interface whereas segregation of Sn is evidenced. 4. Conclusions
In this study, the oxide-alloy interface of Ti6242S alloy oxidized at 650 °C for 1000 h in both nitrogen free and synthetic air atmospheres was investigated by STEM-EELS technique:
1 EDX qualitative analysis showed a nitrogen enrichment at the oxide-alloy interface of the sample oxidized in synthetic air. Then the EELS technique allowed the identification of the phases present along the interface, based on the fingerprint approach using the fine structure and the shift in ELNES peak positions. Below the oxide scale, a 13 nm thick oxynitride was detected above a 30 nm zone composed of TiN and Ti2N. Finally, a Ti(N) solid solution was observed
un-derneath the nitrides. Thus, EELS technique has put in evidence its powerful detection of light elements in the excited atoms at a nan-ometer scale.
2 The observation of a second lamella extracted from the same sample (oxidized under synthetic air) revealed a different composition along the oxide-alloy interface. No nitrogen was detected which could be attributed to its absence at the interface or at a too low nitrogen content, making its detection difficult.
3 A third lamella was extracted from Ti6242S oxidized in nitrogen free atmosphere (80% Ar- 20% O2) for 1000 h at 650 °C. An oxide layer 5 times thicker than the one formed in synthetic air was ob-served. A Ti(O) solid solution and a discontinuous Sn segregation were detected at the oxide-alloy interface. To our knowledge, the
phenomenon of Sn segregation is the first to be observed and its presence might be due to the large titanium and aluminum con-sumption during oxidation which lead to a higher Sn concentration compared to other elements at the interface.
These observations bring evidences of the nitrogen effect on the oxygen dissolution within Ti6242S alloy, when oxidized at 650 °C for 1000 h. The formation of interfacial nitrides or N-rich α-Ti solid solu-tion decreases the oxygen dissolusolu-tion in the alloy and then limits its ingress in the bulk material.
Data availability
The raw/processed data required to reproduce these findings cannot be shared at this time as the data also forms part of an ongoing study. Acknowledgments
Authors thank the ‘Fondation de la Maison de la chimie’ for the post-doctorate grant of Iman Abdallah. Authors thank as well the personnel from ‘Centre characterization Raymond Castaing (UMS 3623)’ Claudie Josse, Alessandro Pugliara and Teresa Hungria for TEM sample pre-paration by FIB and STEM-EELS experiments.
References
[1] W.L. Finlay, J.A. Snyder, Effects of three interstitial solutes (nitrogen, oxygen, and carbon) on the mechanical properties of high-purity, alpha titanium, JOM 2 (1950) 277–286,https://doi.org/10.1007/BF03399001.
[2] H. Fukai, H. Iizumi, K. Minakawa, C. Ouchi, The effects of the oxygen-enriched surface layer on mechanical properties of α+β type titanium alloys, ISIJ Int. 45 (2005) 133–141,https://doi.org/10.2355/isijinternational.45.133.
[3] H.A. Wriedt, J.L. Murray, The N-Ti (nitrogen-titanium) system, Bull. Alloy Phase Diagrams 8 (1987) 378–388,https://doi.org/10.1007/BF02869274.
[4] A.M. Chaze, C. Coddet, The role of nitrogen in the oxidation behaviour of titanium and some binary alloys, J. Less-Common Met. 124 (1986) 73–84,https://doi.org/ 10.1016/0022-5088(86)90478-9.
[5] A. Kanjer, V. Optasanu, M.C. Marco de Lucas, O. Heintz, N. Geoffroy, M. François, P. Berger, T. Montesin, L. Lavisse, Improving the high temperature oxidation re-sistance of pure titanium by shot-peening treatments, Surf. Coat. Technol. 343 (2018) 93–100,https://doi.org/10.1016/j.surfcoat.2017.10.065.
[6] C. Dupressoire, A. Rouaix-Vande Put, P. Emile, C. Archambeau-Mirguet, R. Peraldi, D. Monceau, Effect of nitrogen on the kinetics of oxide scale growth and of oxygen dissolution in the Ti6242S titanium-based alloy, Oxid. Met. 87 (2017) 343–353,
https://doi.org/10.1007/s11085-017-9729-1.
[7] C. Dupressoire, M. Descoins, A. Vande Put, D. Mangelinck, P. Emile, D. Monceau, Understanding of the nitrogen effect on the oxidation behaviour of the Ti6242S titanium-based alloy- contribution of atom probe tomography, submitted to, Corros. Sci. (2019).
[8] S. Terada, K. Asayama, M. Tsujimoto, H. Kurata, S. Isoda, Chemical shift of electron energy-loss near-edge structure on the nitrogen K-edge and titanium L3-edge at TiN/Ti interface, Microsc. Microanal. 15 (2009) 106–113,https://doi.org/10. 1017/S1431927609090175.
[9] Y. Kihn, C. Mirguet, L. Calmels, EELS studies of Ti-bearing materials and ab initio
calculations, J. Electron Spectros. Relat. Phenom. 143 (2005) 117–127,https://doi. org/10.1016/j.elspec.2004.02.170.
[10] C. Mirguet, L. Calmels, Y. Kihn, Electron energy loss spectra near structural defects in TiN and TiC, Micron 37 (2006) 442–448,https://doi.org/10.1016/j.micron. 2005.11.012.
[11] R.N. Shenoy, J. Unnam, R.K. Clark, Oxidation and embrittlement of Ti-6Al-2Sn-4Zr-2Mo alloy, Oxid. Met. 26 (1986) 105–124,https://doi.org/10.1007/BF00664276. [12] B. Sefer, Oxidation and Alpha–Case Phenomena in Titanium Alloys Used in
Aerospace Industry: Ti–6Al–2Sn–4Zr–2Mo and Ti–6Al–4V (Licentiate dissertation). Retrieved from, (2014)http://urn.kb.se/resolve?urn=urn:nbn:se:ltu:diva-26035. [13] C. Beranger, G. et Coddet, Oxydation des métaux à haute température. Rôle des
contraintes internes, J. Microsc. Spectrosc. Électron. 5 (1980) 793–814. [14] G. Bertrand, K. Jarraya, J.M. Chaix, Morphology of oxide scales formed on titanium,
Oxid. Met. 21 (1984) 1–19,https://doi.org/10.1007/BF00659464.
[15] J. Stringer, The oxidation of titanium in oxygen at high temperatures, Acta Metall. 8 (1960) 758–766,https://doi.org/10.1016/0001-6160(60)90170-X.
[16] A.M. Chaze, C. Coddet, Influence of aluminium on the oxidation of titanium be-tween 550 and 750 °C, J. Less-Common Met. 157 (1990) 55–70,https://doi.org/10. 1016/0022-5088(90)90406-A.
[17] J. Rakowski, D. Monceau, F.S. Pettit, G.H. Meier, R.A. Perkins, The oxidation and embrittlement of α2 (Ti3Al) titanium aluminides, Maney Publ. IOM3, Inst. Mater. Miner. Min. 2 (1993) 476–487.
[18] A. Casadebaigt, J. Hugues, D. Monceau, Influence of microstructure and surface roughness on oxidation kinetics at 500–600 °C of Ti–6Al–4V alloy fabricated by additive manufacturing, Oxid. Met. 90 (5-6) (2018) 633–648,https://doi.org/10. 1007/s11085-018-9859-0.
[19] P.E.T. Ngnekou, M.C. Lafont, F. Senocq, L. Laffont, B. Viguier, J. Lacaze, Structural characterization of the scale formed on a Ti-46Al-8Nb alloy oxidised in air at 700 °C, Intermetallics 18 (2010) 226–232,https://doi.org/10.1016/j.intermet. 2009.07.013.
[20] R.F. Egerton, EELS in the Electron Microscope, Plenum, New York, 1986,https:// doi.org/10.1007/978-1-4419-9583-4.
[21] R.D. Leapman, L.A. Grunes, P.L. Fejes, Study of the L23 edges in the 3d transition metals and their oxides by electron-energy-loss spectroscopy with comparisons to theory, Phys. Rev. B 26 (1982) 614–635,https://doi.org/10.1103/PhysRevB.26. 614.
[22] P.L. Potapov, D. Schryvers, Measuring the absolute position of EELS ionisation edges in a TEM, Ultramicroscopy 99 (2004) 73–85,https://doi.org/10.1016/ S0304-3991(03)00185-2.
[23] R. Brydson, H. Sauer, W. Engel, J.M. Thomas, E. Zeitler, N. Kosugi, H. Kuroda, Electron energy loss and X-ray absorption spectroscopy of rutile and anatase: a test of structural sensitivity, J. Phys. Condens. Matter 1 (1989) 797.
[24] A. Gloter, C. Ewels, P. Umek, D. Arcon, C. Colliex, Electronic structure of titania-based nanotubes investigated by EELS spectroscopy, Phys. Rev. B – Condens. Matter Mater. Phys. 80 (2009) 1–6,https://doi.org/10.1103/PhysRevB.80.035413. [25] R. Brydson, B.G. Williams, W. Engel, H. Sauer, E. Zeitler, J.M. Thomas, Electron
energy-loss spectroscopy (EELS) and the electronic structure of titanium dioxide, Solid State Commun. 64 (1987) 609–612,https://doi.org/10.1016/0038-1098(87) 90792-7.
[26] R. Ruus, A. Kikas, A. Saar, A. Ausmees, E. Nõmmiste, J. Aarik, A. Aidla, T. Uustare, I. Martinson, Ti 2p and O 1S X-ray absorption of TiO=2polymorphs, Solid State
Commun. 104 (1997) 199–203,https://doi.org/10.1016/S0038-1098(97)00300-1. [27] D.W. Fischer, Molecular-orbital interpretation of the soft x-ray LII, III emission and absorption spectra from some titanium and vanadium compounds, J. Appl. Phys. 41 (1970) 3561–3569,https://doi.org/10.1063/1.1659472.
[28] E. Stoyanov, F. Langenhorst, G. Steinle-Neumann, The effect of valence state and site geometry on Ti L3,2 and O K electron energy-loss spectra of TixOy phases, Am. Mineral. 92 (2007) 577–586,https://doi.org/10.2138/am.2007.2344.