UNIVERSITÉ DU QUÉBEC À MONTRÉAL
PRODUCTION DE CHALEUR,
FLUX DE CHALEUR ET FL X DE GÉO-NEUTRI IQS DANS LESE VIRONS DE SNOLAB
MÉMOIRE
PRÉSENTÉ
COMME EXIGE CE PARTIELLE
DE LA MAÎTRISE EN SCIENCE DE LA TERRE
PAR
CATHERINE PHANEUF
Ayedissenient
La diffusion de ce mémoire se fait dans le~ respect des droits de son auteur, qui a signé le formulaire Autorisation cie repioètuire. et de diffuser un travail de recherche de cycles supérieurs (SOU-522- Rév.01-2006). Cette autorisation stipule que «conformément
à
l'article 11 du Règlement no 8 des études de cycles supérieurs, [l'auteur] concèdeà
l'Université du Québecà
Montréal une llc~nce non exclusive d'utilisation et de . publication ~e la totalité ou d'une partie importante de [son] travail de recherche pour des fins pédagogiques et non commerciales. Plus précisément, [l'auteur] autorise l'Université du Québec à Montréal à reproduire, diffuser, prêter, distribuer ou vendre des .· copies de. [son] travail de rechercheà
dea flns non commerciales sur quelque support que ce soit, y compris l'Internet. Cette licence et cette autorisation n'entrainent pas une renonciation de [la] part [de l'auteur]à
[ses] droits moraux nià
[ses] droits de propriété intellectuelle. Sauf ententé contraire, [l'auteur] conserve la liberté de diffuser et de commercialiser ou non ce travail dont [il} possède un exemplaire •. "REMERCIEMENTS
En premier lieu, je tiens à remercier très sincèrement mon directeur de mémoire, mon -sieur Jean-Claude Mareschal, d'abord pour m'avoir donné la possibilité de réaliser ce travail, ensuite pour sa confiance et son encadrement et pour son soutient surtout durant les mo -ments d'impatience. Mes remerciements vont aussi à ma codirectrice, Claire Perry.
Merci à mes collègues de classe et de bureau, Erika, Paola et Jean-Michel pour les échanges, l'entraide et la compagnie. Merci à Jean-Claude Mareschal, Claude Jaupart, Hé-lène Bouquerel, Chantal Gosselin et John Armitage pour l'agréable compagnie durant les missions de terrain. Merci à Raynald Lapointe et Chantal Gosselin de m'avoir expliqué le fonctionnement de la presse et de la broyeuse et pour les conseils techniques afin de prépa -rer les échantillons pour leur analyse en radioéléments. Merci également à Virginie pour son coup de pouce avec le broyage des échantillons.
Merci à Claude Jaupart, Hélène Bouquerel, Thierry Rivet et Angela Limare pour l'aide et les explications sur la procédure de préparation des échantillons et pour la réalisation de la mesure de conductivité thermique. Je remercie aussi toute l'équipe du laboratoire de dynamique des fluides de l'IPGP pour leur chaleureux accueil lors de mon stage.
Je tiens également à remercier le centre de recherche du GÉOTOP pour toutes les acti-vités et événements qui ont été organisés, dont les congrès étudiants auxquels j'ai participé. Un merci particulier à Nicole Turcot, secrétaire de direction, et à Sandrine Solignac, coor-donnatrice, pour l'aide qu'elles m'ont apportée sur le plan des tâches administratives.
De même, mes remerciements vont à tout le personnel du laboratoire SLOWPOKE de l'institut de génie nucléaire, pour avoir autorisé l'accès au laboratoire et aux outils, et pour les résultats de concentration en radioéléments des échantillons.
Mes reconnaissances vont au centre de recherche du GÉOTOP et à la faculté des sciences de l'UQAM, pour l'aide financière apportée ainsi qu'aux Fonds de recherche de Québec Nature et technologies pour m'avoir octroyé la bourse de stages internationaux.
Finalement, j'aimerais profiter de l'occasion pour remercier l'ensemble de mes proches
-et amis, spécialement mes parents, Elise et Michel, ma soeur, Mylène, ainsi que mon bea u-frère, Daniel, pour le soutien et les encouragements. Merci à vous tous de croire en moi. Merci à mon petit Olivier, qui me donne l'énergie et le courage de continuer.
AVANT-PROPOS
Ce travail de recherche présente, de façon intégrale, le mémoire de maîtrise que j'ai déposé en décembre 2012 au département des sciences de la Terre et de l'Atmosphère de l'Université du Québec à Montréal comme exigence partielle de la maîtrise.
Ce mémoire de recherche comprend une introduction générale du sujet, suivie de deux articles et d'une conclusion générale. La langue originale des articles (anglaise) a été conser-vée afin d'éviter toute erreur d'interprétation pouvant survenir par la traduction des textes. Par contre, l'introduction et la conclusion générale sont rédigées en français. Dans le but éventuel de soumettre les articles à des revues scientifiques, ils sont présentés de façon à satisfaire les critères relatifs aux règles internationales de publication, soit en format ma -nuscrit, avec les résumés au début et les tableaux et figures à la fin. De plus, chacun des articles est précédé d'un résumé en français, traduit de l'original anglais.
Le premier article s'intitule Airborne radiometrie surveys and crustal heat production near SNOLAB, Canada. Le second article porte le titre suivant : Estimating the global crustal geo-neutrino flux, including a local study near SNOLAB, Canada. La rédaction de ces articles résulte d'une collaboration étroite avec mon directeur de maîtrise, monsieur Jean-Claude Mareschal, professeur de Géophysique au département des sciences de la Terre et de l'Atmosphère et chercheur au centre de recherche en géochimie et géodynamique (GÉOTOP-UQAM-McGill).
REMERCIEMENTS AVANT-PROPOS .
I TTRODUCTION GÉNÉRALE Généralités .. . . .. . . Le budget énergétique terrestre Les géo-neutrinos . . .
L'objectif de ce travail Les études ..
Article 1 Article 2 .
CHAPITRE I (Article 1)
AIRBORNE RADIOMETRIC SURVEYS AND HEAT PRODUCTION NEAR SNOLAB, CANADA . Résumé . Abstract . 1.1 Introduction . 1.2 Geological context 1.3 Thermal regime . .
1.4 Airborne gamma-ray spectrometry and heat production 1.4.1 Airborne gamma-ray
1.4.2 Previous studies . .
1.4.3 Factors perturbing gamma-ray spectrometry . 1.4.4 Interpretation of gamma-ray spectrometry 1.4.5 Application to our study .. . .
1.5 Heat production measurements from core and surface samples . 1.5.1 Heat production distributions . ..
1.5.2 Heat production from core samples 1.5.3 Heat production from surface samples
iii 1 1 1 4 6 7 7 7 14 15 16 17 19 21 21 22 22 23 23 24 27 27 28 29
v
1.5.4 Heat production analysis . 30
1.6 Comparisons and conclusions 31
Tables . . . 34
References . 34
Figures captions 39
Figures . . . . . 40
CHAPITRE II (Article 2)
ESTIMATING THE GLOBAL CRUSTAL GEO-NEUTRINO FLUX, INCLUDING
A LOCAL STUDY NEAR SNOLAB, CANADA 58
Résumé . 59
Abstract . 60
2.1 Introduction. 61
2.2 Crustal geo-neutrino flux predictions 62
2.2.1 Seismic crustal mode! 63
2.2.2 Heat flux mode! . . . . 64
2.3 New heat flux and heat production data in the Sudbury region 66 2.3.1 New sites description . . . . . . . . . . . . . . . . . . . . 66 2.4 Heat flow, heat production and the crustal structure of the Sudbury region 69 2.5 Crustal geo-neutrino component near SNOLAB 71
2.6 Conclusions 72
References . 7 4
Tables . . . 75
Figures captions 79
Figures
2.A Geo-neutrino detection 2.B Measurements . 2.B.1 Heat flux 2.B.2 Thermal conductivity 2.B.3 Heat production . CONCLUSION GÉNÉRALE 80 98 100 100 101 102 104
INTRODUCTION GÉNÉRALE
Généralités
Depuis la publication de la Théorie Analytique de la Chaleur par Fourier (1822) et surtout depuis le premier modèle de refroidissement de la Terre par Kelvin (Thompson, 1862), les géologues et géophysiciens étudient le budget énergétique de la Terre afin de mieux comprendre son histoire et son évolution. Certaines des grandes questions soulevées à l'époque de Kelvin, sur le mécanisme de transport de chaleur et les sources d'énergie de la Terre, ont trouvé des réponses mais d'autres questions restent posées.
Aujourd'hui, nous savons que la Terre s'est formée par accrétion de masse dans la nébu -leuse solaire il y a 4.55 Ga et que, depuis sa formation, elle se refroidit en perdant une partie de sa chaleur primordiale. Cette chaleur est évacuée par les mouvements de convection dans le manteau et le noyau et par conduction dans la lithosphère. La convection entretient les phénomènes tectoniques et magmatiques qui sont responsables d'une partie de la morph o-logie de la surface de notre planète.
Mais à quelle vitesse ce refroidissement se fait-il? Comment le régime convectif et les processus géologiques évoluent-ils avec ce refroidissement?
Le budget énergétique terrestre
Actuellement, nous connaissons la perte totale d'énergie de la Terre, qui est de 46 ± 2 terawatts (1 TW
=
1012 Watts). Cette perte totale est déterminée par la somme des contributions continentale et océanique, qui sont respectivement de 14 et 32 TW (Jaupart et al., 2007).La valeur de 14 TW de chaleur perdue à travers la lithosphère continentale est déter-minée par l'intégration des plus de 35,000 valeurs de flux de chaleur mesurées en région continentale. Ces valeurs proviennent de la récente compilation de Derrick Hasterok mise à jour en 2011. Cette compilation est disponible à http :/ jwww.heatflow.und.edu/.
La plus grande partie de la perte de chaleur de la Terre s'effectue à travers le plancher océanique. On compte un grand nombre de mesures de flux de chaleur (plus de 20,000) sur le plancher océanique, mais ces mesures sont perturbées par la circulation hydrothermale. Par conséquent, ces mesures sous-estiment le flux total en négligeant le transport de chaleur par les fluides hydrothermaux (Lowell et al., 1995). C'est pourquoi la contribution océanique est calculée à partir de modèles de refroidissement du plancher océanique. Ces modèles prédisent le flux de chaleur en fonction de l'âge du plancher océanique. La distribution des âges découle directement de l'hypothèse de l'expansion des fonds océaniques et est calculée à partir de cartes d'anomalies magnétiques marines (Royer et al., 1992; Müller et al., 1997; Sclater et al., 1980). En procédant de cette façon, nous obtenons une contribution océanique de 29 TW.
L'apport des points chauds doit aussi être pris en compte dans la perte de chaleur à travers la lithosphère océanique. Cet apport estimé à 3 TW est déterminé par le vo -lume de bombements bathymétriques et la vitesse des plaques qui leur sont associées. Ces bombements résultent directement de la flottabilité du manteau réchauffé par la présence de plumes mantelliques ascendantes. Leur amplitude est proportionnelle à la différence de température entre les plumes et le manteau avoisinant. Cette valeur représente une limite inférieure puisqu'une plaque peut entrer en subduction avant même que la totalité de la chaleur supplémentaire ait eu le temps d'être évacuée à la surface.
En additionnant les 3 TW de contribution des points chauds, le flux de chaleur océanique s'élève à 32 TW. Avec les 14 TW de perte de chaleur des continents, nous obtenons un grand total de 46 TW (Jaupart et al., 2007).
ous connaissons encore malles contributions relatives des différentes composantes à ce budget. Ces composantes comprennent la production de chaleur de la croûte et du manteau, le flux de chaleur à la frontière noyau/manteau et le refroidissement séculaire du manteau. D'autres sources, telles que la contraction thermique, la différentiation croûte/manteau, la chaleur latente dans le manteau ainsi que la dissipation des marées contribuent aussi au budget. Mais la somme de leurs contributions, inférieure à 1 TW, est moins que l'incertitude de ± 2 TW sur la perte totale d'énergie.
3 Jusqu'à présent, la seule composante dont la contribution est bien établie est la produc -tion de chaleur dans la croûte continentale. Son apport de 7 TW a été fixé par les diverses campagnes d'échantillonnage réalisées à travers toute la croûte continentale ainsi que par les études de flux de chaleur. Par contre, les estimations des autres composantes restent très incertaines.
Le refroidissement séculaire du manteau peut être déterminé à partir de la pétrologie des basaltes Archéens provenant des dorsales mid-océaniques. En déterminant la température de liquidus de ces roches, Abbott et al. (1994) ont conclu que le manteau s'est refroidi de 150 degrés Kelvins (K) en 3 Ga. Si le refroidisssment séculaire présent ne diffère pas trop de sa moyenne à long terme, un taux de refroidissement de 50 K/Ga représente une contribution de 8 TW.
Différentes approches ont été développées et utilisées pour estimer le flux de chaleur à la frontière noyau/manteau. L'une d'elles utilise le flux de chaleur conduit le long de l'adiabatique. De cette façon, le flux de chaleur à la frontière noyau/manteau doit être supérieur à 5 TW (Lay et al., 2008). Cette méthode dépend des valeurs du gradient de température et de la conductivité thermique du manteau profond qui sont très mal connues. Une autre approche est basée sur l'efficacité de la géodynamo. Le flux de chaleur à la frontière noyau/manteau fournit l'énergie nécessaire pour maintenir la convection dans le noyau et entretenir la géodynamo. Ainsi l'énergie dissipée par la géodynamo permet de déterminer le flux de chaleur minimum requis. D'après cette méthode, Buffett (2002) obtient un flux de 5-14 TW. Cette fourchette est très large en raison de la grande incertitude sur l'efficacité thermodynamique de la dynamo.
Récemment découverte par Oganov and Ono (2004), la transition de phase du minéral perovskite (Pv) en un polymorphe plus dense, le post-perovskite (Ppv), permet également d'estimer le flux de chaleur à la frontière noyau/manteau. En utilisant cette nouvelle ap-proche, ?Lay et al. (2008) estiment un flux de chaleur de 9-17 TW.
En résumé, le flux de chaleur à la frontière noyau/manteau est très mal contraint et les estimations de son apport au budget énergétique terrestre varient entre 5 et 17 TW. De la même façon, la contribution de la production de chaleur dans le manteau est mal connue.
Le manteau est inaccessible et donc impossible à échantillonner directement pour mesurer la radioactivité. Dans ces conditions, la méthode utilisée pour estimer la concentration en radio-éléments et la radioactivité du le manteau repose sur des modèles géochimiques et l'analyse des météorites. Les mtéories chondritiques, à partir desquels nous supposons que la Terre s'est formée, représentent des échantillons de matériel silicaté non-différencié. Ces échantillons permettent d'évaluer la composition de la Terre silicatée, que nous appelerons BSE pour Bulk Silicate Earth, qui représente la composition moyenne de l'ensemble croûte et manteau. La production de chaleur déterminée à partir de ces modèles s'élève à 20 TW pour BSE. La différentiation de la croûte, qui enlève 7 TW, laisse une contribution mantellique de 13 TW avec une incertitude de ±20%.
Tandis que plusieurs chercheurs tentent d'améliorer les estimations du flux de chaleur à la frontière noyau/manteau, un nouveau développement très prometteur est apparu récem -ment. Il s'agit de l'utilisation d'observatoires de neutrinos pour détecter des géo-neutrinos, c'est-à-dire des neutrinos provenant de la désintégration des éléments radioactifs dans la Terre. Ce nouveau développement pourrait permettre, par l'observation de ces neutrinos d'origine terrestre, de déterminer la concentration en radioéléments dans le manteau et d'obtenir une meilleure estimation de la production de chaleur du manteau. Finalement, nous pourrons mieux calculer les autres composantes du budget et estimer le taux de refro i-dissement séculaire.
Les géo-neutrinos
Les neutrinos sont des particules élémentaires de masse quasi-nulle dont l'existence avait été supposée par Pauli (1930) qui tentait d'expliquer le spectre continu de la désintégration (3. C'est beaucoup plus tard, lors d'une expérience développée par Cowan et Reines à la centrale nucléaire de Savannah River, que ces particules furent détectées directement pour la première fois (Cowan, C.L., Reines, Jr., F., Harrison, F.B., Kruse, H.W., McGuire, A.D., 1956).
Ces particules possèdent l'unique caractéristique d'intéragir seulement par les forces faibles, ce qui leur permet de passer sans intéraction à travers la matière à une vitesse proche
5
de celle de la lumière. De ce fait, elles peuvent transporter de l'information provenant de sources très lointaines. C'est pour cette raison qu'après leur découverte, les physiciens et astrophysiciens se sont immédiatement intéressé à ce processus, afin d'étudier les réactions de fusion nucléaire au coeur des étoiles et du soleil. En 1969, dans la mine d'or de Homestake, au Dakota du sud, on a observé les premiers neutrinos d'origine solaire. Depuis, plusieurs observatoires observent ces particules afin d'étudier les mécanismes de fusion nucléaire et de résoudre différents problèmes d'astrophysique.
Un développement très prometteur pour les géosciences a eu lieu dans quelques-uns de ces observatoires d'astro-physique. Diverses modifications apportées aux détecteurs ont permis l'observation directe d'anti-neutrinos, les neutrinos électroniques d'origine terrestre, aussi appelés géo-neutrinos. Ces anti-neutrinos électroniques sont engendrés lors de la dés -intégration f3 dans la chaîne de désintégration des isotopes radioactifs d'uranium, thorium et potassium. La désintégration des noyaux atomiques de ces isotopes est la plus importante source de chaleur à l'intérieur de la Terre.
L'utilisation de ces géo-neutrinos avait été suggérée par Eder G. (1966) et par Marx (1969). Dans les années 80s, Krauss et al. (1984) ont discuté de leur unique potentiel pour les géosciences, de mesurer la radioactivité et la concentration en radioéléments. Depuis, plusieurs chercheurs s'y sont intéressés et beaucoup d'études ont été publiées, discutant du potentiel pour déterminer la production de chaleur radiogénique et pour tester le modèle de BSE (Kobayashi and Fukao, 1991; Rothschild et al., 1998; Raghavan et al., 1998; Fiorentini et al., 2003, 2005; Mantovani et al., 2004).
Dans un détecteur de géo-neutrinos, qui est composé de liquide scintillateur, l'interac -tion entre un anti-neutrino électronique et un proton engendre un positron et un neutron. Lorsque le neutron est désintégré en un proton et électron avec un délai exact de 210 J..LS, cette désintégration émet un rayonnement gamma de 2.2 MeV, de concert avec le signal d'an nihi-lation du positron. C'est cette exacte coïncidence qui permet de s'assurer que l'évènement est du à la désintégration d'un anti-neutrino issu de la réaction inverse de la désintégration (3. Toutefois, à cause de sa très faible section efficace, cette réaction reste très difficile à observer. Même avec un très gros détecteur, le nombre d'événements est de quelques di
-zaines par année. Un autre obstacle provient du bruit des réacteurs nucléaires avoisinant qui domine les observations.
En 2005, le groupe de collaboration KamLAND a publié les premiers résultats sur les géo-neutrinos détectés à l'observatoire de géo-neutrino Kamioka (KamLAND), au Japon (Araki, T. and 89 collaborators, 2005). Ces résultats ont permis de démontrer la capacité des détecteurs de géo-neutrinos à mesurer la radioactivité et la concentration en radioél é-ments. Mais la grande incertitude due au fort signal des réacteurs nucléaires avoisinants et à la radioactivité crustale de la région n'a, jusqu'à maintenant, permis aucune amélioration spectaculaire de nos connaissances. D'autres résultats ont été récemment publiés (Bellini, G. and 89 collaborators, 2010; Gando, A. and 65 collaborators, 2011).
Un nouveau détecteur de géo-neutrinos sera bientôt mis en activité à l'observatoire de Neutrinos de Sudbury (SNOLAB) qui entre dans la phase S 0+. Cet observatoire a l'avantage d'être moins exposé que KamLAND au bruit des réacteurs nucléaires. Par contre, il semble que la région de Sudbury est plus riche en éléments radioactifs que le reste du Bouclier Canadien ce qui complique l'étude de la radioactivité mantellique.
L'objectif de ce travail
L'objectif principal de ce travail est de déterminer le flux de géo-neutrinos provenant de la croûte près de l'observatoire SNOLAB. En déterminant le flux de géo-neutrinos générés par la désintégration des éléments radioactifs dans la croûte, nous pourrons calculer la contribution du manteau au flux total qui sera observé par les expériences suivant la mise en oeuvre de la phase SNO+. Nous pourrons calculer la concentration en U et Th ainsi que leur apport au budget énergétique de la Terre. Par contre, il reste impossible d'obtenir des résultats pour K dont l'énergie (1.31 MeV) est sous le seuil de détection (1.8 MeV).
Le flux de géo-neutrinos et le flux de chaleur dépendent directement de la radioactivité de la croûte terrestre. Pour déterminer cette radioactivité, nous disposons de mesures sur échantillons de forages ou de surface, de mesures de flux de chaleur et de données radio-métriques aéroportées. ous calculerons la radioactivité crustale à partir de ces différentes
7 données. Nous utiliserons ces résultats pour prédire le flux de géo-neutrinos d'origine crustale dans la région de Sudbury.
Les études
Article 1
La première partie de ce mémoire est écrite sous la forme d'un article scientifique intitulé Airborne radiometrie surveys and crustal heat production near SNOLAB, Canada.
Le but de cet article est de comparer la production de chaleur crustale déterminée à partir des données d'études radiométriques aéroportées avec des mesures de production de chaleur effectuées sur des échantillons par analyse géochimique.
Pour ce faire, nous avons comparé des données radiométriques recueillies lors d'une
étude aéroportée dans région de Sudbury avec des mesures de production de chaleur sur
échantillons. Les échantillons ont été recueillis en surface, le long d'un transect et dans des
forages d'exploration minière. Les données de l'étude aéroportée proviennent de la banque de données géoscientiques (EDC) du secteur des sciences de la Terre du ministère des Ressources naturelles du Canada. Les mesures sur échantillons proviennent de travaux antérieurs de plusieurs chercheurs et de nos mesures.
Ce travail nous a permis de conclure que les données radioactives provenant de levés
géophysiques aéroportés sous-estiment la radioactivité de la croûte. Par conséquent, ces
données ne seront pas utiles pour calculer la radioactivité et prédire le flux de géo-neutrinos d'origine crustale.
Article 2
La seconde partie de ce mémoire est aussi présentée sous la forme d'un article scientifique.
Le titre de ce deuxième article est Estimating the crustal geo-neutrino flux, including a local
Dans ce travail, nous discutons des différentes approches qui ont été utilisées jusqu'à maintenant pour estimer la composante crustale du flux de géo-neutrinos. Nous présentons une nouvelle approche qui utilise des mesures de flux et de production de chaleur afin de calculer cette composante crustale. Nous comparons notre modèle avec celui de Fiorentini et al. (2005) qui est basé sur l'épaisseur de la croûte terrestre et sur des modèles géochimiques de distribution des radioéléments à l'intérieur de la Terre. Nous concluons que l'utilisation des mesures de flux et de production de chaleur est la meilleure méthode pour déterminer la composante crustale du flux de géo-neutrinos. Nous présentons des nouvelles mesures de flux et de production de chaleur provenant de deux nouveaux sites situés dans la région de Sudbury. En utilisant toutes les mesures disponibles, nous calculons la composante crustale du flux de géo-neutrinos dans le voisinage de SNOLAB.
CHAPITRE I (Article 1)
AIRBORNE RADIOMETRie SURVEYS AND HEAT PRODUCTION NEAR S OLAB,
Résumé
La production de chaleur crustale doit être estimée le plus précisément possible pour les futures expériences sur les géo-neutrinos envisagées à l'Observatoire de Neutrino de Sudbury (SNOLAB).
Nous comparons la production de chaleur crustale dans la région de Sudbury estimée à partir de levés radiométriques aéroportés, de mesures sur échantillons de carottes provenant de forages d'exploration minière, de mesures sur échantillons de surface et de mesures sur des échantillons prélevés le long d'une traverse. Les levés aéroportés ont une résolution spatiale élevée (1000 m) et montrent une bonne corrélation avec la géologie régionale, mais ces données sont sensibles qu'à la partie superficielle de la croûte. Ils donnent une production de chaleur moyenne de 0.87
±
0.58 f..LW m-3 pour plus de 7,000 valeurs. Les mesures sur échantillons de surface prélevés le long de la traverse donnent une production de chaleur moyenne de 2.93± 2.42 f..LW
m-3, les mesures sur échantillons de carottes de forages donnent une moyenne de 1.79±
1.49 f..LW m-3 et les mesures sur échantillons de surface donnent une moyenne de 1. 35±
1. 63 f..L W rn -3. Ces valeurs élevées de production de chaleur obtenue sur les échantillons sont consistentes avec les mesures de flux de chaleur de la région de Sudbury qui sont plus élevées que la moyenne du Bouclier Canadien. La différence entre les résultats des levés aéroportés et des échantillons est probablement due à l'altération du mort-terrain. Notre étude montre que les levés radiométriques ne sont pas susceptibles de fournir des estimations suffisament fiables pour calculer le flux de géo-neutrinos crustal, ainsi la production de chaleur crustale doit être calculée à partir des mesures de flux de chaleur et de production de chaleur sur des échantillons de surfaces et de carottes de forage.11
Abstract
Crustal heat production must be estimated as precisely as possible for future experiments
on geo-neutrinos envisaged at the Sudbury Teutrino Observatory (Sl OLAB).
We compare estimates of crustal heat production in the Sudbury region from airborne radiometrie surveys, from measurements on core samples from mining exploration drill holes, from measurements on surface samples and from measurements on samples collected on a transect. Airborne surveys have a high spatial resolution (1000 rn) and they show a correla-tion with the regional geology but these data are only sensitive to the very shallow part of the crust. They give a mean heat production of 0.87
±
0.58 f..LW m-3 for more than 7,000values. Measurements on surface rock samples collected on the transect yield an average
heat production of 2.93
±
2.42 f..LW m-3 , measurements on core samples from drill holesgive a mean of 1.79
±
1.49 f..LW m-3, and surface samples yield an average of 1.35±
1.63f..L W rn -3. These high heat production values obtained on samples are consistent with heat
flux measurements in the Sudbury area that are higher than the average Canadian Shield. The difference between results from airborne surveys and samples are perhaps due to the
alteration of the overburden.
Our study shows that the airborne radiometrie surveys are not likely to provide the
reliable estimates needed to calculate the crustal geo-neutrino flux, and that crustal heat production must be calculated from heat flux and heat production measurements on rock and core samples.
1.1 Introduction
The global energy budget of the Earth and all its components has been studied for many decades. The Earth is a non-equilibrium system. The total outgoing flux of energy through the Earth's surface is not balanced by the internally produced energy. This difference is equal to the secular cooling of the Earth. To balance this budget and estimate the secular
cooling rate, we need to obtain good estimates of each tenu that contributes to the Earth's
energy budget.
The total energy loss of the Earth is well established at 46
± 2 TW
(Jau part et al., 2007). This value is determined by the sum of the continental and oceanic heat fluxes of 14 and 32 TW, respectively. On the other hand we do not know precisely the relative contribution of all the components of this budget. The most important terms are the Earth radiogenic heat production, which is divided between the mantle and crust, and the secular cooling of the core and mantle. So far, the only well established tenu is the crustal heat production with 7 TW (Jaupart et al., 2007).One approach to estimate the secular cooling rate is to constrain the mantle heat produ c-tion contribution through different geochemical models of Bulk silicate Earth (BSE) (Hart and Zindler, 1986; McDonough and Sun, 1995; Palme and O'Neill, 2003; Arevalo et al., 2009). These have lead to a mantle contribution of 13 TW with an uncertainty of 20% (Ja u-part et al., 2007). This uncertainty is high and leaves a large doubt on our understanding
of the Earth's energy budget and its evolution. To improve our understanding of the energy
budget of the Earth and to better assess the secular cooling rate, we need to obtain better estimates of the radiogenic mantle's contribution.
The recent improvement made in underground neutrino observatories might be the key for direct determination of the mantle heat production (Kobayashi and Fukao, 1991; Roth-schild et al., 1998; Raghavan et al., 1998; Fiorentini et al., 2003; Mantovani et al., 2004; Fiorentini et al., 2005; Dye et al., 2006; Enomoto, 2006; Enomoto et al., 2007; Dye and
Guillian, 2008; Dye, 2010). A neutrino observatory is located in Canada : the Sudbury
- - - - -- - -- - - - -- - - -- - - -
-13 consist of using a large liquid scintillator detector, will allow the observation of low energy geo-neutrinos (>1.8 MeV) from radioactive elements, uranium and thorium.
The first experimental geo-neutrino study was reported at the Kamioka observatory in Japan (Araki, T., and 86 collaborators, 2005). Their result is consistent with predictions
made from Earth models, but the uncertainty on the heat production from U and Th remains very large. The geo-neutrino flux detected was low due to the low radioactivity of the Japan crust, strong noise of nearby nuclear reactors and the detector's radioactivity. However, this first result has demonstrated that geo-neutrinos have the ability to constrain the radioactivity of the Earth's interior. Other geo-neutrino experiments were conducted at the Laboratori Nazionali del Grande Sasso in Italie (Bellini, G., and 89 collaborators, 2010). They were able to observe a higher geo-neutrino rate compared to the first xperiment since
the Borexino detector is affected by a lower number of background events. They observed a
higher geo-neutrino rate (3.9+1.G -1.3 events/(100 ton.yr)) than curTent BSE predictions of 2.5
±
0.2 and 3.6 events/(100 ton.yr) from Fogli et al. (2005) and Rothschild et al. (1998), respectively. However the uncertainty is still too large to lead to definitive conclusions.To determine the radioactivity and the composition of the mantle from results to be
obtained during future experiments planned at SNOLAB, the geo-neutrino flux of the crust in the vicinity of SNOLAB must be estimated as accurately as possible.
Enomoto et al. (2007) have tried to constrain the crustal geo-neutrino component by summing the heat production contribution of the different geological units around Ka m-LAND. Even with all the geological and geophysical studies that were made in the Sudbury
region, the deep crustal composition around the observatory remains ambiguous and leaves
high uncertainty on the crustal geo-neutrino flux calculation using this method (Perry et al., 2009). Another method from Fiorentini et al. (2005) relies on global crustal models along with geochemical studies onU, Th, and K distribution in the Earth's interior. Their model neglects lateral heterogeneities, since their estimate of geo-neutrino flux variation is generally associated with crustal thickness (Perry et al., 2009).
Perry et al. (2009) show how one can rely on heat flux and heat production measure -ments to calculate the crustal geo-neutrino flux. In the Sudbury region, sorne heat flux and
heat production data are available. But the density of these measurements is insufficient
to precisely calculate the crustal geo-neutrino flux. Airborne radiometrie surveys are also
available in the Sudbury area. These surveys have high spatial resolution and they caver large areas. Using these data to calculate the heat production of the crust would greatly fa-cilitate the task by reducing field and laboratory measurements. Before doing that we must
determine whether these data are sufficiently reliable to assess the crustal heat production
with the accuracy needed in arder to calculate the crustal geo-neutrino flux?
The main objective of this work is to compare crustal heat production determined from
airborne radiometrie survey dataset with heat production measurements made on surface and core samples through geochemical analysis. To do so, we used radiometrie dataset collected during an airborne survey over the Sudbury area, heat production measurements
made on surface samples (Lewis and Bentkowski, 1988), heat production measurements
made along a transect (Schneider et al., 1987) and heat production measurements made on core samples from mining exploration drill hales (Jessop and Lewis, 1978; Drury and Taylor, 1986; Pinet et al., 1991; Perry et al., 2009).
1.2 Geological context
The Sudbury Neutrino Observatory is located on the south range of the worlds
lar-gest preserved impact melt sheet, which is known as the Sudbury Igneous Complex (SIC), the host of important nickel deposits. More precisely, the SNOLAB detector is situated at 46.475°N and 81.201 °W, 2039 meters below the surface in the Creighton's nickel mine owned
by Yale INCO.
The SIC is the consequence of a meteoric impact that occurred at approximately 1.8 Ga in the PaleoProterozoic era (Krogh et al., 1984). Its extraterrestrial nature was long debated until the discovery of shock metamorphisms features (Dietz, 1964). The SIC is located at the contact of the eo-Archean basement rocks of the Superior Province and the low grade metamorphosed sediments of the Huronian supergroup, part of the PaleoProterozoic Southern Province (Figure 1.1). Located about 15 kilometers southeast of the structure is the Grenville front. This late Proterozoic orogeny has given the basin its present elliptical
15 shape (Dietz, 1964).
The main geological units characterizing the Sudbury structure are the post impact sediments of Whitewater group, which filled the central depression, the underlying Sudbury Igneous Complex (SIC) and the footwall brecciated rocks (basement rocks) (Figure 1.2). Figure 1.2 was modified from Ames et al. (2006).
The Whitewater group is composed of three main sedimentary formations. From inside out are the Chelmsford, the Onwatin and the lowermost Onaping formations (Figure 1.2). The Chelmsford formation is composed of turbiditic wacke and siltstone while the Onwa-tin formation is mostly constituted of carbonaceous and pyritic argilite and siltstone. The Onaping formation originated from the fallback material excavated during the impact. It is composed of "glass-rich" breccias and many inclusions of granitic basement rocks (French, 1967). The SIC consists of an upper :0one of granophyre, a thin middle layer (Transition Zone) of quartz gabbro and a lower zone of norite.
The northern footwall rocks comprise the Neoarchean Levack gneiss complex, which form a wide belt surrounding the north and east ranges of the SIC, and the intruding granite of the Cartier Batholith. About 20 km northwest of the structure, the Batholith is intruded by the metavolcanic and metasedimentary rocks of the Benny east-west-trending greenstone belt. South of the Benny belt are exposed, as isolated outliers, some Huronian rocks and some Nipissing diabase.
Meldrum et al. (1997) have shown that the Cartier Batholith is anomalously enriched in both U and Th; average values are over 5 and 33 ppm, respectively compare to the average continental crust concentration of 1.3 and 5.6 ppm (Rudnick and Gao, 2003). They propose that the Batholith was issued from partial melting of the Levack Gneiss Complex. They also reported that a detailed radiometrie survey ( unpublished) has also demonstrated the high level of radioactive elements present in the Batholith compared to the Levack Gneiss complex, SIC and Benny Belt rocks.
The southern footwall is located between the SIC and the Grenville front and is composed of the metasediment and metavolcanic rocks of the lower groups of the Huronian Supergroup,
lower and upper Elliot Lake and Hough Lake. Enclosed in the lower Elliot Lake group, on the south range of the structure, are found the Creigton and Murray granitic plutons. East of the SIC are found the Cobalt Lake and Quirke Lake groups. All these groups are intruded by the Nipissing diabases. The Chief Lake Igneous Complex (CLIC) is found about 20 km south of the structure, near the Grenville Front.
Meldrum et al. (1997) also proposed that uranium-rich paleoplacer deposits (Elliot Lake and Agnew Lake) as well as uraniferous detritus found in the Huronian Supergroup are due to the uplift and unroofing of the Batholith since they have mineralogical and geochemical characteristics in common. Easton (2009) reported the present of conglomerate units with uranium mineralization within the Elliot Lake group deposited by a northwest to southeast paleoflow. He suggested that these targets are not accessible to airborne surveys since due to their shallow to moderate dips.
1.3 Thermal regime
The Canadian Shield has been stable for
>
1 Gy and its thermal regime is in steady state. heat flux below the upper ernst is roughly constant with a value of 33 mW m-2 and the Moho heat flux varies in the narrow range of 12-18 rn W m-2 (Jau part and Mareschal, 1999; Mareschal and Jaupart, 2004). Thus, the lateral variations observed in surface heat flux measurements, which vary from 80 mW m-2 to 23 mW m-2 in the Canadian Shield, reflects the heat generated< H
> in
the crustal layer as :(1.1) where Q is the surface heat flux, Qm is the Moho heat flux and Zm is the crustal thickness. So far, heat flux measurements were made at 13 sites in the Sudbury region (see Table 1.1 for an overview of measurements and Figure 1.4 for their location). The heat flux varies between 43 mW m-2 and 61 mW m-2
, and is considerably higher than the average heat flux of 42 mW m-2 of the Canadian Shield (Figure 1.3 and 1.4). This high heat flux is due to local upper crustal radio elements enrichment. This enrichment will have consequences
17 for the geo-neutrino studies planned at SI OLAB b cause of the high crustal geo-neutrino
flux, perhaps as much as 50% higher than the average Shield (Perry et al., 2009).
The Sudbury heat flux values were obtained from a compilation of all the beat flow data available in the Sudbury region from (Perry et al., 2009) as well as tlnee nearby sites, Elliot Lake (Sass et al., 1968), East Bull Lake (Drury and Taylor, 1986), and Sturgeon Falls (Pinet et al., 1991) (see Figure 1.1 for their location). The latter sites are located further away from Sudbury but they are worth mentioning because their high heat flux indicate that the crustal radioactivity is high in a wide area around Sudbury.
1.4 Airborne gamma-ray spectrometry and heat production
1.4.1 Airborne gamma-ray
Gamma-ray spectrometry is a powerful tool that permits to detect the environmental
radioactivity. The method consists of measuring gamma-rays released during the s
ponta-neous decay of radioactive elements (in particular, K, U, Th). Gamma-rays are high energy photons that can travel up to several hundred meters in air and more than 30 centimeters
in rocks (Grasty et al., 1979). Thus, gamma-ray spectrometry provides an efficient tool for
detecting and mapping the concentration of radioactive elements present at the Earth's surface but have no significant depth of penetration.
Gamma-ray spectrometry was first used for uranium exploration and with the latest
instrumental and procedure advances, has become a general tool useful in several geoscience
disciplines (IAEA, 2003). Radiometrie surveys can be completed on the ground or in the air.
Airborne radiometrie surveys can quickly cover a broad region and can be accompanied by
using a multi-sensory spectrometer, to measure other geophysical variables such as magnetic
and electromagnetic data. Such methods are v ry effective for geological mapping, provided the superficial stratum has not been sheltered by transported sediments.
1.4.2 Previous studies
Data collected during airborne gamma-ray surveys were used to estimate the crustal heat production in the well exposed granite-greenstone terrane of the Achaean Pilbara Cra-ton, Western Australia by Bodorkos et al. (2004). These authors investigated the accuracy and potential of these data to estimate crustal heat production by comparing results with heat production determined by geochemical analysis on ground samples. They found that airborne sm·veys lead to area-average heat production 10 to 50% lower than heat production calculated through geochemical analysis on bedrock samples. They concluded that the lower heat production from surveys is due to K depletion from weathering in the overburden and U enrichment or depletion due to a disequilibrium in the U-238 decay chain (Bodorkos et al., 2004).
Kukkonen (1989) has assessed the heat production of the bedrock in the Baltic Shield of Finland. The number of unperturbed heat flux measurements and core samples heat production measurements available in the region was insufficient for the purpose of its work. Consequently, an alternative approach was needed. Following Vaittinen (1986), he used glacial till samples instead of airborne radiometrie dataset. In his work, Vaittinen has compiled apparent heat production maps for a few test areas using airborne gamma-ray spectrometry. He concluded that airborne measurements are highly sensitive to overburden and vegetation effects and are therefore very difficult to combine with drill hole data.
1.4.3 Factors perturbing gamma-ray spectrometry
Some environmental factors such as air density changes, temperature inversion layer or soilmoisture can influence gamma-ray spectrometry but they can easily be avoided by not investigating in the early morning or just after a rainfall. Other effects are not escapable and must be considered in the interpretation of surveys. Weathering modifies the concentration and distribution of the radioelements relative to that of fresh bedrock. Knowledge of the specifie behavior of K, Th and U elements in weathered environments is important for a good interpretation. The concentration of K generally decreases with increasing weathering.
19
K is a highly soluble element and gets easily leached from the weathering profile (Curtis,
1976). On the other hand, This normally retained. This is illustrated in very high weathered materials such as bauxitic soils, where a high-Th concentration is usually observed (Wilford, 1995). Uranium is relatively soluble under oxidizing conditions but is retained or precipates in reducing environments. Thus, U is easily leached from rocks, but may be deposited in sediments nearby. Usually in advanced stages of weathering U is leached from the profile relative to fresh rocks.
1.4.4 Interpretation of gamma-ray spectrometry
The interpretation of airborne radiometrie surveys reposes on the variation of K, Th and U elements over the studied area. But in regions of varying level of alteration an exa-mination of derived products such as ratios and ternary maps may reinforce understanding of radioelements concentration variation. The ternary RBG (Red, Blue, Green) image and ratios are useful for illustrating the relationship between weathered and unweathered areas.
In the RBG image, regions of bright green color illustrates high level of weathering and in
contrast red color indicates region poorly affected by weathering. Black to brown regions
indicate low concentration in 3 radioelements (K, Th and U) while white regions illustrate
a high level of these elements.
1.4.5 Application to our study
Since 1967, a Federal/Provincial cooperation program (Uranium reconnaissance
pro-gram) has completed hundreds of surveys across Canada to support mapping and mineral exploration (Darnley et al., 1975). Data collected during these investigations are available in the Geoscience data repository of the Geological Survey of Canada as a series of open files.
Uranium reconnaissance program's surveys have, in general, been completed using a fixed wing sky van aircraft, at ground clearances of about 120 meters and at fiight speed of 120 knots (about 155 m/s). Gamma-ray spectra were sampled at 1 second intervals using a
256 channels spectrometer accorded to a large detector volume (50 litres of Nal crystals). The standard procedure is detailed in Dristow (1983). The primary results obtained are displayed in the fonn of an energy spectrum within the energy range 0-3 MeV. These raw measurements are monitored over four spectral windows, three centered at 1.46 MeV for potassium (K), at 2.61 MeV for thorium (Th), at 1.76 MeV for uranium (U) and the total count covering the full spectral range of these elements. Raw acquisitions are then corrected from undesirable variables, stripped and adjusted for attenuation with height and finally converted to equivalent concentration of radioelement at ground level. Calibration and data processing procedure are detailed in Minty (1997).
In this work we used a airborne survey conducted in the Sudbury area, in 1989 with a resolution of 1000 meters. The survey covers the region comprise b tw en -80.53 to -81.93 degrees in longitude and 46.22 to 47.03 degrees in latitude.
The data file for this survey contains the latitude, longitude, time, date, and altitude at which data were recorded and the following radiometrie variables : Potassium (K, %), equivalent Uranium (eU, ppm), equivalent Thorium (eTh, ppm) and the total air absorbed dose rate (NADR, nGy/h) as well as five derived products (ratios, ternary and natural air absorbed dose rate).
From these data we calculated the beat generated from radioactive decay by summing the total contribution of each radioactive elements with the following formula :
H = 10n(9.52[U]
+
2.56[Th]+
3.48[K]) (1.2) where [U] and [Th] are the uranium and thorium concentration in ppm and [K] is the potassium concentration in %. Heat production is calculated in Wkg-1. To calculate heat production per unit volume, A, we use an average crustal density of 2700 kg rn -3 .A= 0.257[U]
+ 0.069[Th]
+
0.094[K] (1.3) where A is the heat production per unit volume in f.L W rn -3 .- - - -- -- - - -- - -
-21
Resulting heat production calculated from gamma-ray measurements is shown on a map (Figure 1.5). This rnap was made by averaging airborne radiometrie data over 0.01° x 0.01° cells over a region of 0.6 degrees in latitude and 1.5 degrees in longitude more or less centered on SNOLAB.
vVe found low heat production values within the Sudbury structure, the South rn and the Grenville Provinces, and higher values in the Superior Province, northwest and west of the structure. The average heat production within the Sudbury region determined from these datais 0.87
±
7.5 xlo-5 J-LW m-3 with a standard deviation of 0.58 J-LW m-3 (Figure 1.6). This average was calculated from cell averages, over 7000 values.Figure 1.7, 1.8 and 1.9 show the individual K, Th and U concentration maps, respectively. They correlate together as well as with the heat production map (Figure 1.5).
High heat production areas northwest and west of the structure, in the Superior Pro-vince, is associated with the granites of the Cartier Batholith. Heat production decreases north of the Batholith where lie the metasedimentary and metavolcanic rocks of the Benny
belt and isolated outliers of the Huronian rocks and Nipissing diabase. The high heat pro-duction of the Superior Province is also marked at the border with the Southern Province
southwest of the structure (well defined heat production contrasts fit the geological bo un-dary).
ln the Sudbury basin, the heat production within the Onaping formation is slightly hi-gher than the heat production in the Onwatin and Chelmsford formations. This is probably due to the fact that many inclusions of granitic basement rocks are found within this forma-tion. This is well marked in the U-concentration map where the Onaping formation shows a
much greater concentration of uranium compared with the surrounding norite/granophyre
of the SIC and the sediments of the Onwatin and Chelmsford formations (Figure 1.9). This
effect is also observable on the thorium map (Figure 1.8). High beat production values are
locally found just south of the structure, in two main areas located east and west of SNO
-LAB. These anomalies are well correlated with the granites of the Creigton-Murray plutons.
A high heat production anomaly is found just north of the Grenville front, in the Southern
The mean Th/U ratio, detennined from cell averages (1587 cell values), is 6.8 ± 1.6 with a standard deviation of 2.57 (Figure 1.11). Wc have calculated Th/U ratio since U has the
most important impact in the heat generation. To do this, we have excluded all U values
lower than 0.1 ppm so the result will not be biased by very high Th/U local anomalies. Th/U ratio was then calculated by averaging airborne radiometrie data over 0.025° x 0.025° cells. The resulting map (Figure 1.10) show that Th/U ratio is on average constant within the structure and increases northwest and west of the structure. These high Th/U ratio
anomalies are well correlated with the high heat production areas corresponding to the
Cartier Batholith. Th/U ratio in the Batholith varies over a wide range; from 8 to more
than 20. In the western part of the Batholith Th/U ratio is decreasing. The high Th/U
anomaly in the Batholith seems to extend within the Levack complex. Higher Th/U ratio is also spotted in the CLIC.
Figure 1.12 shows the resulting K/Th ratio map. This map was made with the same
procedure used to make the Th/U map. We observe that K/Th ratio is consistent with Th/U ratio (lower values within the Batholith and Chief Lake complex). On the other hand, the
Creigton-Murray plutons show lower K/Th ratios, which do not appear on the Th/U map. The Onaping formation also seem to have slightly lower K/Th values. Mean K/Th ratio is
2871 with a standard deviation of 1099 based on 1586 values (Figure 1.13). The K/Th ratio in the Cartier Batholith is averaging 1000.
The ternary RGB image (Figure 1.14) confinns these observations. The Cartier Batholith is marked by a high level of thorium (bright green anomaly) relative to U and K. This is consistent with both, the Th/U and K/Th ratios observed in the Batholith. The western part of the Batholith contain many purple bluish spots which are consistent with the low Th/U ratio observed in this area. The CLIC and Creighton-Murray plutons are creamie st-white color representing a high level in three radioelements. Purple-bluish spots are found
all over the Huronian rocks as well as the Onaping formation corresponding to a slightly
23
1.5 Heat production measurements from core and surface samples
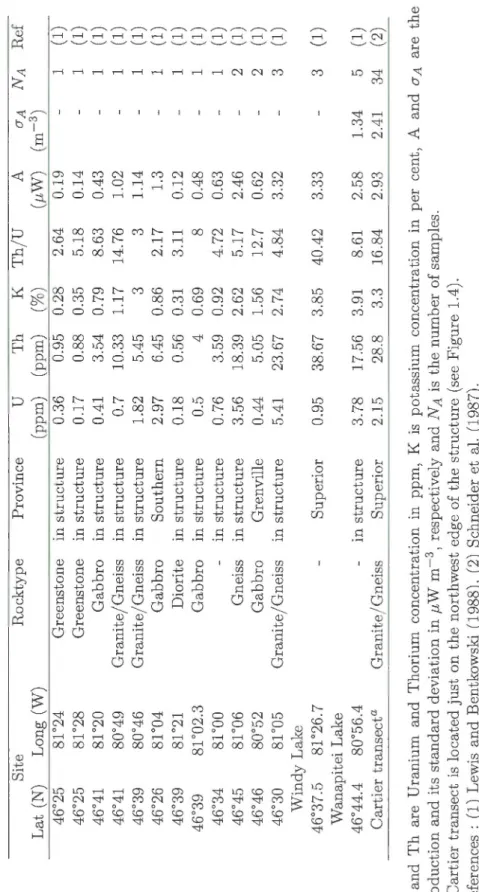
In the Sudbury region many heat production measurements are available. Some of these measurements were made on core samples collected at heat flow sites or close by (Jessop and Lewis, 1978; Pinet et al., 1991; Drury and Taylor, 1986; Perry et al., 2009), some were made on surface samples from various locations (Lewis and Bentkowski, 1988), and others were made on surface samples collected along a SE-NW 17 km transect located in the Superior Province northwest of the structure (Schneider et al., 1987). For a general overview of all heat production measurements from core samples and surface samples (including the transect) refer to Table 1.2 and 1.3, respectively. The location of these measurements is shown on the heat production map from airborne survey (Figure 1.5). The map does not include the East Bull Lake and Sturgeon Falls sites which are located outside our study area.
From these samples, the concentration of U, Th and K was determined through labora-tory analysis. The technique is described in Mareschal et al. (1989). Heat production was then calculated using the equation (1.3), which wc prcviously used to determined the heat production from airborne gamma-ray spectrometry data in the above section.
1.5.1 Heat production distributions
Using all the available heat production measurements (Table 1.2 and 1.3) we examine how the heat production is distributed by rock type and by geological provinces (Table
1.4 and 1.5). We found that greywackes, granites and gneisses have higher heat production
average than norites, gabbros, greenstones and anorthosites. These high heat production
rocks are common in the Sudbury area, which is consistent with the high heat flux observed
in the area. The Superior and Southern Provinces have high average heat production, which is consistent with their composition being granite and grcywacke rich. Also, the mean heat production is higher outside the structure (2.1 t-tW m-3) than inside (1.78 t-tW m-3). This is consistent with the high heat production around the Sudbury structure in the Superior
1.5.2 Beat production from core samples
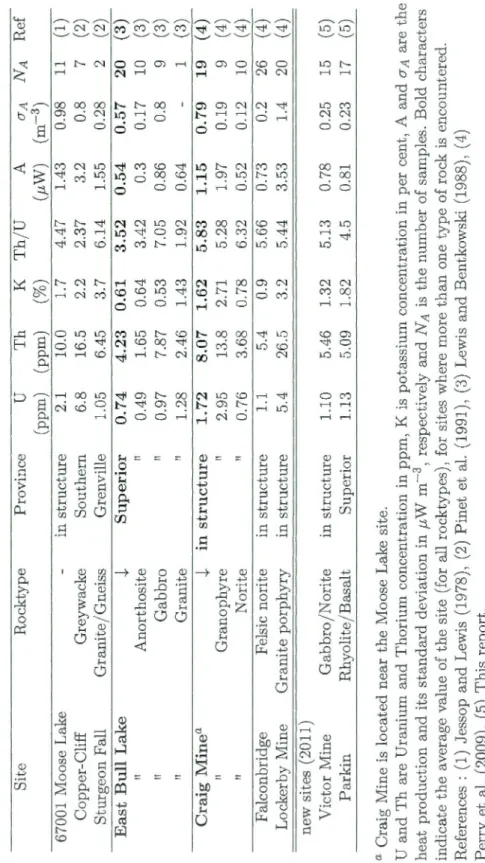
From all the heat flow sites measured by the Geological Survey of Canada (Sudbury 1, Elliot Lake, Moose Lake, Onaping, Windy Lake, Victoria, Murray and Lockerby 1), heat production was determined only at Moose Lake (Jessop and Lewis, 1978). This site is located
on the north range of the structure within the SIC. Average heat production of this site,
determined from 11 core samples, is 1.43 p,W m-3. The lithology of these samples is not given. Other heat production measurements, from the Copper-Cliff and Sturgeon Falls sites, were published in Pinet et al. (1991). As mentioned above, the Sturgeon Fall site is located 80
km east from Sudbury in the Grenville Province. Its average heat production (1.55 p,W m-3)
will not be included in the mean heat production calculation and the statistical analysis. Copper-Cliff is located in the Southern Province, between the structure and the Grenville
front. The average heat production at this site is 3.2 p,W m-3 . This value was determined
from 7 core samples, which are all greywackes.
The East Bull Lake site is also located far from Sudbury (50 km west) in the Superior
Province. Mean heat production determined at this site is 0.54 p,W m-3. This value was
determined from 20 core samples, mostly consisting of anorthosite and gabbro (Drury and
Taylor, 1986). As for the Sturgeon Falls, East Bull Lake average heat production will not
be included in the analysis.
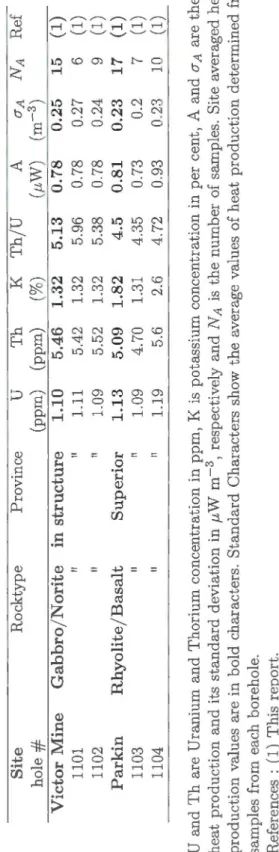
Recently heat production measurements were made at the Falconbridge, Lockerby Mine
and Craig Mine sites (Perry et al., 2009). Craig Mine is located near Moose Lake (in the SIC).
Its mean heat production value is 1.15 p,W m-3 and was determined from 19 granophyre
and norite core samples. Falconbridge is located just south of Wa.napitei Lake, on the east
rang of the structure within the SIC. Beat production at this site is 0.73 p,W m-3 and
was determined from 26 core samples, all norites. Finally, the Lockerby Mine site, which
is located on the southern perimeter of the structure, just west of the Creighton pluton, exhibit a mean heat production of 3.53 p,W m-3. This value was determined from 20 core samples, all granites.
25
1.5.3 Heat production from surface samples
Surface heat production measurements were macle by the Geological Sm·vey of Canada.
In majority, heat production at each site was cleterminecl from a single sample. Some va
-lues are an average of two or three samples. Most of the measurements are locatecl within
the structure. The heat production from these measurements varies from as low as 0.12
f..LW m-3 to as high as 3.32 f..LW m-3. Lithological data are available for all samples, but one. They are either greenstones, gabbros, granites or gneisses. These data were publishecl in Lewis and Bentkowski (1988).
There are two more surface heat production measurements publishecl by Lewis and
Bentkowski (1988), Wincly Lake and Wanapitei Lake. Wincly Lake is locatecl at the border of the structure with the Superior Province within the Levack complex. Mean heat production, cleterminecl from three samples, is 3.33 f..L W m -3. At Wanapitei Lake, which is locatecl on
the northeastern corner of the structure on the SIC and Onaping border, fi.ve samples were
collected and the average heat production is 2.58 f..L W m -3. Samples lithology from these
two sites is unknown. These measurements will be cliscussecl separately because their mean
heat production is very high.
Other surface measurements were macle along a SE-NW 17 km transect locatecl in the
Superior Province northwest of the structure. Sampling startecl at Wincly Lake and extended
to Cartier with samples collectecl at 0.5 km interval along highway 144. Along this transect,
34 granite/gneiss samples were collectecl and mean heat production obtained is 2.93 with
a standard deviation of 2.42 IL W m -3 (Schneider et al., 1987). Results show a systematic
heat production increase with distance from the structure. The first dozen samples, located
in the Levack Gneiss complex, have low heat production, usually lower than 1f..L W m -3. In
the middle of the transect, he at production varies grea tl y, from less than 1 IL W m -3 to
more than 7 IL W m -3. This seems to mark the transition between the Cartier Batholith and
the Levade Complex. The last dozen of measurements in the Batholith are usually higher
than 4 f..LW m-3 and exceed 8 f..LW m-3at the far end of the transect. This low to high heat
production transition is consistent with the Batholith being enriched in raclioements relative to the Levade complex (Meldrum et al., 1997).
1.5.4 Heat production analysis
The average heat production calculated from all these measurements, for a total of 141 values, is 2.08 ± 0.013 J..LW m-3 with a standard deviation of 1.84 J..LW m-3 (Figure
1.15). This value seems high and we need to analyze the different groups of measurement
separately. Although this high heat production average is consistent with the high heat flux
of the region.
Mean heat production from all surface samples, which include the transect, Wana
pi-tei Lake, and Windy Lake values, is 2.48 ± 0.04 J.LW m-3 with a standard deviation of
2.2 J..LW m-3 . This value was calculated from 58 samples (Figure 1.16a). Heat production measured on core samples yield an average of 1.79 ± 0.018 J.LW m-3 with a standard de
-viation of 1.49 J..LW m-3 for 83 samples (Figure 1.16b). The average heat production from
surface samples is much higher than that of core samples. The average heat production
calculated with samples from the transect, Wanapitei Lake, and Windy Lake is 2.91 ± 0.05
J.LW m-3 with a standard deviation of 2.26 J..LW m-3 for 42 samples (Figure 1.16a).
the mean heat production is higher outside the structure (2.1 J..LW m-3) than inside
(1.78 J..LW m-3)
Because the average heat production obtained from surface measurements from the transect, Wanapitei Lake and Windy Lake seems very high and perhaps biased, we have
calculated the mean heat production from surface samples without these values. We obtai
-ned an average heat production of 1.35 ± 0.01 J..LW m-3 with a standard deviation of 1.63
J.LW m-3 (Figure 1.16c). This result seems more representative and is doser to the average
determined from core samples (1.79 J..LW m-3). Thus, the more accurate heat production measurements are given from core samples and surface samples (without the transect, Wana
-pitei Lake and Windy Lake values). Mean heat production from 99 core and surface samples
is 1.81 ± 0.014 J..LW m-3 with standard deviation of 1.54 J..LW m-3 (Figure 1.15).
The same analysis was made for Th/U ratio values. Average Th/U ratio from all
mea-surements (141 values) is 9.16 ± 0.08 with a standard deviation of 11.24. Mean Th/U ratio
27
deviation of 17.38) and average was calculated from values varying over a wide range since the standard deviation is as high as the average. Average Th/U ratio excluding values from
the transect, Wanapitei Lake and Windy Lake sites is 5.57
±
0.03 with a standard deviationof 3.14 (Figure 1.17). Detailed histograms are shown in Figure 1.18.
1.6 Comparisons and conclusions
The average heat production in the Sudbury area estimated from airborne radiome -trie surveys dataset is 0.87 J.LW m-3. Mean heat production determined from the core and
surface samples, considered relia ble, is 1.81 J.L W m-3. This comparison demonstrates that
airborne surveys underestimates the radioelements content. Since surveys are known to be
only sensitive to the superficiallayer, some process must have affected the level of radioe
-lement contained in the upper layer. Weathering processes are likely to be responsible for heat production being underestimated within th superficiallayer in the Sudbury region.
The best way to illustrate the level of weathering is the K/Th ratio since K is a mobile
element easily leached while Th is immobile. In the K/Th ratio map (Figure 1.12), the
Cartier Batholith, Levack complex and the Creighton-Murray Plutons are the areas most affected by weathering. This is also observed in the ternary map whereas the Batholith is marked by a bright green color anomaly. On the other hand the Levack complex white -greenish-blueish color illustrate a high level in Th and U and the Creighton-Murray Plutons white-pinkest color a high level in 3 radioelements. These regions have shown some sign of weathering but no obvious U loss compared to the Cartier Batholith. This illustrates the higher mobility of K compared to U. We found from air borne survey data an average K/Th
of 2,871 which is consistent with the average crustal ratio of 2,500 McDonough and Sun
(1995). Within the Cartier Batholith, the K/Th ratio is low with an average of 1000 and
gets even lower north of the structure and in the western part of the Batholith.
The Th/U ratio map shows similiar trends but less pronounced in the western part
of the Cartier Batholith and in the Levack complex (Figure 1.10). In contrast no Th/U
anomalies are seen in the Creighton-Murray Plutons. These regions have been less affected
surveys dataset is 6.8 while Th/U ratio from core and surface samples measurements is 5.57.
lt seems that the uranium content within the superficiallayer has decreased more in the Cartier Batholith than in other units. This is consistent with the significantly lower heat production obtained from radiometrie surveys since uranium is the radioactive element that contributes most to the heat generated by the rocks. Th/U ratio in the Batholith gets very high, over 20, much higher that the average crustal ratio of 4 (McDonough and Sun, 1995; Jau part and Mareschal, 2003). This is coherent with geochemistry results illustrating that U loss has occurred in the Cartier Batholith, possibly through leaching, despite the already high estima tes of U. (Meldrum et al., 1 997).
On the ternary map we observe purple bluish color spots all over the Huronian rocks and the Onaping formation. The uranium rich conglomerates found in the Huronian Supergroups are attributed to uplift and unroofing of the Batholith. The eroded rocks were carried out by paleocurrents (Meldrum et al., 1997). These uranium rich conglomerates may be more abundant than indicated by the airborne survey maps because of their depth and their low to moderate dips (Easton, 2009). Within the Onaping formation, the slightly lower K/Th
ratio indicates that the formation has been affected by sorne weathering, but the reducing
nature of these sediments has prevented uranium from being leached. Overall U loss have affected mainly the Cartier Batholith.
Our study shows that the airborne radiometrie surveys are not likely to provide the reliable estimates needed to calculate the crustal geo-neutrino flux. Mean heat production calculated from surveys is very low, half the average measured on core and surface samples. In the Sudbury region, the ground has been affected by weathering. Under such conditions, U and K are easily leached and their concentration and distribution is lower than in fresh rocks.
Therefore, to determine the crustal geo-neutrino flux, the crustal radioactivity must be calculated from heat flow and heat production measurements on rock and core samples.
The Sudbury region is well known and documented since it has been explored for its mineral potential. Renee, all the available drill holes in the region offer the opportunity to
29
well calculate the crustal radioactivity from heat flux measurements. A very good knowledge
of the radioelement content in the crust will allow us to establish with high precision the crustal contribution to the geo-neutrino flux in the vicinity of SNOLAB. The majority of existing heat flux values are located in the impact structure and in the Southern Province;
very few have been obtained farther away. Our next goal is to provide measur ments in the
area where the heat flux has not been measured, outside the structure and mostly within
the Cartier Batholith.
Acknowledgements
This work was supported by NSERC discovery grants to Clair Perry and Jean-Claude
Mareschal. We are grateful to the Geological Survey of Canada for providing and maintaining the Geoscience data repository.