HAL Id: hal-00301636
https://hal.archives-ouvertes.fr/hal-00301636
Submitted on 23 Dec 2004HAL is a multi-disciplinary open access
archive for the deposit and dissemination of sci-entific research documents, whether they are pub-lished or not. The documents may come from teaching and research institutions in France or abroad, or from public or private research centers.
L’archive ouverte pluridisciplinaire HAL, est destinée au dépôt et à la diffusion de documents scientifiques de niveau recherche, publiés ou non, émanant des établissements d’enseignement et de recherche français ou étrangers, des laboratoires publics ou privés.
Nitric acid trihydrate (NAT) formation at low NAT
supersaturations
C. Voigt, H. Schlager, B. P. Luo, A. Dörnbrack, Anke Roiger, P. Stock, J.
Curtius, H. Vössing, S. Borrmann, S. Davies, et al.
To cite this version:
C. Voigt, H. Schlager, B. P. Luo, A. Dörnbrack, Anke Roiger, et al.. Nitric acid trihydrate (NAT) formation at low NAT supersaturations. Atmospheric Chemistry and Physics Discussions, European Geosciences Union, 2004, 4 (6), pp.8579-8607. �hal-00301636�
ACPD
4, 8579–8607, 2004
Nitric acid trihydrate (NAT) formation at low NAT supersaturations C. Voigt et al. Title Page Abstract Introduction Conclusions References Tables Figures J I J I Back Close Full Screen / Esc
Print Version Interactive Discussion
EGU
Atmos. Chem. Phys. Discuss., 4, 8579–8607, 2004 www.atmos-chem-phys.org/acpd/4/8579/
SRef-ID: 1680-7375/acpd/2004-4-8579 European Geosciences Union
Atmospheric Chemistry and Physics Discussions
Nitric acid trihydrate (NAT) formation at
low NAT supersaturations
C. Voigt1, H. Schlager1, B. P. Luo2, A. D ¨ornbrack1, A. Roiger1, P. Stock1,
J. Curtius3, H. V ¨ossing3, S. Borrmann3,4, S. Davies5, P. Konopka6, C. Schiller6, G. Shur7, and T. Peter2
1Institut f ¨ur Physik der Atmosph ¨are (IPA), DLR Oberpfaffenhofen, D-82234 Wessling, Germany 2
Institut f ¨ur Atmosph ¨are und Klima, ETH Z ¨urich, H ¨onggerberg HPP, CH-8093 Z ¨urich, Switzerland
3
Institut f ¨ur Physik der Atmosph ¨are, Universit ¨at Mainz, D-55099 Mainz, Germany
4
Max-Planck-Institut f ¨ur Chemie, D-55128 Mainz, Germany
5
School of Environment, University of Leeds LS9JT, UK
6
Forschungszentrum J ¨ulich, ICG-I, D-52425 J ¨ulich, Germany
7
Central aerological observatory, Moscow, reg. 141700, Russia
Received: 8 December 2004 – Accepted: 8 December 2004 – Published: 23 December 2004 Correspondence to: C. Voigt ([email protected])
© 2004 Author(s). This work is licensed under a Creative Commons License.
ACPD
4, 8579–8607, 2004
Nitric acid trihydrate (NAT) formation at low NAT supersaturations C. Voigt et al. Title Page Abstract Introduction Conclusions References Tables Figures J I J I Back Close Full Screen / Esc
Print Version Interactive Discussion
EGU
Abstract
A polar stratospheric cloud (PSC) was observed on 6 February 2003 in the Arctic stratosphere by in-situ measurements onboard the high-altitude research aircraft Geo-physica. Low number densities (∼10−4cm−3) of nitric acid (HNO3) containing parti-cles – probably NAT – with diameters up to 6 µm were measured at altitudes between
5
18 and 20 km. These particles have the potential to grow further and to remove HNO3 from the stratosphere, thereby enhancing polar ozone loss. Interestingly, the NAT par-ticles formed in less than a day at temperatures T >TNAT−3.5 K, just slightly below the NAT equilibrium temperature TNAT. This unique measurement of PSC formation at extremely low NAT saturation ratios (SNAT .11) constrains current NAT nucleation
the-10
ories. In particular, NAT formation on ice can for certain be excluded. Conversely, we suggest that meteoritic particles may be favorable candidates for triggering nucleation of NAT at the observed low number densities.
1. Introduction
PSCs form in the winter polar stratosphere at low temperatures by uptake of water
15
and nitric acid into stratospheric sulfate aerosol (Carslaw et al., 1994; Schreiner et al., 1999; Voigt et al., 2000b). At temperatures below the frost point TICE (∼190 K), ice can nucleate in the supercooled ternary solution (STS) droplets (Koop et al., 2000), and the cloud may become visible as colourful iridescent ice PSC. PSCs consisting of NAT particles (Voigt et al., 2000a) have been detected in a broad size and number density
20
range. High number densities (n>10−2cm−3) of small NAT particles (d ≤6 µm) have been measured on small horizontal scales of some hundred square kilometers in cold regions induced by mountain waves (Carslaw et al., 1998; Wirth et al., 1999; Toon et al., 2000; Voigt et al., 2003). These dense PSCs provide sites for heterogeneous re-actions that activate halogen species (Peter, 1997) leading to polar ozone destruction.
25
parti-ACPD
4, 8579–8607, 2004
Nitric acid trihydrate (NAT) formation at low NAT supersaturations C. Voigt et al. Title Page Abstract Introduction Conclusions References Tables Figures J I J I Back Close Full Screen / Esc
Print Version Interactive Discussion
EGU
cles (10 µm<d <20 µm) have been detected in synoptic-scale PSC fields (Fahey et al., 2001; Northway et al., 2002). Those large NAT particles can sediment and transport HNO3 to lower altitudes (Fahey et al., 1990; Waibel et al., 1999). Under denitrified conditions, the passivation of active halogen species may be slowed down, thereby enhancing ozone loss.
5
Here we present measurements and simulations of small (d <6 µm) nitric acid con-taining particles at low particle number density (n∼1.6×10⁻⁴cm−3). If these particles grow to larger sizes, they could provoke denitrification and enhanced polar ozone de-pletion. In contrast to previous measurements, conditions of particle formation can be precisely confined: the air parcels have spent less than a day at temperatures 0 to
10
3.5 K below TNAT. This corresponds to NAT saturation ratios SNAT.11, where SNAT is the ratio between the HNO3partial pressure and the HNO3vapor pressure of NAT. An exposure to temperatures below TICE can be excluded. How have these NAT particles formed? Besides current NAT nucleation theories, we investigate the effect of NAT nucleation on meteoritic particles.
15
2. Arctic winter 2002/2003
The Arctic stratosphere was extremely cold in early winter 2002/2003 with tempera-tures persistently below TNAT between end of November and mid-January 2003. Dur-ing this period, PSC formation over large areas influenced the chemical evolution of the polar vortex and led to denitrification of up to 50% (Schlager et al., in preparation,
20
20041; Grooß et al., 2004). Processing of halogen species on PSC particles as well as denitrification finally resulted in ozone depletion of 20 to 25% of the total ozone column by late March (Grooß et al., 2004). A major warming associated with a split of the vortex in mid-January stopped the cold phase. Vortex temperatures at the 50 hPa level
1
Schlager, H., Voigt, C., Volk, M., Davies, S., Carslaw, K., Konopka, P., Roiger, A., and Stock, P.: Observations of denitrification and renitrification in the 2002–2003 Arctic winter stratosphere, Atmos. Chem. Phys. Discuss., in preparation, 2004.
ACPD
4, 8579–8607, 2004
Nitric acid trihydrate (NAT) formation at low NAT supersaturations C. Voigt et al. Title Page Abstract Introduction Conclusions References Tables Figures J I J I Back Close Full Screen / Esc
Print Version Interactive Discussion
EGU
were significantly above TNAT for at least two weeks and NAT particles are not expected to survive this warm period. In early February the vortex gained strength and cooled again. The measurements discussed below were taken under these meteorological conditions on 6 February 2003, before the final warming of the vortex in April.
The Vintersol/Euplex project has the aim to characterize ozone loss and PSCs in the
5
Arctic winter 2002/2003. Within this project, a campaign with the high-altitude research aircraft M55 Geophysica and the Falcon took place from 15 January to 11 Febru-ary 2003 in Kiruna/Sweden. In this period, the Geophysica performed 10 mission flights to altitudes of 20 km.
3. Instrumentation
10
The Geophysica carried an NOychemiluminescence instrument, a Forward Scattering Spectrometer Probe (FSSP-300), a Microjoule-Lidar and a backscatter sonde for parti-cle detection, besides instruments for trace gas and temperature measurements. Here we concentrate on in-situ measurements of PSCs using the NOy instrument SIOUX (Schlager et al., in preparation, 20041) and the FSSP (Borrmann et al., 2000).
15
3.1. NOyinstrument
The NOy instrument (Schmitt, 2003) is mounted in a pod under the right wing of Geo-physica. Here, NOyis the sum of reactive nitrogen species, of which HNO3, NO, NO2, N2O5 and ClONO2 are most important in the stratosphere. The inlet of the NOy in-strument is especially designed for PSC particle measurements. Particulate and gas
20
phase NOy (total NOy=NOy,tot) are measured by a forward facing inlet. Calculations following Kr ¨amer and Afchine (2004) show that the measured particle number density is enhanced by a size-dependent factor E (d ), which reaches 21 for large particles at 70 hPa. In the rear facing inlet, particles larger than cut-off size d50=0.2 µm are inertially stripped off the sampled air, so that predominantly the gas phase NOy is measured
ACPD
4, 8579–8607, 2004
Nitric acid trihydrate (NAT) formation at low NAT supersaturations C. Voigt et al. Title Page Abstract Introduction Conclusions References Tables Figures J I J I Back Close Full Screen / Esc
Print Version Interactive Discussion
EGU
(=NOy,gas). The heated inlet (35◦C) and a subsequent gold converter (300◦C) ensure complete evaporation of particulate NOy and catalytic conversion to NO. Finally the infrared radiation of the reaction NO+O3 is measured with a chemiluminescence de-tector. Nitric acid contained in particles is derived by subtracting NOy,gas from NOy,tot and correcting for the particle enhancement (E ). The flow through each inlet is
con-5
trolled at 1 Nlpm (Normal liter per minute). Thus, at a sampling rate of 1 Hz of the instrument, particle number densities ≤10−4cm−3can be resolved as individual spikes in the total NOy data. The sensitivity of the instrument is 12 000 counts/ppb NOy. The accuracy of the NOy data is ±18% for NOy,tot and ±12% for NOy,gas. The detection limit for particulate NOy is conservatively estimated as 0.3 ppbv (from the difference
10
between the two channels in periods without particle observation when T >TNAT+5 K). 3.2. Optical particle instruments
The forward scattering spectrometer probe (FSSP, Borrmann et al., 2000) measures the radiation scattered by particles which isokinetically fly through the the beam of a HeNe laser in the size range between 0.4 and 23 µm in diameter, divided in 30
chan-15
nels. Due to ambiguities in the Mie scattering coefficient, the particle number density in the channels between 0.7 and 1.9 µm cannot be resolved. The effective sampling vol-ume of ∼10 L min−1resulting from the laser geometry restricts the detection to particles with number densities n&10−4cm−3(with 1 min integration time).
Additionally, two lidars (Adriani et al., 1992; Mitev et al., 2002) onboard the
Geo-20
physica were operated to measure the backscatter and depolarisation of particles. The detection limits of the instruments are 3 to 4% in the volume depolarization at 532 nm. 3.3. Rosemount sensor
The temperature has been measured with an accuracy of +0.8/−0.6 K with a Rose-mount sensor. Comparisons (M. J. Mahoney, personal communication, 2003) with
25
data from a Microwave Temperature Profiler (MTP) and a PT100 sensor onboard the 8583
ACPD
4, 8579–8607, 2004
Nitric acid trihydrate (NAT) formation at low NAT supersaturations C. Voigt et al. Title Page Abstract Introduction Conclusions References Tables Figures J I J I Back Close Full Screen / Esc
Print Version Interactive Discussion
EGU
Geophysica show that MTP data are on average+0.8 K warmer and the PT100 data are on average −0.1 K colder than Rosemount data.
4. Detection and identification of a NAT PSC
During a flight from Kiruna over the Atlantic on 6 February 2003, HNO3containing parti-cles were observed in the stratosphere by the NOyinstrument. Particles were detected
5
during the outbound and the inbound flight leg at similar geographical locations but dif-ferent altitudes, indicated by red thick lines on the flight track (yellow line) in Fig. 1. On the outbound flight leg, individual spikes in the total NOy time series (Fig. 2) indicate the presence of particles near 14.65 h universal time (UT) inside the polar vortex at an altitude of 18.3 km (420 K potential temperature). On the inbound flight, particles were
10
detected as enhanced fluctuations in the total NOy data near 16.35 h UT at an altitude of 19.5 km (440 K potential temperature). The particles were observed at temperatures between 194.5 and 196 K, corresponding to 0.5 to 3.5 K below TNAT. Here TNAT has been calculated following Hanson and Mauersberger (1988) using the gas phase NOy and the water vapour measurements (Schiller et al., 2002) onboard the Geophysica.
15
Under these stratospheric conditions, NAT is the only nitrogen-containing condensed phase known to be stable. The metastable nitric acid dihydrate (NAD) (Worsnop et al., 1993) can only form at T ≤TNAT−2.3 K. Significant uptake of nitric acid in STS droplets starts 3.5 K below TNAT and the resulting particle number densities of 10 cm−3 could not produce isolated peaks in the NOy data. Therefore we assume that the measured
20
particles consist of NAT.
4.1. NAT particle number density and size distribution
We derive particle sizes for the individual peaks in the total NOydata ascribing them to NAT. Modifying an equation from Northway et al. (2002), the particle diameter is:
D[µm]=4.67 × (∆NOy[ppbv]/0.9)0.33 (1)
ACPD
4, 8579–8607, 2004
Nitric acid trihydrate (NAT) formation at low NAT supersaturations C. Voigt et al. Title Page Abstract Introduction Conclusions References Tables Figures J I J I Back Close Full Screen / Esc
Print Version Interactive Discussion
EGU
This assumes 90% of the signal of a NAT particle to be captured during the measure-ment interval of 1 s, as suggested by the instrumeasure-ment response function. Spikes in the ∆ NOybetween 0.6 and 1.3 ppbv (see Fig. 2c) correspond to NAT particles with
diam-eters d=4.1−5.4 µm. These particles have a number density n∼6×10⁻⁶cm−3, derived using the sampling flow and the particle enhancement factor E (d ).
5
In addition, enhanced fluctuations in the ∆NOy signal (Fig. 2c and d) indicate the presence of smaller particles with higher number densities (n≥10−4cm−3), but these cannot be resolved individually. Therefore, we derive the particle number density and size distribution using forward Monte Carlo simulations of the occurrence histogram of the ∆NOy data. For the simulations, we make an initial guess of the particle size
10
distribution, which consists of a mode of NAT particles and a second mode of smaller STS particles, which have slightly grown due to HNO3 uptake. We account for over-sampling E (d ) and assume that the particles evaporate instantly. Further we consider the response time of the instrument, determined by the pumping speed and the vol-umes of the conversion chamber and the detection chamber. In addition, the
instru-15
ment noise has been determined from the data between 14.8 and 15.5 h (UT). We add the simulated∆NOysignals stochastically and compare the simulated occurrence his-togram with the hishis-togram measured in the cloud between 14.55 and 14.75 h (UT). If the agreement is not sufficient, we redefine the size distribution and repeat the steps detailed above.
20
Good agreement between the measured occurrence histogram of the ∆NOy data and the simulations (Fig. 3a) is achieved for NAT particles with diameters between 2 and 5.4 µm at number densities of 1.6×10⁻⁴cm−3(thick black line in Fig. 3b). NAT par-ticles with diameters <2 µm cannot be resolved from the data as their signal is masked in slightly enhanced ternary background aerosol containing ∼0.03 ppbv HNO3(curved
25
thick black line in Fig. 3b). Sensitivity studies indicate that both doubling or halving the NAT particle number density (thin black solid and dashed lines in Fig. 3a) leads to significant deteriorations of the fit. A similar analysis (not shown here) has been performed for the NAT particles detected on the return flight leg at 19.5 km altitude just
ACPD
4, 8579–8607, 2004
Nitric acid trihydrate (NAT) formation at low NAT supersaturations C. Voigt et al. Title Page Abstract Introduction Conclusions References Tables Figures J I J I Back Close Full Screen / Esc
Print Version Interactive Discussion
EGU
above the region of particle detection at 18.3 km (Fig. 2d). Those∆NOy data can be simulated using NAT particles with diameters between 1 and 3.5 µm at a number den-sity of 3×10⁻⁴cm−3 superimposed to ternary solution aerosols containing ∼0.04 ppbv nitric acid. The error in the NAT particle number density derived from the simulations is ± a factor of 2.
5
We now compare the particle size distribution derived from the simulations to the measurements of the optical instruments. The depolarisation produced by 10−4cm−3 NAT particles with diameters smaller than 5 µm is less than 1.5% in the volume depo-larisation, therefore it lies below the detection limit of 3 to 4% of the two lidars. Con-versely, the FSSP detected 3 particles with diameters d=1.9–4.6 µm near 14.65 h UT
10
at 18.3 km altitude besides a small background aerosol mode (thin black line with error bars in Fig. 3b). Thus, we use the FSSP data as additional support for the particle size distribution derived from the NOy instrument, but the low sampling statistics does not allow for a more precise data comparison. In summary, there is an agreement between the particle size distributions derived from the optical particle instruments and the NOy
15
instrument.
4.2. Extension and vertical structure of the NAT cloud
On 6 February 2003, a NAT PSC is measured inside the polar vortex above the At-lantic ocean near the Norwegian coast (red lines in Fig. 1). At an altitude of 18.3 km (420 K), a low number density cloud (n∼1.6×10⁻⁴cm−3) of NAT particles with d <6 µm
20
are detected over a distance of 140 km. Above these particles, almost twice the num-ber density of smaller NAT particles (d <3.5 µm) are measured at 19.5 km (440 K) over a distance of 250 km, probably in the same cloud. The upward and downward look-ing micro-lidar (Mitev et al., 2002) onboard the Geophysica measures no significant increase of depolarisation and backscatter ratios at 532 nm above the background
25
aerosol level in the region 5 km above and below the flight track in the stratosphere. Thus, the NAT particles were measured in an optically thin NAT cloud.
ACPD
4, 8579–8607, 2004
Nitric acid trihydrate (NAT) formation at low NAT supersaturations C. Voigt et al. Title Page Abstract Introduction Conclusions References Tables Figures J I J I Back Close Full Screen / Esc
Print Version Interactive Discussion
EGU
4.3. Simulations of the NAT PSC
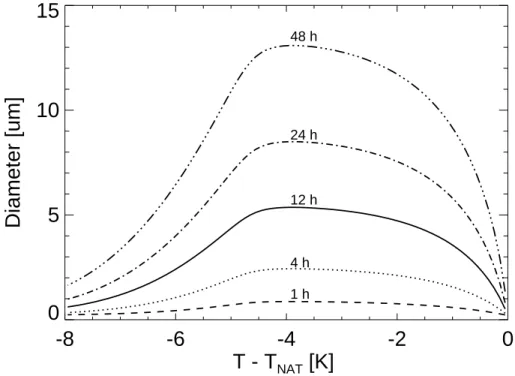
We calculated how large a NAT particle can grow at different temperatures assuming 5 ppmv water and 10 ppbv nitric acid in the gas phase and taking into account the uptake of nitric acid into STS aerosol (Fig. 4). A NAT particle grows to a diameter of 6 µm, if temperatures remain 2 K below TNAT for 16 h. When temperatures reach
5
the ice frost point, the NAT particle growth is reduced due to nitric acid gas phase depletion by HNO3 uptake into ternary solution particles. The slower growth of the particles to the same size at these extremely low temperatures reflects the fact that it takes time to release the HNO3 from the metastable STS droplets, to establish its diffusive transport through the gas phase and finally its uptake by the NAT particle in a
10
Bergeron-Findeisen-like process.
Further we performed a vortex wide simulation of NAT particles using the DLAPSE model, which couples a Lagrangian NAT particle growth and sedimentation scheme to the three-dimensional (3-D) chemistry transport model SLIMCAT (Carslaw et al., 2002). To adequately reproduce denitrification measured in the Arctic winter 2002/2003
15
(Schlager et al., in preparation, 20041) we increase the NAT nucleation rate by a factor of 4 (Davies et al., 2004) compared to the run for the 1999/2000 winter (Mann et al., 2003). We further increase the number of explicitly calculated model particles by a factor of 10 and in turn reduce the model scaling factor by a factor of 10 to improve the statistics for low particle number densities. The existence of 1.5×10⁻⁴cm−3 NAT
20
particles with d=1–7 µm is calculated with the DLAPSE model near the flight track on 6 February 2003 in good agreement with the observations. Figure 3b (dashed line) shows the modeled NAT particle size distribution in a region of 66–69◦ latitude north and 12–16◦ longitude east at 410 to 430 K potential temperature. At higher altitudes between 430 and 450 K, the existence of smaller NAT particles with a higher number
25
density is simulated with the DLAPSE model in qualtiative agreement with the obser-vations.
We note that the DLAPSE model simulates NAT particles in a slightly larger area than
ACPD
4, 8579–8607, 2004
Nitric acid trihydrate (NAT) formation at low NAT supersaturations C. Voigt et al. Title Page Abstract Introduction Conclusions References Tables Figures J I J I Back Close Full Screen / Esc
Print Version Interactive Discussion
EGU
observed (red line in Fig. 1) and also the shape of the size distributions differs from the observations. This may result from the simulation of NAT formation at a constant rate at temperatures below TNAT. In the real atmosphere, the particle nucleation process depends on temperature, NAT supersaturation and variations of the air masses. As-suming an increase in the NAT nucleation rate with NAT supersaturation could explain
5
those discrepancies in the shape of the size distribution and the region of particle ob-servation.
4.4. Comparison with other PSC measurements
Between 15 January and 11 February 2003, in total 10 flights have been performed with the Geophysica during the Euplex campaign. The excellent performance of the
10
particle channel of the NOy instrument was demonstrated by several cirrus cloud en-counters. Thin liquid ternary solution PSCs containing up to 0.5 ppbv nitric acid have been detected in mountain waves in two flights (Lowe et al., in preparation, 20042). Temperatures below TNAT were encountered on 4 flights. In all those cases, the tra-jectory temperatures were below TNAT for less than 8 h except for 6 February. In 8 h,
15
a NAT particle can grow to a size of 3.3 µm in diameter and contains ∼0.3 ppbv NOy, which is near the PSC particle detection limit of the NOy instrument. Except for cir-rus clouds, nitric acid containing particles with diameters larger than 3.3 µm have only been detected on 6 February 2003.
We now compare the PSC measured on 6 February 2003 with other PSC
observa-20
tions. In winter 1999/2000, NOy containing particles with larger diameters between 10 and 20 µm and n∼10−4cm−3 have been detected (Fahey et al., 2001; Northway et al., 2002). These particles could also be inferred from extinction data of satellite measure-ments (Poole et al., 2003). In addition, NAT particles with median diameters around
2
Lowe, D., MacKenzie, A. R., Schlager, H., et al.: Liquid particle composition and hetero-geneous reactions in a liquid polar stratospheric cloud, Atmos. Chem. Phys. Discuss., in preparation, 2004.
ACPD
4, 8579–8607, 2004
Nitric acid trihydrate (NAT) formation at low NAT supersaturations C. Voigt et al. Title Page Abstract Introduction Conclusions References Tables Figures J I J I Back Close Full Screen / Esc
Print Version Interactive Discussion
EGU
3 µm and number densities of a few times 10−3cm−3 have been detected during sev-eral balloon flights in Arctic mountain waves (Deshler et al., 2003; Schreiner et al., 2003) or during synoptic cooling (Larsen et al., 2004). Fahey et al. (2001) also mention a second smaller particle mode with diameters between 3 and 4 µm and n∼10−3cm−3 without giving more details. Measurements of low number densities (n∼10−4cm−3) of
5
small NAT particles (d <6 µm) as observed in the present case have not been reported so far.
5. Trajectory analysis
The particle measurements on 6 February 2003 took place in a short period with tem-peratures for a few days slightly below TNAT in the lower Arctic stratosphere. Therefore
10
we performed an accurate trajectory analysis to gain new insights in PSC formation at threshold PSC formation conditions.
We calculated trajectories based on ECMWF analysis ending in a wider region around the flight track indicated by the white square in Fig. 1. The backtrajectories were started on a grid in steps of 0.5◦in latitude and longitude and at altitudes of 70 hPa
15
(pressure altitude on the outbound flight leg), 55 hPa (pressure altitude on the return flight leg) and 50 hPa. The difference between the trajectory temperatures at 70 hPa and TNAT, calculated based on the measured NOyand water profile, is shown in Fig. 5. Those trajectories ending in regions with NAT particles observations are marked by red lines in Fig. 5. In the time period of one day, the descent rate of particles with
20
diameters <5 µm due to gravitational settling is slow (≤200 m/day) and comparable to the descent rate air by diabatic cooling (∼100 m/day). Therefore, we consider the calculated air parcel temperature as an approximated temperature history of the NAT particles.
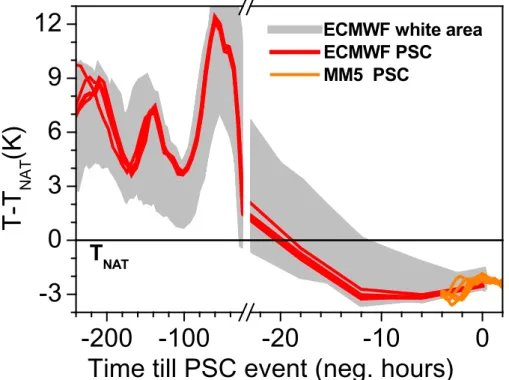
The trajectory temperatures were above TNAT for at least 9 days before they decrease
25
below TNAT approximately 20 h before the particle detection. The absolute temperature minimum reached by any of the trajectories is T ∼TNAT−3.5 K or T ∼Ti ce+4 K. This
ACPD
4, 8579–8607, 2004
Nitric acid trihydrate (NAT) formation at low NAT supersaturations C. Voigt et al. Title Page Abstract Introduction Conclusions References Tables Figures J I J I Back Close Full Screen / Esc
Print Version Interactive Discussion
EGU
clusion holds even when allowing for mesoscale temperature fluctuations related to gravity waves above the Scandinavian Alps (orange lines in Fig. 4), which we calcu-lated using the MM-5 mesoscale model (D ¨ornbrack et al., 1999). For the return flight leg at 55 hPa and also at the 50 hPa level, the trajectory temperatures (not shown here) were even higher. They were less than 19 h below TNAT reaching minimum values of
5
TNAT−2.4 K. This meteorological situation with low atmospheric temperature variability allows us to constrain temperatures for particle formation to T >TNAT−3.5 K correspond-ing to NAT saturation ratios SNAT.11.
6. NAT formation
Given that the trajectory temperatures remain 20 h below TNAT, we can derive an
10
average NAT nucleation rate of JNAT=8×10⁻⁶cm−3 air h−1 at temperatures be-low TNAT to explain the measured particle number density of 1.6×10⁻⁴cm−3. A slightly lower NAT nucleation rate has been determined for the winter 1999/2000 (3×10⁻⁶cm−3 air h−1) (Fahey et al., 2001; Carslaw et al., 2002). Different studies exist for the winter 2002/2003. A higher NAT nucleation rate (2.5×10⁻⁵cm−3 air h−1)
15
has been derived from balloon-borne measurements of NAT particle number densi-ties at lower temperatures (Larsen et al., 2004) in December 2002. The denitrifica-tion in the Arctic winter 2002/2003 can well be modeled using a nucleadenitrifica-tion rate of JNAT=1.15×10⁻⁵cm−3 air h−1 (Davies et al., 2004; Schlager et al., in preparation, 20041). Grooß et al. (2004) investigate the effect of different nucleation rates on the
20
denitrification.
NAT nucleation is a subject of current scientific debate (Tolbert and Toon, 2001). Here we use the NAT cloud observation in this unique situation at threshold NAT for-mation conditions (SNAT.11) to discuss different theories of NAT particle formation.
ACPD
4, 8579–8607, 2004
Nitric acid trihydrate (NAT) formation at low NAT supersaturations C. Voigt et al. Title Page Abstract Introduction Conclusions References Tables Figures J I J I Back Close Full Screen / Esc
Print Version Interactive Discussion
EGU
6.1. Homogeneous NAT nucleation
Homogeneous nucleation rates of NAT/NAD in ternary solutions have been determined from laboratory experiments (Koop et al., 1995, 1997; Salcedo et al., 2001; Knopf et al., 2002). Other laboratory studies with binary solutions show that the metastable NAD may form as the precursor of NAT, later performing a transition to NAT (Worsnop
5
et al., 1993). The results of our trajectors analysis (T >TNAT−3.5 K) strongly suggest, that those particle are neither composed of NAD nor have nucleated on NAD. Another analysis of laboratory experiments suggests that the nucleation of solids occurs on the surface rather than in the volume of liquid particles (Tabazadeh et al., 2002). At temperatures above TNAT−3.5 K or NAT saturation ratios SNAT.11, the nucleation rates
10
given in each of those laboratory studies cited above are by 1 to 8 orders of magnitude too low to explain the present observations.
6.2. NAT sedimentation from higher altitudes
The air parcels have been exposed to temperatures at least 7 K above TNAT during the 9 days before decreasing below TNAT approximately one day before the measurements
15
(Fig. 5). Above the observational levels at 50 hPa the trajectory temperatures take a similar course, first too warm for NAT and cooling only on the day of the observation. A 16 µm NAT particle evaporates within 8 h at 3 K above TNAT. Therefore previously formed NAT particles would not survive such a warm period and the air must be NAT free on 5 February 2003. Thus the measured NAT particles have formed in less than
20
a day. In one day, a NAT particle can grow to a maximum diameter of 8 µm and sedi-ment less than 500 m, therefore sedisedi-mentation of NAT particles from higher altitudes is negligible.
Additionally, the dynamical activity in the stratosphere due to mesoscale wave activity is low on 6 February with maximum temperature deviations of the mesoscale
trajec-25
tories of ±0.7 K from ECMWF trajectories (Fig. 4). Further, the minimum trajectory temperatures of TNAT−3.5 K are reached above the Atlantic ocean, where the effect
ACPD
4, 8579–8607, 2004
Nitric acid trihydrate (NAT) formation at low NAT supersaturations C. Voigt et al. Title Page Abstract Introduction Conclusions References Tables Figures J I J I Back Close Full Screen / Esc
Print Version Interactive Discussion
EGU
of mesoscale wave activity is small. In addition, the upward looking lidar onboard the Geophysica did not detect a mountain wave PSC. Summarized NAT sedimentation out of mountain wave clouds (Carslaw et al., 1999; Dhaniyala et al., 2002; F ¨uglistaler et al., 2002) can be ruled out.
6.3. Heterogeneous NAT nucleation on ice
5
Lidar and in situ measurements in mountain wave PSCs (Carslaw et al., 1998; Wirth et al., 1999; Voigt et al., 2000a) as well as model simulations (Luo et al., 2003) show that NAT can nucleate on ice. However, on 6 February 2003 NAT nucleation on ice can be excluded, because the synoptic ECMWF trajectories and even the mesoscale MM5 trajectories were by more than 4 K above the TICE, thus significantly too high
10
for ice formation. The present measurements convincingly demand a NAT formation mechanism above the ice frost point, which has also been claimed in recent model studies (Carslaw et al., 2002; Drdla et al., 2003) or PSC observations (Larsen et al., 2004). Conversely to the present case, the PSC trajectories in the study of Larsen et al. (2004) almost reach the ice frost point or NAT saturation ratios SNAT∼30.
15
6.4. NAT nucleation on meteoritic particles
Obviously potent nuclei must be available with sufficiently low surface areas, on which NAT can nucleate either by heterogeneous immersion nucleation (when the nuclei are immersed in the preexisting STS droplets) or by heterogeneous deposition nucleation (directly via nucleation of NAT from the gas phase). One potentially important,
ubiqui-20
tous kind of nuclei are meteoritic smoke particles. Most (60 %) of the meteoritic mass influx in the atmosphere of 16×106kg per year (best estimate, 8–30×106kg yr−1) ab-lates at altitudes above 75 km due to frictional heating in the atmosphere (Cziczo et al., 2001). Model studies indicate that the ablation products recondense and coagu-late in the mesosphere forming nanometer-sized smoke particles (Hunten et al., 1980).
25
ACPD
4, 8579–8607, 2004
Nitric acid trihydrate (NAT) formation at low NAT supersaturations C. Voigt et al. Title Page Abstract Introduction Conclusions References Tables Figures J I J I Back Close Full Screen / Esc
Print Version Interactive Discussion
EGU
are likely to enter the stratosphere over the winter pole. The meteoritic particles tra-verse the stratosphere in more than a year, during which they may become well-mixed, homogenized and partly incorporated into the stratospheric sulfate aerosol (Cziczo et al., 2001). Mass spectrometric measurements detected meteoritic inclusions in half of the stratospheric particles (Murphy et al, 1998; Cziczo et al., 2001). Curtius et al. (in
5
preparation, 2004)3 report in a detailed study that the fraction of stratospheric parti-cles containing detectable amounts of involatile material (probably of meteoritic origin) increases markedly inside the polar vortex to ∼70%.
We estimate the meteoritic surface area by assuming that 50% of the strato-spheric sulfate aerosol with a typical lognormal size distribution (dm=0.15 µm, σ=1.65,
10
n=10 cm−3) (Fig. 3) (Deshler et al., 2003) and a density of 1.72 g cm−3 (72 wt% sul-furic acid/water solution) contains 0.75 wt% meteoritic iron (Cziczo et al., 2001). Fur-ther we assume that meteoritic material with a density of 3 g cm−3 contains 20 wt% meteoritic iron (Cziczo et al., 2001). Then we derive a meteoritic surface area den-sity Ami n=0.05 µm2cm−3 using the Hatch-Chaote-Equation (Hinds, 1999) for 2.4 vol%
15
meteoritic inclusions (with a mean diameter dm=0.044 µm) in 50% of the strato-spheric sulfate particles. Model simulations of continuously coagulating strato-spherical me-teoritic smoke particles derive a meme-teoritic surface area density of similar magnitude (A∼0.1 µm2 cm−3, Hunten et al., 1980). The meteoritic surface area may be under-estimated by up to two orders of magnitude, because the meteoritic smoke particles
20
are expected to form loosely packed agglomerations and not spheres, i.e. A=0.05– 5.0 µm2 cm−3(Cziczo et al., 2001; Hunten et al., 1980). Additionally, variations in the extraterrestrial meteoritic flux or seasonal/interannual changes in the stratospheric cir-culation, including the formation of the polar vortex, can lead to inhomogeneities and variations of the meteoritic surface area.
25
Heterogeneous nucleation of ternary solutions on micro-meteorites has been inves-3
Curtius, J., Weigel, R., V ¨ossing, H.-J., et al.: In-situ particle measurements in the winter Arctic lower stratosphere: Implications for particle nucleation and volatility, Atmos. Chem. Phys. Discuss., in preparation, 2004.
ACPD
4, 8579–8607, 2004
Nitric acid trihydrate (NAT) formation at low NAT supersaturations C. Voigt et al. Title Page Abstract Introduction Conclusions References Tables Figures J I J I Back Close Full Screen / Esc
Print Version Interactive Discussion
EGU
tigated calorimetrically. Biermann et al. (1996) found that the presence of meteoritic material accelerates the freezing of supercooled ternary solutions. They determined an upper limit of the heterogeneous NAT nucleation rate per surface area of mete-oritic material of jmax=1.4×10⁻⁴µm−2 h−1 at SNAT∼20 (their measurements referring to “solution 2”).
5
By combining the laboratory data and in situ measurements of meteoritic particles, we obtain a very rough estimate for the NAT nucleation rate on meteoritic particles of JNAT=jmax×Ami n=7×10⁻⁶cm−3h−1in the stratosphere. Although this neatly coincides with the experimentally observed value JNAT=8×10⁻⁶cm−3air h−1, we note that an es-timate based on a product of an upper and a lower limit (for the rate and for the surface
10
area, respectively) needs to be treated with caution. Since the heterogeneous nucle-ation of NAT has not been investigated at NAT saturnucle-ation ratios as low as observed on 6 February, SNAT<11, there is an additional gulf of uncertainty in this result. Conversely, the investigation of Biermann and coworkers refers only to immersion nucleation, while deposition nucleation remains another possible and yet untested pathway for NAT
nu-15
cleation.
Given the present knowledge, NAT nucleation on ubiquitous meteoritic particles must be regarded as a possible pathway for the formation of solid polar stratospheric cloud particles at low number densities. Assuming temperatures below TNAT for 3 days (in-stead of 1 day as during EUPLEX), the estimated rate can produce NAT particle
num-20
ber densities up to few times 10−4cm−3, thus might explain the observations by Fahey et al. (2001).
In summary, contrasting to the conclusions of Biermann et al. (1996), who aimed at excluding meteoritic material as responsible for dense (n>10−2cm−3) NAT clouds, the discovery of large singular NAT particles (“NAT rocks”, n∼10−4cm−3) makes meteoritic
25
ACPD
4, 8579–8607, 2004
Nitric acid trihydrate (NAT) formation at low NAT supersaturations C. Voigt et al. Title Page Abstract Introduction Conclusions References Tables Figures J I J I Back Close Full Screen / Esc
Print Version Interactive Discussion
EGU
6.5. Effective NAT nucleation rate
In classical nucleation theory, the nucleation rate strongly depends on the NAT sat-uration ratio, J ∼ exp(−A(T )/(ln SNAT)2), where A is a function of temperature. If we assume such a dependency, the nucleation process acts like a switch and all available nuclei may be activated within a small temperature range, which is contradictory to the
5
variety of PSC number densities observed in the winter 2002/2003 or in previous win-ters. To consistently model the existing PSC observations, either more than one type of nucleus or different nucleation mechanisms may be required, which is conceivably true for meteoritic material. All those processes may add up, smearing the dependency on SNAT and resulting in an average effective NAT nucleation rate.
10
7. Conclusions
Low number densities (n∼1.6×10⁻⁴cm−3) of NAT particles with diameters d <6 µm have been detected by in-situ instruments onboard the Geophysica in the Arctic polar stratosphere in winter 2002/2003. In contrast to previous observations, those particles have formed in less than a day at high temperatures (T >TNAT−3.5 K) thus very low
15
NAT supersaturations (SNAT.11), which until recently has not been considered likely to happen. NAT nucleation at temperatures so close to TNAT increases the time scales and regions of PSC occurrence, which in turn may lead to more efficient denitrification and thus to enhanced polar ozone loss.
Given the scarcity of data, we estimate here a constant average NAT nucleation
20
rate JNAT=8×10⁻⁶cm−3 air h−1 for the temperature range TNAT>T >TNAT−3.5 K. A de-pendence on temperature or NAT supersaturation can not be determined from these data. Also, the NAT nucleation rate may vary from year to year or during the course of a winter. For the late Arctic winter 2002/2003 calculations with the effective nucle-ation rate of 8×10⁻⁶cm−3air h−1as derived in the present study reasonably reproduce
25
our observations of NAT particle number density, size distribution and additionally of 8595
ACPD
4, 8579–8607, 2004
Nitric acid trihydrate (NAT) formation at low NAT supersaturations C. Voigt et al. Title Page Abstract Introduction Conclusions References Tables Figures J I J I Back Close Full Screen / Esc
Print Version Interactive Discussion
EGU
denitrification measured by SIOUX (Schlager et al., in preparation, 20041) or satellite (Davies et al., submitted, 2004).
We show that NAT nucleation on ubiquitous meteoritic smoke particles may present a pathway for solid particle formation at temperatures above the ice frost point. However, the detailed mechanism and the spatial and temporal variation of the meteoritic smoke
5
particles as well as the temperature dependence of the NAT nucleation rate on these remain a challenge for future laboratory and field studies.
Acknowledgements. We thank the Geophysica crew, F. Stroh for excellent project
co-ordination, J.-U. Grooß for trajectory data, M. Mahoney for temperature comparisons, R. Weigel for CN counter data, F. Cairo and R. Matthey for data from optical instruments, K. Carslaw and
10
M. Kr ¨amer for helpful discussions. We thank the European Centre for Medium-range Weather Forecasts and MeteoSwiss for meteorological data. This work has been funded by the Eu-ropean Community and the Swiss BBW under the contracts EVK2-2001-00084-EuPLEx and EVK-2000-00077-MAPSCORE.
References
15
Adriani, A., Deshler, T., Gobbi, G. P., et al.: Polar stratospheric clouds over McMurdo, Antarc-tica, during the 1991 spring: Lidar and particle counter measurements, Geophys. Res. Lett., 19(17), 1755–1758, doi:10.1029/92GL01941, 1992.
Biermann, U. M., Presper, T., Koop, T., et al.: The Unsuitability of Meteoritic and Other Nuclei for Polar Stratospheric Cloud Freezing, Geophys. Res. Lett., 23, 1693–1696, 1996.
20
Borrmann, S., Thomas, A., Rudakov, V., et al.: In-situ aerosol measurements in the northern hemispheric stratosphere of the 1996/7 winter on the Russian M-55 Geophysika high altitude research aircraft, Tellus, 52B, 1088–1103, 2000.
Carslaw, K. S., Luo, B. P., Clegg, S., et al.: Stratospheric aerosol growth and HNO3gas phase depletion from coupled HNO3and water uptake by liquid particles, Geophys. Res. Lett., 21,
25
2479–2482, 1994.
Carslaw, K. S., Wirth, M., Tsias, A., et al.: Particle Microphysics and Chemistry in Remotely Observed Mountain Polar Stratospheric Clouds, J. Geophys. Res., 103, 5785–5796, 1998.
ACPD
4, 8579–8607, 2004
Nitric acid trihydrate (NAT) formation at low NAT supersaturations C. Voigt et al. Title Page Abstract Introduction Conclusions References Tables Figures J I J I Back Close Full Screen / Esc
Print Version Interactive Discussion
EGU
Carslaw, K. S., Peter, T., and Bacmeister, J. T.: Widespread solid particle formation by mountain waves in the Arctic stratosphere, J. Geophys. Res., 104(D1), 1827–1836, doi:10.1029/1998JD100033, 1999.
Carslaw, K. S., Kettleborough, J. A., Northway, M. J., et al.: A vortex-scale simulation of the growth and sedimentation of large nitric acid hydrate particles, J. Geophys. Res., 107 (D20),
5
8300, doi:10.1029/2001JD000467, 2002.
Cziczo, D. J., Thomson, D. S., and Murphy, D. M.: Ablation, Flux and Atmospheric Impications Inferred from Stratospheric Aerosol, Science, 291, 1772–1775, 2001.
Davies, S., Mann, G., Carslaw, K. S., et al.: 3-D microphysical model studies of Arctic denitrifi-cation: comparison with observations, Atmos. Chem. Phys. Discuss., accepted, 2004.
10
Deshler, T., Larsen, N., Weisser, C., et al.: Large nitric acid particles at the top of an Arctic stratospheric cloud, J. Geophys. Res., 108 (D16), 4517, doi:10.1029/2003JD003479, 2003. D ¨ornbrack, A., Leutbecher, M., Kivi, R., and Kyr ¨o, E.: Mountain-wave induced record low
strato-spheric temperatures above northern Scandinavia, Tellus, 51A, 951–963, 1999.
Drdla, K., Schoeberl, M. R., and Browell, E. V.: J. Geophys. Res., 108 (D5), 8312,
15
doi:10.1029/2001JD000782, 2003.
Dhaniyala, S., McKinney, K. A., and Wennberg, P. O.: Lee-wave clouds and denitrification of the polar stratosphere, Geophys. Res. Lett., 29 (9), doi:10.1029/2001GL013900, 2002. Fahey, D., Solomon, S., Kawa, S. R., et al.: Observations of denitrification and dehydration in
the polar winter stratosphere, Nature, 344, 321–324, 1990.
20
Fahey, D. W., Gao, R. S., Carslaw, K. S., et al.: The detection of large HNO3-containing particles in the winter arctic stratosphere, Science, 291, 1026–1031, 2001.
Fueglistaler, S., Luo, B. P., Voigt, C., et al.: NAT-rock formation by mother clouds: a microphys-ical model study, Atmos. Chem. Phys., 2, 93–98, 2002.
Grooß, J. U., G ¨unther, G., M ¨uller, R., et al.: Simulation of denitrification and ozone losse for the
25
Arctic winter 2002/2003, Atmos. Chem. Phys. Discuss., 4, 8069–8101, 2004.
Hanson, D. and Mauersberger, K.: Laboratory studies of the nitric acid trihydrate: Implications for the south polar stratosphere, Geophys. Res. Lett., 15, 855–858, 1988.
Hinds, W. C.: Aerosol technology: properties, behaviour, and measurement of airborne parti-cles, 2nd ed., John Wiley & Sons, Inc., New York, 1999.
30
Hunten, D., Turco, R. P., and Toon, O. B.: Smoke and Dust Particles of Meteoric Origin in the Mesosphere and Stratosphere, J. Atmos. Sci., 37, 6, 1342–1357, 1980.
Knopf, D. A., Koop, T., Luo, B. P., et al.: Homogeneous nucleation of NAD and NAT in liquid
ACPD
4, 8579–8607, 2004
Nitric acid trihydrate (NAT) formation at low NAT supersaturations C. Voigt et al. Title Page Abstract Introduction Conclusions References Tables Figures J I J I Back Close Full Screen / Esc
Print Version Interactive Discussion
EGU
stratospheric aerosols: insufficient to explain denitrification, Atmos. Chem. Phys., 2, 207– 214, 2002.
Koop, T., Biermann, U. M., Raber, W., et al.: Do stratospheric aerosol droplets freeze above the ice frost point?, Geophys. Res. Lett., 22(8), 917–920, doi:10.1029/95GL00814, 1995. Koop, T., Luo, B. P., Biermann, U., et al.: Freezing of HNO3/H2SO4/H2O Solutions at
Strato-5
spheric Temperatures: Nucleation Statistics and Experiments, J. Phys. Chem. A, 101, 1117– 1133, 1997.
Koop, T., Luo, B. P., Tsias, A., and Peter, T.: Water activity as the determinant for homogeneous ice nucleation in aqueous solutions, Nature, 406, 611–614, 2000.
Kr ¨amer, M. and Afchine, A.: Sampling characteristics of inlets operated at low U/U 0 ratios: new
10
insights from computational fluid dynamics (CFX) modeling, J. Aerosol Sci., 35, 6, 683–694, 2004.
Larsen, N., Knudsen, B., Svendsen, S., et al.: Formation of solid particles in synoptic-scale Arctic PSCs in early winter 2002/2003, Atmos. Chem. Phys., 4, 2001–2013, 2004.
Luo, B., Voigt, C., F ¨uglistaler, S., and Peter, T.: Extreme NAT supersaturations in
moun-15
tain wave ice PSCs: a clue to NAT formation, J. Geophys. Res., 108 (D15), 4441, doi:10.1029/2002JD003104, 2003.
Mann, G., Davies, S., Carslaw, K., and Chipperfield, M.: Factors controlling Arctic denitrification in cold winters of the 1990s, Atmos. Chem. Phys., 3, 403–416, 2003.
Mitev, V., Matthey, R., and Makarov, V.: Miniature backscatter lidar for cloud and aerosol
obser-20
vation from high altitude aircraft, Rec. Res. Devel. Geophys., 4, 207, ISBN: 81-7736-076-0, 2002.
Murphy, D. M., Thomson, D. S., and Mahoney, M. J.: In situ Measurements of Organics, Mete-oritic Material, Mercury and Other Elements in Aerosols at 5 to 19 Kilometers, Science, 282, 1664–1667, 1998.
25
Northway, M. J., Gao, R. S., Popp, P. J., et al.: An analysis of large HNO3-containing particles sampled in the Arctic stratosphere during the winter of 1999–2000, J. Geophys. Res., 107, 8289, doi:10.1029/2001JD001079, 2002.
Peter, T.: Microphysics and heterogeneous chemistry of polar stratospheric clouds, Ann. Rev. Phys. Chem., 48, 785–822, 1997.
30
Poole, L. R., Trepte, C. R., Harvey, V. L., et al.: SAGE III observations of Arctic polar strato-spheric clouds – December 2002, Geophys. Res. Lett., 30, 23, 2216–2220, 2003.
ACPD
4, 8579–8607, 2004
Nitric acid trihydrate (NAT) formation at low NAT supersaturations C. Voigt et al. Title Page Abstract Introduction Conclusions References Tables Figures J I J I Back Close Full Screen / Esc
Print Version Interactive Discussion
EGU
Nitric Acid Solutions at Polar Stratospheric Temperatures, J. Phys. Chem., 105, 1433–1439, 2001.
Schreiner, J., Voigt, C., Kohlmann, A., et al.: Chemical analysis of polar stratospheric cloud particles, Science, 283, 968–970, 1999.
Schreiner, J., Voigt, C., Mauersberger, K., et al.: Chemical, microphysical, and optical
proper-5
ties of polar stratospheric clouds, J. Geophys. Res., 108, 8313, doi:10.1029/2001JD000825, 2003.
Schiller, C., Bauer, R., Cairo, F., et al.: Dehydration in the Arctic stratosphere during the SOLVE/THESEO-2000 campaigns, J. Geophys. Res., 107 (D20), 8293, doi:10.1029/2001JD000463, 2002.
10
Schmitt, J.: Aufbau und Erprobung eines in-situ NO/NOy-Mess-Systems am
H ¨ohenforschungsflugzeug Geophysica, PhD Thesis, edited by: DLR, D-51170 K ¨oln, ISRN DLR-FB-2003-21, 2004.
Scientific Assessment of ozone depletion, 1998, WMO Report No. 44, Geneva, 1999.
Tabazadeh, A., Djikaev, Y. S., Hamill, P., et al.: Laboratory evidence for surface nucleation of
15
Solid Polar Stratospheric Cloud Particles, J. Phys. Chem. A, 106, 10 238–10 246, 2002. Thomas, A.: In situ measurements of background aerosol and subvisible cirrus in the tropical
tropopause region, J. Geophys. Res., 107 (D24), 4763, doi:10.1029/2001JD001385, 2002. Tolbert, M. and Toon, B.: Solving the PSC mystery, Science, 292, 61–63, 2001.
Toon, O. B., Tabazadeh, A., Browell, E. V., and Jordan, J.: Analysis of lidar observations of
20
Arctic polar stratospheric clouds during January 1989, J. Geophys. Res., 105(16), 20 589– 20 615, 2000.
Voigt, C., Schreiner, J., Kohlmann, A., et al.: Nitric Acid Trihydrate (NAT) in Polar Stratospheric Clouds: Science, 290, 1756–1758, 2000a.
Voigt, C., Tsias, S., D ¨ornbrack, A., et al.: Non-equilibrium compositions of liquid polar
strato-25
spheric clouds in gravity waves, Geophys. Res. Lett., 27, 3873–3876, 2000b.
Voigt, C., Larsen, N., Deshler, T., et al.: In situ mountain-wave polar stratospheric cloud measurements: Implications for nitric acid trihydrate formation, J. Geophys. Res., 108, D5, doi:10.1029/2001JD001185, 2003.
Waibel, A., Peter, T., Carslaw, K. S., et al.: Arctic Ozone Loss Due to Denitrification, Science,
30
283, 2064–2069, 1999.
Wirth, V., Tsias, A., D ¨ornbrack, A., Weiß, V., Carslaw, K. S., Leutbecher, M., Renger, W., Volkert, H., and Peter, T.: Model-guided Lagrangian observation and simulation
ACPD
4, 8579–8607, 2004
Nitric acid trihydrate (NAT) formation at low NAT supersaturations C. Voigt et al. Title Page Abstract Introduction Conclusions References Tables Figures J I J I Back Close Full Screen / Esc
Print Version Interactive Discussion
EGU
of mountain polar stratospheric clouds, J. Geophys. Res., 104(D19), 23 971–23 982, doi:10.1029/1998JD900095, 1999.
Worsnop, D. R., Fox, L. E., Zahniser, M. S., and Wofsy, S. C.: Vapor pressures of solid hydrates of nitric acid: implications for polar stratospheric clouds, Science, 259, 71–74, 1993.
ACPD
4, 8579–8607, 2004
Nitric acid trihydrate (NAT) formation at low NAT supersaturations C. Voigt et al. Title Page Abstract Introduction Conclusions References Tables Figures J I J I Back Close Full Screen / Esc
Print Version Interactive Discussion EGU 1
70N
65N
60N
GM 10E 20E
Temperature (K)
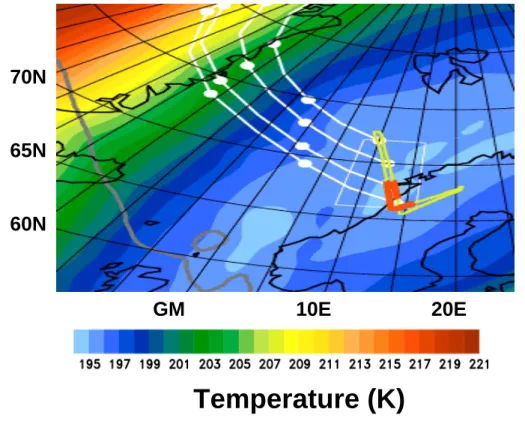
Fig. 1. ECMWF analysed temperature (K, color coded) at 60 hPa on 6 February 2003 at
12:00 UT. The flight path is marked in yellow and the part of the flight with particle observations is marked by the thick red line. White lines indicate selected air parcel backward trajectories. Each white dot marks a duration of 12 h. The white square indicates the region, in which the parcel trajectories end. The thick grey line is the vortex edge, defined by a potential vorticity of 3×10⁻⁶km2kg−1s−1.
ACPD
4, 8579–8607, 2004
Nitric acid trihydrate (NAT) formation at low NAT supersaturations C. Voigt et al. Title Page Abstract Introduction Conclusions References Tables Figures J I J I Back Close Full Screen / Esc
Print Version Interactive Discussion EGU 190 195 200 14 15 16 17 16 18 8 10 12 14 16 A B D C D C NO y (p pb v) TICE T NAT Te mp er at u re (K ) Al ti tude ( k m) 14.5 14.6 14.7 0.0 0.5 1.0 ∆ NOy ( p p b v) 16.4 16.6 16.8 0.0 0.5 1.0
Time (hours UT)
∆ N O y ( p pb v) Fig. 2.
ACPD
4, 8579–8607, 2004
Nitric acid trihydrate (NAT) formation at low NAT supersaturations C. Voigt et al. Title Page Abstract Introduction Conclusions References Tables Figures J I J I Back Close Full Screen / Esc
Print Version Interactive Discussion
EGU
(A) Total NOy (gas phase plus enhanced particulate NOy) measurements through the forward facing inlet (red curve) and gas phase NOy measurements through the backward facing inlet (black curve) versus universal time (UT) on 6 February 2003. Regions with particle observa-tions (red flight segments in Fig. 1) are marked by blue squares.(B) Flight altitude (grey),
tem-perature (black), TNAT (green dots) and TICE (cyan dots). TNAT and TICE have been calculated
5
using gas phase NOymeasurements and water vapor measurements onboard the Geophysica. The particles have been observed at T>TICE+4 K. (C, D) Expanded view of particulate reactive
nitrogen, ∆NOy, in regions marked by blue squares in (A). ∆NOy derives from a subtraction of NOy,tot and NOy,gas. Note that∆NOy has to be corrected for particle enhancement, E (d ). Particles are indicated by individual peaks in the data (C) and by intensified signal fluctuations
10
(C and D). The dashed black line in (C and D) shows the detection limit for particle NOy.
ACPD
4, 8579–8607, 2004
Nitric acid trihydrate (NAT) formation at low NAT supersaturations C. Voigt et al. Title Page Abstract Introduction Conclusions References Tables Figures J I J I Back Close Full Screen / Esc
Print Version Interactive Discussion EGU 0.1 1.0 10.0 Diameter (um) 10-6 10-4 10-2 100 102 dn/dln(d) (cm -3 )
B
0.0 0.2 0.4 0.6 0.8 1.0 1.2 1.4 Delta NOy (ppbv ) 0 10 20 30 40 50 Distribution Simulation Measurements Simulation, n NAT halved Simulation, n NAT doubledA
ACPD
4, 8579–8607, 2004
Nitric acid trihydrate (NAT) formation at low NAT supersaturations C. Voigt et al. Title Page Abstract Introduction Conclusions References Tables Figures J I J I Back Close Full Screen / Esc
Print Version Interactive Discussion
EGU
(A) Fit of the results of the Monte Carlo simulations (red line) to the occurrence histogram of a
600 s long sequence of NOydata taken near 14.65 h UT (thick black line). Number density and width of the size classes of NAT particles has been varied in the simulations to fit the occurrence histogram of the NOy data. Sensitivity studies have been performed either halving (thin black line) or doubling the NAT number density (dashed line), both leading to significant deteriorations
5
of the fit. (B) Particle size distribution (thick black lines) at 18.3 km altitude derived from the
Monte Carlo simulations of the NOy data. The large mode of the particle size distribution consists of NAT particles with 2 µm<d <5.5 µm at a number density of 1.6×10⁻⁴cm−3. The error in the NAT number density is ± a factor of 2, as derived from the simulations. The small mode of the particle size distribution shows the ternary background aerosol distribution with a
10
median diameter of 0.17 µm containing 0.03 ppbv HNO3. For comparison, thin black line shows particle size distribution measured by the FSSP. The error bars indicate the 96% confidence levels. The dashed line shows the NAT particle size distribution simulated with the DLAPSE model (Carslaw et al., 2002) near the flight track between 410 to 430 K potential temperature in a region of 66–69◦latitude north and 12–16◦longitude east.
15
ACPD
4, 8579–8607, 2004
Nitric acid trihydrate (NAT) formation at low NAT supersaturations C. Voigt et al. Title Page Abstract Introduction Conclusions References Tables Figures J I J I Back Close Full Screen / Esc
Print Version Interactive Discussion EGU
-8
-6
-4
-2
0
T - T
NAT[K]
0
5
10
15
Diameter [um]
1 h 4 h 12 h 24 h 48 hFig. 4. Box model calculation of NAT particle growth for 10 ppbv total HNO3and 5 ppmv H2O at 50 hPa as a function of the temperature difference with respect to TNAT. The black lines show
NAT particle diameters for different growth times between 1 h and 2 days. The deceleration of NAT growth at very low temperatures results from gas phase depletion of nitric acid due to the uptake by ternary aerosol droplets.
ACPD
4, 8579–8607, 2004
Nitric acid trihydrate (NAT) formation at low NAT supersaturations C. Voigt et al. Title Page Abstract Introduction Conclusions References Tables Figures J I J I Back Close Full Screen / Esc
Print Version Interactive Discussion EGU 5
-200
-100
-20
-10
0
-3
0
3
6
9
12
Time till PSC event (neg. hours)
T
NATECMWF white area
ECMWF PSC
MM5 PSC
T-T
NA T(K
)
Fig. 5. T −TNAT along 3-D backward trajectories based on 6-h T511/L60 ECMWF operational
analysis (red lines and grey shading) and trajectories calculated with the mesoscale MM5 model (D ¨ornbrack et al., 1999) (orange lines). Grey shading shows the ensemble of all trajec-tories ending on 6 February at 12:00 UT inside the white box marked in Fig. 1 on a 0.5◦×0.5◦ lat/long grid at 70 hPa. Red and orange lines are trajectories ending at the Geophysica flight path during times of PSC detection at 70 hPa pressure altitude. TNAT has been calculated from
the measured NOy and water vapor profiles. A similar analysis has been performed for the return flight (not shown here).