HAL Id: hal-00297733
https://hal.archives-ouvertes.fr/hal-00297733
Submitted on 5 Aug 2004HAL is a multi-disciplinary open access
archive for the deposit and dissemination of sci-entific research documents, whether they are pub-lished or not. The documents may come from teaching and research institutions in France or abroad, or from public or private research centers.
L’archive ouverte pluridisciplinaire HAL, est destinée au dépôt et à la diffusion de documents scientifiques de niveau recherche, publiés ou non, émanant des établissements d’enseignement et de recherche français ou étrangers, des laboratoires publics ou privés.
Link or sink: a modelling interpretation of the open
Baltic biogeochemistry
M. Vichi, P. Ruardij, J. W. Baretta
To cite this version:
M. Vichi, P. Ruardij, J. W. Baretta. Link or sink: a modelling interpretation of the open Baltic biogeochemistry. Biogeosciences Discussions, European Geosciences Union, 2004, 1 (1), pp.219-274. �hal-00297733�
BGD
1, 219–274, 2004
Model of the open Baltic biogeochemistry M. Vichi et al. Title Page Abstract Introduction Conclusions References Tables Figures J I J I Back Close Full Screen / Esc
Print Version Interactive Discussion © EGU 2004 Biogeosciences Discussions, 1, 219–274, 2004 www.biogeosciences.net/bgd/1/219/ SRef-ID: 1810-6285/bgd/2004-1-219 © European Geosciences Union 2004
Biogeosciences Discussions
Biogeosciences Discussions is the access reviewed discussion forum of Biogeosciences
Link or sink: a modelling interpretation of
the open Baltic biogeochemistry
M. Vichi1, P. Ruardij2, and J. W. Baretta3 1
National Institute of Geophysics and Volcanology, Bologna, Italy
2
Royal Netherlands Institute of Sea Research, Texel, The Netherlands
3
Noctiluca, Wassenaar, The Netherlands
Received: 30 June 2004 – Accepted: 20 July 2004 – Published: 5 August 2004 Correspondence to: M. Vichi ([email protected])
BGD
1, 219–274, 2004
Model of the open Baltic biogeochemistry M. Vichi et al. Title Page Abstract Introduction Conclusions References Tables Figures J I J I Back Close Full Screen / Esc
Print Version Interactive Discussion
© EGU 2004 Abstract
A 1-D model system, consisting of the 1-D version of the Princeton Ocean Model (POM) coupled with the European Regional Seas Ecosystem Model (ERSEM) has been applied to a sub-basin of the Baltic Proper, the Bornholm basin. The model has been forced with 3h meteorological data for the period 1979–1990, producing a
12-5
year hindcast validated with datasets from the Baltic Environmental Database for the same period. The model results demonstrate the model to hindcast the time-evolution of the physical structure very well, confirming the view of the open Baltic water col-umn as a three layer system of surface, intermediate and bottom waters. Comparative analyses of modelled hydrochemical components with respect to the independent data
10
have shown that the long-term system behaviour of the model is within the observed ranges. Also primary production processes, deduced from oxygen (over)saturation are hindcast correctly over the entire period and the annual net primary production is within the observed range. The largest mismatch with observations is found in simulating the biogeochemistry of the Baltic intermediate waters. Modifications in the structure of
15
the model (addition of fast-sinking detritus and polysaccharide dynamics) have shown that the nutrient dynamics is linked to the quality and dimensions of the organic mat-ter produced in the euphotic zone, highlighting the importance of the residence time of the organic matter within the microbial foodweb in the intermediate waters. Exper-iments with different scenarios of riverine nutrient loads, assessed in the limits of a
20
1-D setup, have shown that the external input of organic matter makes the open Baltic model more heterotrophic. The characteristics of the inputs also drive the dynamics of nitrogen in the bottom layers leading either to nitrate accumulation (when the external sources are inorganic), or to coupled nitrification-denitrification (under strong organic inputs). The model indicates the permanent stratification to be the main feature of the
25
system as regulator of carbon and nutrient budgets. The model predicts that most of the carbon produced in the euphotic zone is also consumed in the water column and this enhances the importance of heterotrophic benthic processes as final closures of
BGD
1, 219–274, 2004
Model of the open Baltic biogeochemistry M. Vichi et al. Title Page Abstract Introduction Conclusions References Tables Figures J I J I Back Close Full Screen / Esc
Print Version Interactive Discussion
© EGU 2004
carbon and nutrient cycles in the open Baltic.
1. Introduction
The estimate of net ecosystem production (NEP) of coastal shelf systems is relevant for the understanding of carbon dynamics in the world ocean (Smith and Hollibaugh,
1993). Many efforts have been recently undertaken to analyse the role of the
conti-5
nental shelves to act as carbon sources and/or sinks (Gattuso et al.,1998;Tsunogai
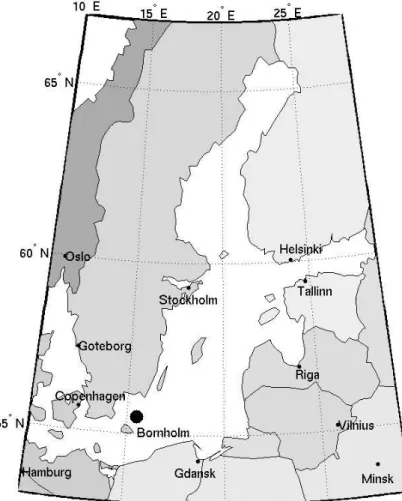
et al.,1999;Gazeau et al.,2004), and the fragmentary picture obtained so far is com-plicated by some discordances in the results. Focusing on on a well-studied shelf sea such as the Baltic Sea (Fig.1), recent estimates report a large variability in the total NEP, from largely positive values in the Gulf of Gdansk to negative values in
estuar-10
ies, with a slightly positive global average of about 0.2–0.5 mmol C m−2d−1 (Thomas
et al.,2003a,2004;Gazeau et al.,2004). The assessment of carbon budgets and its use for predicting the response to climate changes is, however, hampered by various uncertainties. The coastal zone is characterised by tight linkages between pelagic and benthic processes and the response of these two systems are substantially different.
15
Moreover, the functioning of marine ecosystems is not solely related to the carbon dy-namics, but this component is loosely linked to the biogeochemical cycles of the other main macronutrients. These cycles are ultimately modulated by hydrodynamics and by the different food-web interactions that can develop in the highly-variable coastal zones.
20
To further understand and predict the behaviour of these systems, it is necessary to assess the response to both physical and biological perturbations. In theory, this can be achieved by measuring the biogeochemical fluxes under different conditions, but in practice it is impossible to measure all relevant in situ biological rates at a suf-ficiently high sampling frequency and spatial distribution. Therefore, limited
process-25
oriented experiments supported by coupled physical-biogeochemical models are im-portant tools to test the significance of the many dynamical connections and to identify
BGD
1, 219–274, 2004
Model of the open Baltic biogeochemistry M. Vichi et al. Title Page Abstract Introduction Conclusions References Tables Figures J I J I Back Close Full Screen / Esc
Print Version Interactive Discussion
© EGU 2004
the key processes and the possible cause-effect relationships among variables. The first requirement for this task is to have a mathematical description of marine bio-geochemical processes that has been proved to have a certain degree of predictability under different conditions. This part is discussed in this paper with a one-dimensional (1-D) representation of a southern Baltic Proper water column located in the Bornholm
5
basin. The model was used as a tool to explain the evolution of the available biogeo-chemical variables, highlighting skills and limitations of current parameterisations of marine biogeochemistry. The reference dataset for the Baltic Proper was the Baltic En-vironmental Database (Wulff and Rahm,1990, BED) accessed via the SwingStations web-interface (Sokolov and Wulff,1999). The original aim of this coupled model
appli-10
cation to the open Baltic was thus to establish whether a long-term (decadal) hindcast, using high-frequency (3h) meteorological data for the surface-forcing would be able to reproduce the independent BED-data set of hydrochemical data. In other words: can a 1-D description of an essentially 3-D system capture some, most or even all of the biogeochemical dynamics of the system? The short answer is: thanks to the specific
15
vertical structure of the open Baltic and its weak and variable large-scale circulation, yes it can. The long answer, including detailed supporting evidence is provided in this paper.
Indeed, the main hydrographic feature of the Baltic Proper is the permanent salinity stratification, which is maintained by intermittent inflows of salt water from the North
20
Sea into the Arkona and Bornholm basins, and by the runoff of the major drainage rivers. The two major effective inflows in last 25 years occurred in 1975–1976 and in 1993, delimiting a long stagnation period without a renewal of the waters in the deeper parts of the basin. A subset of this time window (1979–1990) is the target period of this investigation. The Baltic Proper can be ideally schematised as a three layer system
25
of surface, intermediate and bottom waters (BSW, BIW and BBW, respectively), and this study further confirms this view. The permanent pycnocline is located at about 50–60 m depth acting as a stable barrier to the vertical transport of dissolved nutrients. In general, deep-water mixing has a seasonal variability with higher rates in fall and
BGD
1, 219–274, 2004
Model of the open Baltic biogeochemistry M. Vichi et al. Title Page Abstract Introduction Conclusions References Tables Figures J I J I Back Close Full Screen / Esc
Print Version Interactive Discussion
© EGU 2004
winter (Stigebrandt, 1987) and is dominated by the energy input from the wind via inertial currents, internal waves and, in waters shallower than 150 m, also by the coastal boundary layer (Axell, 1998). During summer, a thermocline is formed in the upper layer at around 20 m. This physically identifies the intermediate layer, which is generally isohaline but acts as a further nutricline (Rahm et al.,2000).
5
After establishing that vertical water-column dynamics in the Baltic effectively domi-nate over advective processes (which cannot be explicitly represented in 1-D models), a second aim has been to attempt quantifying both the ecological role of the benthic system in oxic, hypoxic and anoxic conditions and the effect of winter deep-mixing events on the redistribution of nutrients over the watercolumn, accounting dynamically
10
for the time-varying density structure of the water column. Last but not least, our aim has been to provide a set of scenarios of external nutrient loads (both from freshwater and atmospheric sources) and to investigate the response of the system, specifically focusing on the fate of carbon. Obviously, this is fraught with uncertainties in a 1-D system, as freshwater runoff is a purely advective process.
15
2. Methods
The ecosystem model used in this work is a coupling between a reviewed version of the European Regional Sea Ecosystem Model (Baretta et al.,1995, ERSEM) and the 1-D version of the Princeton Ocean Model (Blumberg and Mellor, 1987, POM). The 1-D version of POM is essentially a vertically resolved boundary layer model, which is
20
based on the turbulence closure scheme proposed byMellor and Yamada(1982, M-Y, version 2.5). The model determines the dynamical vertical structure and the actual turbulent diffusive vertical transport in the water column, as driven by the boundary conditions at the air-sea interface and at the bottom.
The biomass-based model ERSEM, by construction, simulates the matter flows
be-25
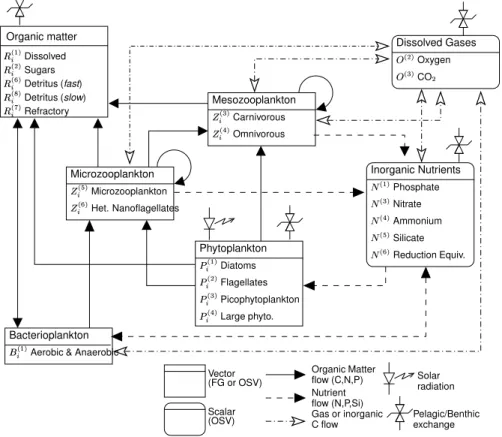
twen the lower trophic levels of marine food webs and their role in the biogeochem-ical cycles of the major elements, C, N, P, Si and O. The pelagic food web (Fig. 2)
BGD
1, 219–274, 2004
Model of the open Baltic biogeochemistry M. Vichi et al. Title Page Abstract Introduction Conclusions References Tables Figures J I J I Back Close Full Screen / Esc
Print Version Interactive Discussion
© EGU 2004
is composed of a basic set of functional groups. The biomass of a functional group is determined by the amount of C, N, P (and Si for diatoms) contained in the cells, and the different elements are exchanged differentially with the inorganic pools and with the other groups. ERSEM is thus potentially capable to describe conditions of unbalanced phytoplankton growth and, thanks to the inclusion of an explicit microbial
5
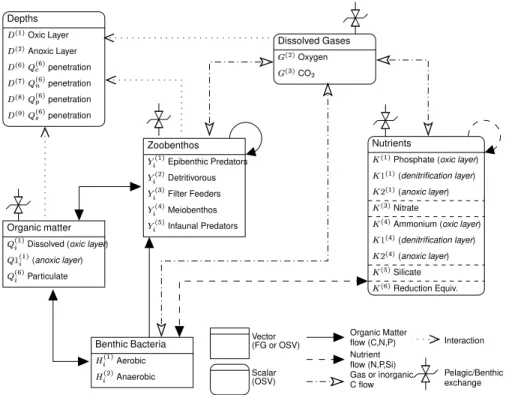
compartment, the dynamical shifting between various food webs (for instance, from the microbial loop to the classical grazing food web). The benthic system (Fig.3) describes both the trophic web interactions in the benthos (Ebenh ¨oh et al.,1995;Blackford,1997) and nutrient regeneration processes occurring in the first 0.3 m of sediments (Ruardij
and Van Raaphorst, 1995). The sediments are divided in three dynamical layers in
10
order to simulate the processes occurring under oxic, anoxic and denitrifying condi-tions. Several groups of benthic organisms affect the distribution of organic matter in the sediments and determine the locations where the remineralisation effectively oc-curs. ERSEM was recently reviewed byVichi(2002), and the full set of equations was unified with a common mathematical formulation. The revised version (ERSEM III)
15
has the same scientific background of ERSEM I/II (Baretta et al.,1995;Baretta-Bekker
et al.,1997), with the addition of some innovations and bug-fixes.
In particular, specifically to deal with the open Baltic features, the model was im-proved with the treatment of hypoxic conditions and coupled denitrification. In general, the biogeochemical cycle of inorganic N in coastal seas is subject to a complex
ar-20
ray of regulatory mechanisms involving the two main species NO−3 and NH+4 and the microbially mediated processes of ammonification (remineralization), nitrification, den-itrification and nitrogen fixation (Herbert,1999). Such processes (excluding fixation) mainly take place in the sediments, therefore the simulation of benthic dynamics is of great importance. The dominance of one process over another is largely determined
25
by the redox conditions in the water column, which are, in turn, connected to the hy-drodynamics and to the rate of detritus deposition and mineralisation. The standard ERSEM formulation already comprised the parameterisation of these processes in the sediment model (Ruardij and Van Raaphorst, 1995), mainly described as first order
BGD
1, 219–274, 2004
Model of the open Baltic biogeochemistry M. Vichi et al. Title Page Abstract Introduction Conclusions References Tables Figures J I J I Back Close Full Screen / Esc
Print Version Interactive Discussion
© EGU 2004
reactions. In ERSEM III, the parameterisation of denitrification has been modified to include this process as a nitrogen sink in the Baltic (Wulff and Stigebrandt,1989;Eilola
and Stigebrandt,1999). The denitrification sites are first and foremost the sediments
(Tuominen et al., 1998; Herbert, 1999) but denitrification has been demonstrated to
occur also in the Baltic water column (R ¨onner and S ¨orensson,1985). In order to
in-5
corporate the dependence on the organic matter availability, denitrification has been coupled to the biological oxygen demand under hypoxic/anoxic conditions (anoxic min-eralisation), both in the water and in the sediments.
Since the Baltic Proper has shown an alternation of positive and negative redox con-ditions during the investigated stagnation period, it is important that the model is able to
10
deal with both situations, in order to shift from nitrification to denitrification. In the den-itrification reaction, nitrate is used as an electron acceptor for metabolic activity at low oxygen concentrations and the model formulation has been set up such that pelagic bacteria switch to nitrate consumption, modifying the redox conditions. When oxygen is completely depleted, hydrogen sulphide is formed at the water-sediment interface,
15
as a result of the bacterial reduction of sulphate ions in the sediments. The bacterial oxygen demand is thus redirected to the sulphate ions, and the formation of one sul-phide ion corresponds to the consumption of two oxygen molecules. The concept of “negative oxygen” (Fonselius,1981) is based on this reaction, and multiplication by 2 of the H2S value gives the “negative” O2. This process was parameterized by allowing the
20
dynamical coexistence of oxygen and HS− in the sediments and in the water column (“reduction equivalents” K(6)and N(6), respectively, see Figs.2and3), and the molecu-lar diffusion of these reduction equivalents at the water-sediment interface. Therefore, the absolute amount of oxygen (and hence the redox condition of the system) is given by the actual oxygen concentration minus the concentration of reduction equivalents
25
multiplied by the stoichiometric factor 2. In presence of oxygen, reduction equivalents are again reoxidized to sulphate with a fast first-order reaction.
BGD
1, 219–274, 2004
Model of the open Baltic biogeochemistry M. Vichi et al. Title Page Abstract Introduction Conclusions References Tables Figures J I J I Back Close Full Screen / Esc
Print Version Interactive Discussion
© EGU 2004
3. Model implementation
3.1. Model location and setup
The 1-D model is located in the Bornholm basin at 55.5◦N 15.5◦E, where the mean depth of the water column is 80 m. The model has 20 vertical levels with a logarith-mic depth distribution both at the surface and at the bottom. The physical model is
5
forced with surface fluxes computed from the 1979–1990 atmospheric data provided by L. Mueller at SMHI to the EU-funded BASYS project (BAltic Sea SYstem Study). The frequency of the meteorological data is three hours except for precipitation (half-daily) and solar radiation ((half-daily). The model interpolates between two three-hourly values to the numerical time step of 540 s via a linear interpolation and the fluxes are
10
calculated using the prognostic sea surface temperature (SST) by means of the bulk formulations collected byCastellari et al. (1998). In order to resolve the daily cycle, the astronomically-derived solar radiation according toDobson and Smith(1988), cor-rected by three-hourly cloudiness from the BASYS dataset, has been preferred to the daily average value given in the original dataset.
15
The validity of the 1-D physical approximation in the Baltic Proper is confirmed by dif-ferent model results (Omstedt and Axell,1998, see also below) and is mainly linked to the absence of a well-defined general circulation and the weakness of the tidal forcing. The circulation cells are mostly confined to the sub-basin level, with small horizontal exchanges between the basins (Lehmann and Hinrichsen,2000), therefore enhancing
20
the relevance of the vertical turbulent transport processes driven by the exchange of momentum and heat at the air-sea interface. Nevertheless, a 1-D model has obvi-ous limitations in simulating deep phenomena such as dense water entrainment, the observed seasonal variability of the deep water mixing and the formation of density currents (Axell,1998;Stigebrandt,1987). Moreover, the imposition of realistic forcing
25
functions at the surface tends to destroy the permanent salinity gradient that needs to be restored by means of specialized parameterisations. In order to partially include these phenomena, the pycnocline variability has been parameterised as inStigebrandt
BGD
1, 219–274, 2004
Model of the open Baltic biogeochemistry M. Vichi et al. Title Page Abstract Introduction Conclusions References Tables Figures J I J I Back Close Full Screen / Esc
Print Version Interactive Discussion
© EGU 2004
(1987) andOmstedt and Axell(1998) by substituting the background eddy-diffusivity of the M-Y with an inverse function of the buoyancy frequency N, as Kb=α N−1.
Stige-brandt (1987) found the parameter α to be in the order of 2.0×10⁻⁷m2s−2. Since this value generally underestimates the energy flux derived from observations in shal-lower waters (Axell,1998), α has been increased to 1.5×10⁻⁶m2s−2in this work. The
5
long-term maintenance of the water column structure was instead provided by adding a Newtonian damping to a climatological profile of salinity with a relaxation time scale (RTS) of 90 d (see also Sect. 4.1). Finally, to parameterise the effects of freshwater inputs, surface salinity data from BED were assimilated in the first level of the model with a simple nudging scheme and a time constant of 8 d.
10
The model was initialised with winter average conditions for temperature salinity, nu-trients and oxygen from BED. The pelagic variables were initialised with homogeneous conditions in the vertical.
3.2. Atmospheric deposition and river loads
The chemical compounds considered important for the marine environment that can
15
also be deposited by atmospheric processes are mostly nitrogen and phosphorus. The information concerning these inputs in the Baltic sea are annual budgets at basin-level for phosphorus (HELCOM, 1987, 6000–7000 tons) and monthly wet atmospheric ni-trogen deposition with a 1 by 1 degree spatial resolution (L. Grannat, Stockholm Uni-versity, collected in the framework of the BASYS project). Since the known amount
20
of phosphorus deposition does not have any temporal or spatial distribution, it was decided to neglect this term and only include the nitrogen deposition as an external forcing function. These data are spatially and temporally resolved, and higher fre-quency deposition information can be deduced from precipitation data in the BASYS database. The monthly wet deposition was divided by the total monthly precipitation
25
and the resulting deposition per unit of precipitation was multiplied by the amount of precipitation every 12 hours. Scaling this value to the day, gives an estimate of the de-position flux of nitrate and ammonium (both in mmol N m−2d−1) with a 12 h frequency
BGD
1, 219–274, 2004
Model of the open Baltic biogeochemistry M. Vichi et al. Title Page Abstract Introduction Conclusions References Tables Figures J I J I Back Close Full Screen / Esc
Print Version Interactive Discussion
© EGU 2004
for the Bornholm area. A background rate was also considered to account for the dry deposition flux. This is a constant fraction that may range from 5 to 20% of the wet deposition, and was set to 20%.
The inclusion of river loads to the Baltic Proper was done taking a very simplistic approach. The total nutrient loads to the Baltic Proper were estimated from monthly
5
data over the period 1979–1990 (St ˚alnacke et al., 1998). The available information concerns the input of inorganic P as phosphate, inorganic N as nitrate plus nitrite, inorganic Si as silicate and the total P and N loads. The organic P and N fractions were estimated as the difference between the total load and the inorganic part. The surface flux was obtained dividing by the total surface of the Baltic Proper (HELCOM,
10
1987, 211 069 Km2) and by the number of days in each month. An estimate of the input of organic carbon related to the load of organic N and P is necessary to balance the organic matter input. A Redfield ratio with the N-component was assumed, as this gives the higher absolute amount of POC due to the N-enriched characteristic of the organic inflows.
15
There are several uncertainties connected to the assessment and practical use of nutrient load measurements, and this issue is further discussed in Sect.6with a sensi-tivity analysis on different combinations of the external nutrient loads. For the reference experiments shown in the next section it was decided to use a minimal set of the ex-ternal inputs, consisting of the atmospheric loads and only the organic fraction of the
20
river inputs. It is assumed that, within the limits of the data themselves, these forcings provide a lower bound for the supply of external nutrients to the Bornholm basin.
4. Simulation results
4.1. Water column structure
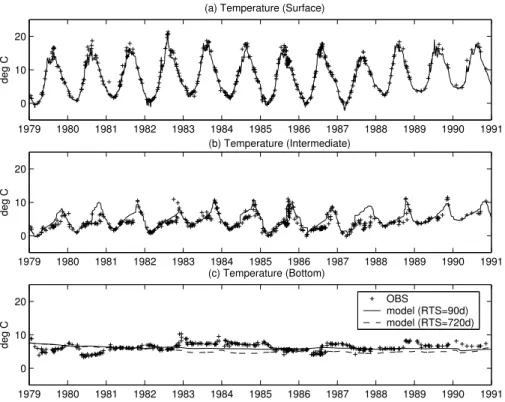
Figure4shows the model results for temperature compared with the BED data at the
25
tem-BGD
1, 219–274, 2004
Model of the open Baltic biogeochemistry M. Vichi et al. Title Page Abstract Introduction Conclusions References Tables Figures J I J I Back Close Full Screen / Esc
Print Version Interactive Discussion
© EGU 2004
perature is in near-perfect agreement with the observations. Also the warming trend in the winter minima from the beginning of 1988 is perfectly matched by the model. Such good results indicate that the empirical formulations used to compute the surface fluxes from the meteorological data are appropriate for this basin, and that the time evolution of the SST is completely determined by the exchanges at the surface. Deeper in the
5
water column (40 m depth, Fig.4b), the model generally overestimates the heating in the BIW. Particularly in 1980–1981 and 1987 the model predicts temperatures higher than the observed ones in spring and summer but the overall annual variability is sat-isfactorily reproduced, especially in the last years of the simulation. There are periods in which the BBW remains warmer because of the buoyancy flux connected to the
10
presence of denser waters from the Sound, and this feature lasts throughout more en-ergetic mixing periods as in winter 1986–1987. The model failure in reproducing this variability of the bottom temperature evolution can thus be explained by the absence of the horizontal entrainment of deep saltier waters, indirectly highlighting the basin-scale nature of this phenomenon.
15
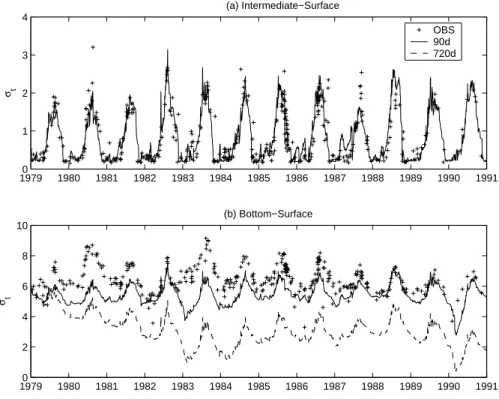
The three-layered structure of the Baltic Proper and its annual variation is confirmed in Fig.5by means of the density difference between the surface and the intermediate and bottom layers. The seasonal variability of the thermocline is evident and there is a clear separation of the BSW and BIW generally lasting from May to middle October. The model is rather good in reproducing the observed stratification, particularly
show-20
ing the difference between the less stratified period 1979–1981 and the presence of more stable conditions in 1982–1986. A remark was already made for the year 1987 in the temperature, and this is even more visible here in the density difference. The model is less satisfactory in the simulation of the variability of the permanent pycno-cline (Fig.5b). The initial adjustment to the surface forcings leads to a progressive loss
25
of the vertical structure that is recovered only in the last years. The extent of the winter erosion is well-matched but the spring-summer maxima are underestimated, indicating an underpredicted stratification between the BIW and the BBW.
BGD
1, 219–274, 2004
Model of the open Baltic biogeochemistry M. Vichi et al. Title Page Abstract Introduction Conclusions References Tables Figures J I J I Back Close Full Screen / Esc
Print Version Interactive Discussion
© EGU 2004
with a deep mixing that is also observed in 1990–1991 but missed in 1983 where the model and the observations diverge. As seen in the temperature as well, this mixing injected warm waters in the BBW that lasted three years because the stability was preserved by the presence of bottom denser waters. This feature highlights the 3-D structure of the BBW, which can only be partly accounted for with the parameterised
5
damping to a climatological salinity profile. In particular, Figs. 4c and 5b show the results of a sensitivity analysis on the value of the relaxation time scale to this climato-logical profile (RTS, from 90 d to 720 d). While the BSW and BIW are not particularly affected by this parameter, the results in the BBW show that a relatively short time scale is necessary to control the density drift. On the other hand, this strong relaxation
10
partially dampens the winter erosion of the pycnocline and therefore underestimates the winter supply of nutrients to the BSW as shown in the next section.
4.2. Hydrochemistry
Due to a lack of long-term measurements of gross primary production and community respiration, the only (indirect) information available to compare the model behaviour
15
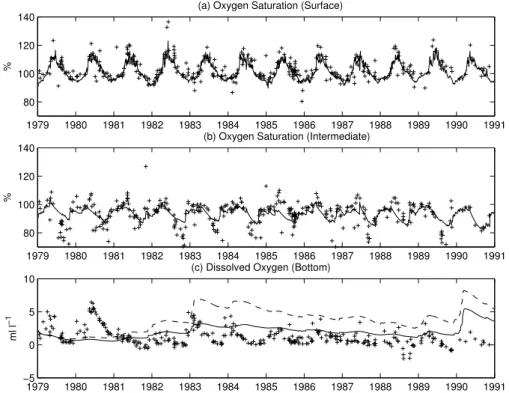
with system-level biological activity at the decadal time scale is oxygen saturation. Fig-ure6shows that the model is in good accordance with the data over the full 12 years’ period, especially in describing the timing of oversaturated conditions at the surface which reflects net community production. Oxygen in the BIW (Fig. 6b) is character-ized by a clear seasonal signal with undersaturation troughs reaching values of 70% or
20
lower and episodes of oversaturation (especially in 1981 and 1985–1988). This sea-sonal variability is only partially matched by the model, which does capture the variation but with a reduced range of amplitudes. Particularly, the data hint at higher levels of primary production during summer with a sharp late-summer start of the consumption processes that cease with the breaking of the thermocline in October. Deeper in the
25
BBW, the 1-D model has almost no seasonal variability and cannot simulate the ven-tilation due to horizontal processes such as the 1980 event, although it captures the long-term dampening of the seasonal variation due to the persistence of the
stagna-BGD
1, 219–274, 2004
Model of the open Baltic biogeochemistry M. Vichi et al. Title Page Abstract Introduction Conclusions References Tables Figures J I J I Back Close Full Screen / Esc
Print Version Interactive Discussion
© EGU 2004
tion conditions. Clearly, the model does identify that portion of the variance which is driven by vertical processes, as for example in winter 1982–1983 and in 1990 (see also Fig.5). With a large RTS, the seasonal ventilation is enhanced in these specific years (Fig.6c), but interestingly, the long-term decrease rate in the bottom oxygen concen-tration is also higher. This is explained by the simultaneous increase of organic matter
5
supply due to the larger availability of N in the surface layer as shown in Fig.7. In fact, with the slow relaxation the organic matter flux is about 10% larger and the sediment oxygen demand increases by about 25% on average.
Figure7shows the comparison between observations and model results for nitrate. The hindcasting of nitrate time distribution is satisfactory at the surface but fails in the
10
intermediate and bottom layers where the model predicts an overall accumulation of this compound (Figs. 7b, c). The observations suggest that nitrate levels are low in early-summer in the BIW, probably due to a continuation of the production phase (also suggested by the persistence of oxygen saturation, Fig. 6b). In the BIW the model gives a correct winter replenishment but fails in maintaining low summer
concentra-15
tions. After the spring bloom, the simulated BIW concentration increases because of local remineralisation of ammonium (not shown), and the eventual nitrification leads to an accumulation of (unutilised) nitrate. Inorganic N accumulates in the BIW until the autumn break-up of the seasonal thermocline. This discrepancy indicates the ab-sence of some important processes in the model formulation and is further discussed
20
in Sect.5. Nitrate in the BBW has a large variability without an evident seasonal sig-nal. Due to the complex array of N-transformations in the sediments (Herbert,1999), it is likely that the observations reflect local processes of ammonification and coupled nitrification-denitrification. However the model predicts a clear accumulation which may be linked to the over-predicted oxic conditions with respect to the observations and thus
25
to reduced denitrification. The average denitrification rate in the simulated sediments is 0.14 mmol N m−2d−1with autumn peaks of 0.2 in the run with RTS=720 d. Reported values from the Gulf of Finland and the Gulf of Bothnia range from 0 to 0.95 (Tuominen
con-BGD
1, 219–274, 2004
Model of the open Baltic biogeochemistry M. Vichi et al. Title Page Abstract Introduction Conclusions References Tables Figures J I J I Back Close Full Screen / Esc
Print Version Interactive Discussion
© EGU 2004
nected to both the organic matter supply and the activity of the benthos. Simultaneous masurements of sedimentation (rates and quality) and denitrification rate are there-fore necessary, because it is difficult to assess whether the low denitrification predicted by the model is due to a lower supply of organic particles or to incorrect parameter settings.
5
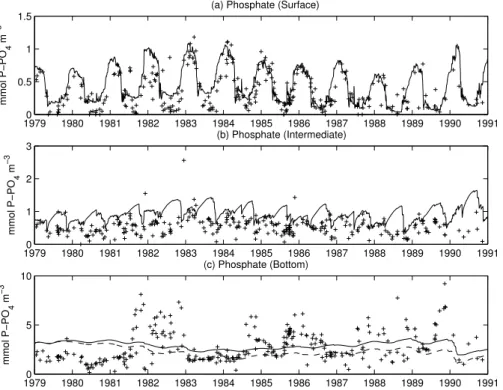
The model is valuable in explaining the winter replenishment of phosphate as a con-sequence of the deep mixing (Fig.8). However, the major feature is the mismatch at the surface during the summer periods. The modelled summer phytoplankton in the BSW has very low N:C internal ratios, limiting the biomass production and therefore the uptake of phosphate with consequent accumulation of PO4. Only in the last three
10
years, the progressive increase of N in the BIW leads to a balancing of the nutrient sup-ply to the surface layers during summertime. The overestimation of P-content is also evident in the BIW (8b), where the model behaves similarly as for N-species (7b). The simulation predicts a summer increase in contrast with an observed decay, although the seasonal pattern is less clear than in the case of nitrate. Interestingly, the model
15
reasonably explains the background evolution of the bottom concentration especially after 1983. The peak events cannot be simulated by the model and are apparently not correlated to the inflows of dense waters from the Arkona Basin (Sect. 4.1). Never-theless, the model gives indications that the bottom concentration is linked to the oxic conditions, because the ventilation event in 1983 leads to lower PO4 concentration
20
when the deep stratification is less constrained as in the RTS=720 d run (8c).
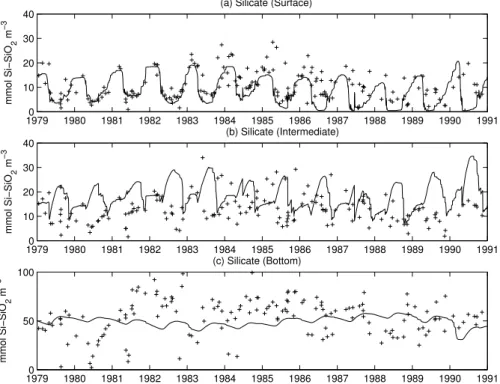
The dynamics of silicates are shown in Fig. 9. This nutrient is considered to be non-limiting for diatoms in the Baltic Proper, because distinct concentrations remain in the surface layer also during the spring/summer period (HELCOM,1996). The model, especially in the first 5 years is in good agreement with data but shows a deepening
25
of the spring troughs in the second half of the simulation period. Data in this period are more scattered and it is difficult to assess whether this trend is realistic. In the model, this spring consumption is due to the increased availability of N-compounds that enhance diatom blooms and thus the uptake of silicate. In addition, these results
BGD
1, 219–274, 2004
Model of the open Baltic biogeochemistry M. Vichi et al. Title Page Abstract Introduction Conclusions References Tables Figures J I J I Back Close Full Screen / Esc
Print Version Interactive Discussion
© EGU 2004
have been obtained after the introduction of a first-order dissolution rate of the biogenic silica in the water (0.1 d−1). This term needs to be further investigated and supported by measurements of the realistic dissolution rates, but, nevertheless, judging from the model, it seems to be a necessary process for a proper simulation of the near-surface silicate dynamics.
5
4.3. Chlorophyll and phytoplankton
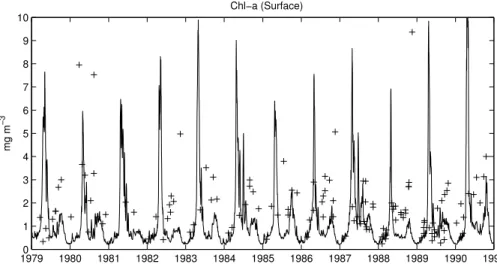
As reported in the assessments of the Helsinki Commission (HELCOM,1990,1996), the Bornholm basin and the southern Baltic Proper in general, normally shows three phytoplankton peaks in the year, a sharp spring peak, a smaller summer peak and a relatively higher one with a larger time extension in autumn (Hagstr ¨om et al., 2001).
10
However, as depicted in Fig. 10, the scattering of the Chl-a data makes it difficult to identify a clear succession in the phytoplankton or even the presence of a distinct spring peak. The data suggest that the phytoplankton standing stocks are more abun-dant in summer than the values simulated by the model. Part of this discrepancy could be explained by the simplified parameterisation used for Chl in the model, which is a
15
simple linear function of the C-content. A new parameterisation of prognostic Chl syn-thesis in the cells, based on the work byGeider et al. (1998), has been prepared and could lead to improvements in the simulation of the summer period where phytoplank-ton has generally lower internal Chl:C ratios but high levels of Chl-specific primary production. The only evidence of summer blooms are in 1984 and 1987, the years
20
in which the density difference between the BSW and BIW is reduced either in time (1984) or in amplitude (1987, see Fig.5). This indicates that the short-term variability of physical processes can be an important source of nutrients for the BSW that can enhance summer productivity in some specific years.
The monthly mean values of the phytoplankton succession are shown in Fig. 11.
25
The model predicts a spring bloom mainly composed of diatoms and flagellates in agreement with the observations (HELCOM,1990;Nommann and Kaasik,1992). An interesting finding is that the summertime biomass can be maintained only by including
BGD
1, 219–274, 2004
Model of the open Baltic biogeochemistry M. Vichi et al. Title Page Abstract Introduction Conclusions References Tables Figures J I J I Back Close Full Screen / Esc
Print Version Interactive Discussion
© EGU 2004
a functional group like state variable Pi(4) (Fig.2). So far, model results suggest that a sufficient condition for summer dominance of a specific phytoplankton group is a combination of slow growth rates and low predation rates, which is the parameterized functional strategy of group Pi(4)in the model.
HELCOM(1990) reports that autumn peaks in the Bornholm basin are mainly
com-5
posed of diatoms, with a small presence of flagellates. The model instead shows a persistence of summer species especially in September. When nutrients become avail-able at the thermocline break-up, this group has attained a large standing stock which partially retards the diatom development. The role of picophytoplankton should also be investigated in more detail and with the aid of some specific observations. Model
10
results show a strong persistence of this group under almost all seasonal conditions because of the competitive ecological functionalities parameterised in the model (fast growth rates, low light limitation and only one predator, the heterotrophic flagellates). Although some observations give indications of early blooms of the smaller autotrophic plankton (Nommann and Kaasik, 1992), this behavior needs to be further supported
15
by more accurate information.
5. Discussion and process-oriented experiments
Despite the limitation of direct model-data comparisons by means of compilations of sparse biological data, it has been shown that the processes implemented in the model can explain a reasonable portion of the biogeochemistry of the system. Particularly,
20
the agreement of the oxygen simulation confirms the model skills in reproducing the seasonality of the production periods and the overall biological variability in the long term.
Nevertheless, some mechanisms related to nutrient recycling in the BSW and the fate of the organic matter in the BIW need further investigation. Notwithstanding the
25
BGD
1, 219–274, 2004
Model of the open Baltic biogeochemistry M. Vichi et al. Title Page Abstract Introduction Conclusions References Tables Figures J I J I Back Close Full Screen / Esc
Print Version Interactive Discussion
© EGU 2004
next section, the results shown previously indicate an excess of P with respect to N in the surface layer (Fig.8a) and an accumulation of inorganic nutrients above the pycno-cline in the summer period (Figs.7,8and9, panel b). The former occurs in spite of the high N:P ratio in the river input, implying that N is removed faster than P in the mod-elled BSW. Data indicate a more intense summer production which would require the
5
availability of additional sources of N. However, these sources cannot be traced from concentration measurements, especially whether they are from diffusion across the thermocline, local regeneration in the euphotic zone or bacterial N-fixation, given that distinct summer blooms of cyanobacteria are observed in the Bornholm basin (
HEL-COM,1996). On the other hand, the nutrient accumulation in the BIW apparently has
10
no direct effect on the winter pool of nutrients in the model because the breaking of the thermocline restores the observed concentration (Fig.7b), but might have implications for the developments next spring due to the autumn production phase. Thomas et al.
(2003a) have suggested that the BIW acts as a buffer for N, contributing to the winter
maxima with this additional source. The suggested mechanism, derived from the
anal-15
ysis of NO3profiles in the Baltic Proper, implies that the entrapped N is both a residual after the spring bloom and/or a mineralisation product of the organic matter produced in spring (Thomas et al.,1999).
Model results indicated mineralisation in the BIW to be the major driver, even if the predicted rates apparently are too high. At the same time, a too slow recycling is
proba-20
bly occurring in the BSW. Both processes are not clearly supported by the observations and the question arises whether the model is overestimating nutrient mineralisation or the data have an insufficient time resolution to reveal the nutrient dynamics. The an-swer to this question implies a review of our understanding of the (re)cycling times of organic matter in the different physical layers. The spring bloom and the nutrient
draw-25
down are satisfactorily modelled, but this model (as most of the deterministic ecosys-tem models) has substantial approximations in parameterising the subtle processes that link organic matter to the local biogeochemical transformations, thus either mak-ing nutrient preferentially recycled in situ, or leadmak-ing to its sinkmak-ing to the benthic pools,
BGD
1, 219–274, 2004
Model of the open Baltic biogeochemistry M. Vichi et al. Title Page Abstract Introduction Conclusions References Tables Figures J I J I Back Close Full Screen / Esc
Print Version Interactive Discussion
© EGU 2004
and hence introducing a further time lag in the re-supply of mineralisation products. This section presents the results of two additional process-oriented simulations that were performed by modifying the structure of the model (cf. details in the Appendix). The changes involved the introduction of a fast-sinking detritus component and a refor-mulation of the parameterisations for phytoplankton and bacteria in order to explicitely
5
include the excretion of polysaccharides and their utilisation within the microbial loop. The latter reparameterisation was derived from a specific model application to a set of mesocosm experiments (Ruardij et al., submitted, 20041). The results of these addi-tional simulations were then compared with the reference run presented in the previ-ous section (see Table1for the names and a summary of the experiments discussed
10
herein).
The rationale for the addition of another detritus variable is the following. The spring bloom is dominated mainly by diatoms and this should enhance that part of the ma-rine food web composed of large zooplankters leading to high sedimentation rates
(Hagstr ¨om et al.,2001). The standard ERSEM assumes that particulate detritus sinks
15
with an average velocity of 1.5 m d−1, disregarding the origin of the detritus itself. How-ever, faecal pellets have a high sinking velocity due to their density being much higher than the average one of organic substrate. Therefore, in run B2, it is prescribed that all mesozooplankton egestion is directed to this new component (Ri(8)in Fig.2) which has a faster sinking rate (5 m d−1) and is not available as substrate for bacterioplankton in
20
the pelagic environment.
The parameterisation used in run B3, instead, has the same fast-sinking detri-tus but also includes two other fractions of the dissolved organic matter complex (DOM), polysaccharides and less-degradable carbohydrates (Rc(2) and Rc(7) in Fig. 2, respectively). Sugars are now excreted when phytoplankton cannot equilibrate fixed C
25
1
Ruardij, P., Veldhuis, M., and Brussaard, C.: Modelling bloom dynamics of the polymorphic phytoplankter Phaeocystis globosa: impact of grazers and virus, Harmful Algae, submitted, 2004.
BGD
1, 219–274, 2004
Model of the open Baltic biogeochemistry M. Vichi et al. Title Page Abstract Introduction Conclusions References Tables Figures J I J I Back Close Full Screen / Esc
Print Version Interactive Discussion
© EGU 2004
with sufficient nutrients to maintain the minimum quotum for the survival of the cells. This mechanism is different from the previous parameterisation (Baretta-Bekker et al.,
1997;Vichi,2002) where cell lysis was increased when phytoplankton had low
nutri-ent:carbon ratios, which led not only to an extra release of C-enriched DOM but also to a decrease of the population biomass. In addition, the dynamics of bacteria, which
5
already were improved with respect to ERSEM II by including the explicit dynamics of DOM (Vichi et al.,2003), was further modified to include the uptake of sugars and the release of less-degradable carbohydrates (see Appendix).
It is expected that these parameterisations on the one hand enhance the mineralisa-tion processes in the BSW leading to an increase of summer phytoplankton biomass,
10
and on the other hand, reduce the residence time of detritus in the BIW slowing down the recycling time.
5.1. Surface layers
Figure 12 illustrates the model trajectories compared with the surface data for phos-phate and ammonium for the period 1983–1984. Runs B1 and B2 are quite similar,
15
indicating that the faster removal of detritus from the surface does not have particular effects on the nutrient concentrations. This is particularly true for PO4, while the am-monium winter replenishment is reduced in run B2. The modified parameterisation of phytoplankton and bacteria brings the simulated phosphate much closer to the obser-vations. This is due to the much larger presence of ammonium (Fig.12b) that is used
20
to increase the early-summer phytoplankton biomass and thus reducing the excess of PO4. It is interesting to notice the time-shift between the model prediction and the smoothed envelope of the observations. The depletion of nutrients is earlier by about one month in the model and the same occurs for the autumn-winter replenishment, hinting at the need to refine the light utilisation processes that mostly control the
start-25
ing of the bloom. Additional sensitivity experiments have shown that it is not sufficient just to adjust the minimum optimal light for phytoplankton growth (cf.Ebenh ¨oh et al.,
implica-BGD
1, 219–274, 2004
Model of the open Baltic biogeochemistry M. Vichi et al. Title Page Abstract Introduction Conclusions References Tables Figures J I J I Back Close Full Screen / Esc
Print Version Interactive Discussion
© EGU 2004
tions in the development of the autumn bloom that is considerably reduced. It is rather the light-acclimation mechanism that needs to be refined, therefore it is expected that the planned inclusion of explicit Chl synthesis will improve the results.
The description of the ammonium dynamics is rather complicated. It is striking how much N can be made available in the surface layer by assuming a different formulation
5
of the phytoplankton internal dynamics. The data show a sort of bimodal dynamics through the year with a rather puzzling absence of a winter maximum. The first peak is found in February–April and the second one in August–October. The model generally overestimates the observations that are, however, rather sparse to give an indication of the real evolution. Moreover, the model considers as ammonium all the excretion
prod-10
ucts from micro- and mesozooplankton, which are mostly in the form of urea. Indeed, observations’ inventories generally underestimate the bioavailability of N because this component is usually not included. Yet urea has been proved to be an important direct source of N for coastal phytoplankton in the northern Baltic (Tamminen and Irmisch,
1996), and it is likely that it is relevant also in the regenerated phase of plankton
suc-15
cession in the open sea. 5.2. Intermediate layers
Model behaviour in the BIW is not much improved by the extensions. The paradox of a lower oxygen consumption with an apparent absence of N mineralisation is still present both in runs B2 and B3, as shown for the period 1986–1987 in Fig.13. The addition of
20
fast-sinking detritus in run B2 further decreases the oxygen utilisation because more organic matter is exported to the bottom layers and the biological oxygen demand is re-duced. Although this has the desired effect of reducing summer NO3concentrations in the BIW, it also has as a consequence the diminishment of the winter supply (Fig.13b), and hence of the spring phytoplankton biomass. The model gives indications that in
25
a permanently stratified system like the Baltic Proper the differential sinking velocity of the organic particles may play a major role in determining the winter levels of nutri-ents. The process simulated here represents an upper limit of the recycling time-lag,
BGD
1, 219–274, 2004
Model of the open Baltic biogeochemistry M. Vichi et al. Title Page Abstract Introduction Conclusions References Tables Figures J I J I Back Close Full Screen / Esc
Print Version Interactive Discussion
© EGU 2004
because it was assumed that feacal pellets are not remineralised while sinking but only in the benthic system.
Run B3, which also includes fast-sinking detritus, is instead more comparable with B1. This is due to an unforeseen feedback between production and consumption phases in the different layers. Since one of the major aspects of the B3
parameter-5
isation is to enhance the survival of phytoplankton cells at low nutrient concentrations, the surface layer has more biomass that reduces the light availability in this layer mak-ing it effectively less productive, reducing the oxygen to lower levels. This is a further indication that concentrations are not a good measure of the ongoing processes espe-cially when several linked mechanisms participate in the overall time-evolution.
10
It is nevertheless likely that summer remineralisation of N (first ammonification and then nitrification) is a realistic process in the BIW. Figure13b shows that considerable high concentrations of NO3 are observed prior to the breaking of the thermocline in middle October (this occurs several times in the time series but especially in 1986). The model, however, predicts that remineralisation starts when the stratification begins,
15
which is clearly contrasted by the observed late-summer oxygen minima and nutrient maxima.
A possible solution of this discrepancy involves a scenario that was not possible to reproduce with the model. Bacteria have been shown to compete with phytoplankon for inorganic nutrients in the Baltic surface waters (Zweifel et al., 1993) and this is
20
correctly simulated by the model in the summer period (not shown). In the BIW, bac-teria are instead net remineralisers of nutrients because the organic substrate has sufficient N and P content to sustain the bacteria population. Modelled bacteria are therefore carbon-limited, which contrasts with the large amount of DOC found in the Baltic Proper (Hagstr ¨om et al., 2001). Just a portion of this DOC is available to
bac-25
teria and the model assumes that this part is the more labile fraction produced during the spring-summer period. If bacteria were capable to degrade also a portion of the more refractory fraction, then they would also take up inorganic nutrients, increasing their respiration rate and delaying the remineralisation phase that then would be due
BGD
1, 219–274, 2004
Model of the open Baltic biogeochemistry M. Vichi et al. Title Page Abstract Introduction Conclusions References Tables Figures J I J I Back Close Full Screen / Esc
Print Version Interactive Discussion
© EGU 2004
mostly to heterotrophic flagellates. Additional measurements are therefore needed to assess the role of bacteriplankton in the BIW.
6. External input scenarios
In the Baltic scientific community there is a particular focus on the eutrophication ef-fects and the role of the input of allochtonous nutrients (Elmgren, 2001). Recently, a
5
nutrient load reduction experiment was performed with a three-dimensional ecosystem model of the Baltic Sea composed of nine biological state variables (Neumann et al.,
2002). This is an important step beyond 1-D models in order to have an appropriate description of all the hydrodynamical features and temporal developments that have to be parameterised in 1-D setups. However, a 3-D implementation is limited by
compu-10
tational requirements and generally requires the use of simplified biological processes especially for the benthic dynamics. Indeed,Neumann et al.(2002) found in the near bottom processes the largest discrepancies with the observations.
This section presents the response of the model to different scenarios of nutrient loads to the Baltic Proper. The 1-D setup allows to include more feedbacks between
15
the biological variable and, particularly, the response of a fully-resolved benthic system. However, care must be taken in the interpretation of results because of the uncertain-ties related to the parameterisation of river inputs in a 1-D model (see Sect.3.2).
The experiments are summarised in Table1and were performed with the B3 setup. The focus was on the effects of different ways to include the river nutrient loads, in
20
organic or inorganic form. In fact, the organic input is comparable to the contribution of inorganic nutrients and is mostly in the dissolved form (Stepanauskas et al.,2002). The distance from the sources and the transformations of dissolved nutrients into par-ticulate organic matter have to be taken into account. In order to consider this effect, it was assumed that the nutrient input from rivers is in the form of degradable particulate
25
detritus (Ri(6) variable in Fig. 2). One case prescribes that solely the organic fraction from rivers is available (reference run B3) and another case assumes that the total
nu-BGD
1, 219–274, 2004
Model of the open Baltic biogeochemistry M. Vichi et al. Title Page Abstract Introduction Conclusions References Tables Figures J I J I Back Close Full Screen / Esc
Print Version Interactive Discussion
© EGU 2004
trient load is supplied (B3-S1). Two more “extreme” experiments were also done: one without any additional source of nutrients (B3-S2) and one where it is assumed that the inorganic fraction from the river is not transformed in the coastal zone and reaches the open ocean (B3-S3). Atmospheric deposition of N is always included except for experiment B3-S2.
5
Figure14shows how nitrate in the BBW is affected by the external nutrient sources. The model predicts that, under identical physical conditions, nitrate accumulation in the BBW is a function of the quantity and composition of the external inputs as also speculated byThomas et al. (2003a). High inorganic N inputs as in B3-S3 lead to a large increase of the bottom concentration. If large amounts of both organic nitrogen
10
and carbon are simultaneously provided as in B3-S1, the system carrying capacity is exceeded and the organic matter is degraded in the benthic system leading to hypoxia and ultimately to denitrification. The absence of any external source leads to a long-term equilibrium of the bottom concentration, which is continuously maintained by the winter mixing, the small supply of organic matter and by the nitrification induced by the
15
favourable oxic conditions.
Correspondingly, the net primary production (NPP) increases as a function of the ex-ternal nutrient availability irrespective of the quality of inputs as summarised in Table2. The mean annual NPP integrated over the water column is maximum in the case of large inorganic river loads but also organic inputs alone can maintain elevated NPP. All
20
the values are within the range reported byHagstr ¨om et al. (2001) for the Bornholm basin (132–256 g C m−2y−1). NPP is instead considerably lower in the idealised no-inputs case and the system is in this case mostly sustained by the bacterial production (BP). BP is constant in all the experiments with an external nutrient supply and the ratio between the bacterial carbon demand and the total fixed carbon is also constant,
25
indicating that the metabolic response of bacterioplankton is probably more linked to the physical conditions and not to the autotrophic carbon.
However, the Net Ecosystem Production (NEP, net primary production minus het-erotrophic respiration) of a shallow basin is composed of the sum of pelagic and
ben-BGD
1, 219–274, 2004
Model of the open Baltic biogeochemistry M. Vichi et al. Title Page Abstract Introduction Conclusions References Tables Figures J I J I Back Close Full Screen / Esc
Print Version Interactive Discussion
© EGU 2004
thic metabolic processes, both considering the heterotrophic respiration terms. The time series of the average annual Net Community Productions (NEPs) over the 80 s are shown in Fig.15separated in benthic and pelagic contributions. It is interesting to notice that, the pelagic NCP is very low, as also reported in recent estimates (Gazeau
et al.,2004), and is always negative in run B3-S1 where the external inputs to the model
5
domain are considered to be in organic form. Pelagic NCP is maximum (or almost zero in B3-S1) in the period 1983–1985 when the nutrient supply from rivers is the highest. In spite of benthic heterotrophic respiration being low (only 5–8% of NPP is consumed there) this value is sufficient to change the total NEP to negative mean values (shown in brackets in Fig.15). Only in the B3-S2 experiment there is a net balance between
10
pelagic production and benthic consumption of organic carbon, indicating that without any additional source of nutrients the metabolic system state is adjusted towards a complete utilisation of the fixed carbon. In all the other experiments the average NEP is slightly negative (B3 and B3-S3) or even considerably negative when all the inputs are already in organic form.
15
Given that the average inflow of organic carbon from external sources, which is as-sumed to have a Redfield ratio with the organic N fraction (cf. Sect. 3.2), is about 0.8 mmol C m−2d−1, it turns out that the external input of organic matter regulates the behavior of the system towards being a sink for carbon. The input of inorganic nutri-ents as in B3-S3 is apparently not making the system more autotrophic, because the
20
total average NEP is still equal to B3, indicating that all the additional new production is processed below the halocline and finally in the benthic system.
7. Conclusions
The one-dimensional approach is able to explain a large portion of the variance ob-served in the open Baltic, particularly in the surface layers where the bulk of the
or-25
ganic matter production processes occur. The good agreement with the observed sur-face temperature indicates that the calculated heat and momentum fluxes are correct,
BGD
1, 219–274, 2004
Model of the open Baltic biogeochemistry M. Vichi et al. Title Page Abstract Introduction Conclusions References Tables Figures J I J I Back Close Full Screen / Esc
Print Version Interactive Discussion
© EGU 2004
and that the vertical mixing processes above the pycnocline are to some extent prop-erly represented. Comparative analyses of modelled hydrochemical components with respect to the independent BED observations have shown that the long-term system behaviour of the model remains internally consistent and within “likely” boundaries.
Yet some discrepancies with the observations highlight the presence of unresolved
5
mechanisms that limit the simulation of open Baltic biogeochemistry. Particularly, the model is less capable to hindcast hydrochemical data in the Baltic intermediate waters (BIW). The modifications in the structure of the model with respect to previous formu-lations (cf. Sect.5) have shown that the nutrient dynamics in the BIW is linked to the quality and dimensions of the organic matter produced in the euphotic zone and flowing
10
through this layer. This is a partial confirmation that the strategy of including more (al-though uncertain) interactions among the system components can increase the model skill in reproducing observations. Additional process-oriented experimental studies are needed to further clarify the effective bioavailability of the organic compounds and also the importance of light-acclimation of phytoplankton in these intermediate layers at the
15
limits of the euphotic zone.
Model results suggest that the Baltic Proper is a site where nutrient and carbon cycling are strongly uncoupled, and that there is an efficient preferential recycling of nutrients in the surface and intermediate waters, as also speculated byThomas et al.
(2003a). This recycling enhances both primary production but also heterotrophic
respi-20
ration, and the model indicates that most of the carbon produced in the euphotic zone is ultimately oxidised below the permanent halocline and in the benthic system. The ex-planation suggested by the model lies in the physical structure of the Baltic Proper: the production zone is separated from the (benthic) consumption zone by semi-permanent stratification as in the deep ocean, but because of the relatively shallow water column
25
the two regions are tightly connected by the sinking process. This process removes po-tential local sources of regenerated nutrients causing N-limitation in the surface layer but temporarely storing the organic matter in the BIW. Here the fate of the organic matter bifurcates: it is partly processed by the microbial foodweb leading to local
rem-BGD
1, 219–274, 2004
Model of the open Baltic biogeochemistry M. Vichi et al. Title Page Abstract Introduction Conclusions References Tables Figures J I J I Back Close Full Screen / Esc
Print Version Interactive Discussion
© EGU 2004
ineralisation and partly sinks down to below the halocline. Both mecanisms lead to heterotrophic consumption of organic matter with different time scales, and the quality of the organic substrate is indicated by the model as a possible discriminant.
The annual variability in the summer meteorological conditions can sometimes re-duce the separation between the BSW and the BIW, effectively supplying recycled
5
nutrients via turbulent diffusion and increasing net production as shown, for instance, in 1984 and 1987. Additional sources of N, however, are needed in the surface layer to increase the summer primary production and to bring it closer to the observations. The model suggests that slow-growing phytoplankton P(4)is favoured under these stratified conditions. These features they share with the filamentous cyanobacteria found in the
10
Baltic summer blooms (HELCOM,1996) apart from the ability to fix atmospheric nitro-gen, which is not implemented in the model. The simulated biomass of P(4) is lower in the period 1985–1988 as also reported for the filamentous cyanobacteria population in the Baltic Proper (Kahru, 1997; Neumann et al., 2002). Therefore model results support the idea that biological N-fixers are a possible temporary contribution to the
15
nitrogen supply in surface stratified waters (Larsson et al.,2001).
The organic matter exported to below the pycnocline is then consumed in the bottom layers and in the benthic system, which in the investigated period are almost perma-nently separated because of the persistent stagnation conditions. Given that NPP is within the observed range, the overall calculated biogeochemical fluxes predict a
sys-20
tem that is net source of inorganic carbon. This metabolic response is a function of the external sources of nutrients, both in organic and inorganic form. A logical conclusion from the analysis of the model results is that the input of anthropogenic nutrients moves the system towards a more heterotrophic state. Particularly, the input of organic loads tends to exacerbate the heterotrophic conditions. In addition, the model suggests that,
25
in the scenario without any allochtonous source of nutrients, the open Baltic has a bal-anced C budgets. Nitrogen accumulation is instead depending not just on the quantity but on the quality of anthropogenic inputs. The supply of inorganic N increases the storage of nitrate in the bottom layers, while the imput of organic N makes the
pic-BGD
1, 219–274, 2004
Model of the open Baltic biogeochemistry M. Vichi et al. Title Page Abstract Introduction Conclusions References Tables Figures J I J I Back Close Full Screen / Esc
Print Version Interactive Discussion
© EGU 2004
ture much more complicated, shifting the system from N accumulation to denitrification according to the annual variability of the stratification conditions.
It is likely that the different mechanisms and nutrient load scenarios that were anal-ysed separately with the model, in reality occur in combination, depending on the hy-drodynamical conditions. The coastal zone can be the transitional area that modifies
5
the freshwater sources which ultimately supply this open area. The computation of NEP is thus hampered by the uncertainties in the quantity and quality of the horizontal export fluxes through the model domain that are neglected in the 1-D approximation. A 3-D model is undoubtedly superior in resolving these dynamics, although the results obtained here with a 1-D model are comparable with the 3-D simulations byNeumann
10
et al. (2002) also in the physical evolution. In particular, the inclusion of a fully-resolved benthic system has shown to be an important process that regulates the time-evolution of the Baltic bottom water conditions. Despite the small mineralisation rates, the simu-lated benthic fluxes at the water sediments have a large impact on the entire oxic state and on the system behaviour as a source or sink of carbon. Therefore, direct
simulta-15
neous measurements of sedimentation rates of organic matter and sediment oxygen demand are needed to compare with and verify the results suggested by the model.
Appendix A Model equations
This Appendix describes the changes in the parameterisation of phytoplankton and
20
bacteria. The biological source terms solved in the standard ERSEM phytoplankton are gross primary production (gpp), respiration (rsp), exudation (exu), cell lysis (lys) and predation (prd). As detailed in Vichi (2002,http://docserver.bis.uni-oldenburg.de/
publikationen/dissertation/2002/vicpre02/vicpre02.html), there is an equation for any internal component of a generic phytoplankton group, Pi(z, t)≡(Pc, Pn, Pp, Ps). In each
25
BGD
1, 219–274, 2004
Model of the open Baltic biogeochemistry M. Vichi et al. Title Page Abstract Introduction Conclusions References Tables Figures J I J I Back Close Full Screen / Esc
Print Version Interactive Discussion
© EGU 2004
is shown in Fig.2and the parameter values and their complete description is available as additional material inhttp://www.copernicus.org/EGU/bg/bgd/1/219/bgd-1-219-sp1.
pdf. ∂Pc ∂t bi o = ∂Pc ∂t gpp O(3) − ∂Pc ∂t exu R(i )c − ∂Pc ∂t rsp O(3) − ∂Pc ∂t l ys Rc(i ) −X j ∂Pc ∂t prd Zc(j ) (A1) 5 ∂Pn ∂t bi o= ∂Pn ∂t upt N(3),N(4) − ∂Pn ∂t l ys Rn(i ) −Pn Pc X j ∂Pc ∂t prd Zc(j ) (A2) ∂Pp ∂t bi o = ∂Pp ∂t upt N(1) − ∂Pp ∂t l ys Rp(i ) −Pp Pc X j ∂Pc ∂t prd Zc(j ) (A3) ∂Ps ∂t bi o= ∂Ps ∂t upt N(5) − ∂Ps ∂t l ys Rs(6) −Ps Pc X j ∂Pc ∂t prd Zc(j ) (A4) if Ps = Ps(1), otherwise ∂Ps ∂t bi o = 0
The equations for bacterioplankton are written in a similar manner, including the
pro-10
cesses of bacterial carbon uptake (bcd) and the uptake or remineralisation of inorganic nutrients (upt/rel). Bacteria are assumed to have no release of organic matter, there-fore their loss terms are limited to respiration and predation.
∂Bc ∂t bi o = ∂Bc ∂t bcd Rc(i ) − ∂Bc ∂t rsp O(3) −X j ∂Bc ∂t prd Zc(j ) (A5) 15 ∂Bn ∂t bi o= Rn(i ) R(i ) ∂Bc ∂t bcd R(i ) + fn B ∂Bn ∂t upt,rel N(k) −Bn Bc X ∂Bc ∂t prd Z(j ) (A6)