HAL Id: hal-00301545
https://hal.archives-ouvertes.fr/hal-00301545
Submitted on 6 Dec 2004HAL is a multi-disciplinary open access
archive for the deposit and dissemination of sci-entific research documents, whether they are pub-lished or not. The documents may come from teaching and research institutions in France or abroad, or from public or private research centers.
L’archive ouverte pluridisciplinaire HAL, est destinée au dépôt et à la diffusion de documents scientifiques de niveau recherche, publiés ou non, émanant des établissements d’enseignement et de recherche français ou étrangers, des laboratoires publics ou privés.
Simulation of denitrification and ozone loss for the
Arctic winter 2002/2003
J.-U. Grooß, G. Günther, R. Müller, P. Konopka, S. Bausch, H. Schlager, C.
Voigt, C. M. Volk, G. C. Toon
To cite this version:
J.-U. Grooß, G. Günther, R. Müller, P. Konopka, S. Bausch, et al.. Simulation of denitrification and ozone loss for the Arctic winter 2002/2003. Atmospheric Chemistry and Physics Discussions, European Geosciences Union, 2004, 4 (6), pp.8069-8101. �hal-00301545�
ACPD
4, 8069–8101, 2004Denitrification and ozone loss for
2002/2003
J.-U. Grooß et al.
Title Page Abstract Introduction Conclusions References Tables Figures J I J I Back Close Full Screen / Esc
Print Version Interactive Discussion
EGU
Atmos. Chem. Phys. Discuss., 4, 8069–8101, 2004 www.atmos-chem-phys.org/acpd/4/8069/
SRef-ID: 1680-7375/acpd/2004-4-8069 European Geosciences Union
Atmospheric Chemistry and Physics Discussions
Simulation of denitrification and ozone
loss for the Arctic winter 2002/2003
J.-U. Grooß1, G. G ¨unther1, R. M ¨uller1, P. Konopka1, S. Bausch1, H. Schlager2, C. Voigt2, C. M. Volk3, and G. C. Toon4
1
Institut f ¨ur Chemie und Dynamik der Geosph ¨are I: Stratosph ¨are (ICG I), Forschungszentrum J ¨ulich, J ¨ulich, Germany
2
Institut f ¨ur Physik der Atmosph ¨are, DLR Oberpfaffenhofen, Germany
3
Institut f ¨ur Meteorologie und Geophysik, Universit ¨at Frankfurt, Germany
4
Jet Propulsion Laboratory, California Institute of Technology, Pasadena, CA, USA
Received: 21 October 2004 – Accepted: 22 October 2004 – Published: 6 December 2004 Correspondence to: J.-U. Grooß ([email protected])
ACPD
4, 8069–8101, 2004Denitrification and ozone loss for
2002/2003
J.-U. Grooß et al.
Title Page Abstract Introduction Conclusions References Tables Figures J I J I Back Close Full Screen / Esc
Print Version Interactive Discussion
EGU
Abstract
We present simulations with the Chemical Lagrangian Model of the Stratosphere (CLaMS) for the Arctic winter 2002/2003. We integrated a Lagrangian denitrification scheme into the three-dimensional version of CLaMS that calculates the growth and sedimentation of nitric acid trihydrate (NAT) particles along individual particle
trajecto-5
ries. From those, we derive the HNO3 downward flux resulting from different particle nucleation assumptions. The simulation results show a clear vertical redistribution of total inorganic nitrogen (NOy), with a maximum vortex average permanent NOyremoval of over 5 ppb in late December between 500 and 550 K and a corresponding increase of NOy of over 2 ppb below about 450 K. The simulated vertical redistribution of NOy
10
is compared with balloon observations by MkIV and in-situ observations from the high altitude aircraft Geophysica. Assuming a globally uniform NAT particle nucleation rate of 3.4·10−6cm−3 h−1in the model, the observed denitrification is well reproduced.
In the investigated winter 2002/2003, the denitrification has only moderate impact (≤10%) on the simulated vortex average ozone loss of about 1.1 ppm near the 460 K
15
level. At higher altitudes, above 600 K potential temperature, the simulations show significant ozone depletion through NOx-catalytic cycles due to the unusual early ex-posure of vortex air to sunlight.
1. Introduction
During the Arctic winter 2002/2003, an extensive coordinated US-European
measure-20
ment campaign (SOLVE II/VINTERSOL) was carried out to investigate a variety of open questions in polar stratospheric research. Within this campaign in-situ and re-mote measurements from balloons, high and low flying aircraft, satellite and ground stations were collected. Most measurements were preformed from Kiruna, Sweden (68◦N).
25
The winter 2002/2003 was characterized by extremely low temperatures in early 8070
ACPD
4, 8069–8101, 2004Denitrification and ozone loss for
2002/2003
J.-U. Grooß et al.
Title Page Abstract Introduction Conclusions References Tables Figures J I J I Back Close Full Screen / Esc
Print Version Interactive Discussion
EGU
winter (Naujokat and Grunow,2003;Tilmes et al.,2003) that are necessary for polar stratospheric cloud (PSC) formation. Around 18 November, the temperatures fell below the threshold temperature TNAT below which NAT (Nitric Acid Trihydrate) particles can exist (Hanson and Mauersberger,1988). In December there were record-large areas with temperatures below TNAT. During this time PSCs were observed both from ground
5
based LIDAR and from satellite (Spang et al.,2004). In mid-January, a major warming led to the rise of temperatures above TNATso that PSCs disappeared. In early February the vortex stabilized again and low temperatures necessary for PSC formation were present again for a few days. Finally the vortex broke down in late April.
In this study, we focus on the simulation of denitrification throughout the winter. The
10
importance of denitrification for polar stratospheric chemistry has been known for a long time (Fahey et al.,1990;Waibel et al.,1999). However, only in the last years the processes involved in denitrification have become clearer. In-situ observations of PSCs in the Arctic winter 1999/2000 (Fahey et al.,2001) have led to the discovery of large HNO3containing PSC particles up to 20 µm diameter with low number density of about
15
10−4cm−3. Due to this low number density, those particles can grow to large sizes within a few days, sediment and transport significant amounts of HNO3 downwards, consequently leading to denitrification (Carslaw et al.,2002).
In addition to the mode with low particle number density, smaller NAT particles at higher number densities of about 10−3cm−3have frequently been observed in the
Arc-20
tic stratosphere (Deshler et al.,2003;Larsen et al.,2004;Fahey et al.,2001). Because the settling velocity of a 3 µm diameter NAT particle is about 90 m per day on the 500 K level, the smaller particles do not sediment significantly. Instead, the growth of other NAT particles is reduced in the presence of such higher particle number densities be-cause those particles reduce the available HNO3in the gas phase due to uptake into
25
the particles until equilibrium between particles and gas phase is reached. At parti-cle number densities above 10−3cm−3, the equilibrium is reached within less than one day (B. Luo, personal communication, 2004). The vertical redistribution of HNO3due to the sedimentation of the large NAT particles has an important impact on stratospheric
ACPD
4, 8069–8101, 2004Denitrification and ozone loss for
2002/2003
J.-U. Grooß et al.
Title Page Abstract Introduction Conclusions References Tables Figures J I J I Back Close Full Screen / Esc
Print Version Interactive Discussion
EGU
chemistry. Firstly, the reactive surface and volume of the solid and liquid PSCs and indeed the threshold temperature for PSC existence depend on the available HNO3 in the gas phase. Secondly, a loss of HNO3 due to denitrification implies a slower in-crease of NOx (=NO+NO2) at a later time as HNO3 is the major reservoir of NOx. In the Arctic, the reaction of NO2with ClO is mainly responsible for the chlorine
deactiva-5
tion at the end of the PSC period. Thus, the vertical redistribution of HNO3 influences both chlorine activation and deactivation. Model simulations that aim at reproducing ozone realistically must therefore include a realistic denitrification scheme. The nu-cleation process of NAT particles at low number densities has not yet been identified. Larger number densities of NAT particles could nucleate on ice in lee-wave events (Luo
10
et al.,2003;Voigt et al.,2003;Carslaw et al.,2002). Recent observations (Voigt et al., in preparation, 20041;Larsen et al.,2004) show that NAT particles also form at short timescales of about one day at temperatures above the ice frost-point. Tabazadeh
et al. (2002) suggested a surface nucleation mechanism, but the nucleation rate must be more than an order of magnitude lower to explain the particle observations (Larsen
15
et al.,2004). Studies for the winter 1999/2000 use a globally uniform nucleation rate and achieve realistic denitrification (Carslaw et al.,2002;Mann et al.,2002,2003). The NAT nucleation rates derived from observations in the winter 2002/2003 (Larsen et al.,
2004, Voigt et al., in preparation, 20041) are higher compared to the uniform nucle-ation rate used by Carslaw et al. (2002) in their study of denitrification in the winter
20
1999/2000. Another approach to explain the large NAT particle mode employs a local-ized nucleation on ice particles at the bottom of a so-called mother cloud (Fueglistaler
et al.,2002). However, since observations show that NAT particles can nucleate with-out the mother cloud mechanism (Voigt et al., in preparation, 20041), we follow here the first assumption.
25 1
Voigt, C., Schlager, H., Luo, B., D ¨ornbrack, A., Roiger, A., Stock, P., Curtius, J., V ¨ossing, H., Borrmann, S., Konopka, P., Schiller, C., Shur, G., and Peter, T.: Detection of solid Polar Stratospheric Cloud (PSC) particles at threshold formation conditions, Atmos. Chem. Phys. Discuss., in preparation, 2004.
ACPD
4, 8069–8101, 2004Denitrification and ozone loss for
2002/2003
J.-U. Grooß et al.
Title Page Abstract Introduction Conclusions References Tables Figures J I J I Back Close Full Screen / Esc
Print Version Interactive Discussion
EGU
The remaining uncertainties especially with respect to the nucleation process cannot be resolved here. The aim of this study is to find combinations of parameters using the available knowledge of NAT nucleation that allow to simulate the observed denitrifica-tion.
2. Model description
5
Current chemistry transport model (CTM) simulations taking into account vertical NOy redistribution by sedimentation of large NAT particles use a combination of a La-grangian particle model with an Eulerian CTM (Carslaw et al.,2002;Mann et al.,2003). Here, we present simulations in which both the NAT particles and the chemistry are simulated in a Lagrangian way.
10
The Chemical Lagrangian Model of the Stratosphere (CLaMS) was initially devel-oped as a two-dimensional Lagrangian chemical transport model on isentropic sur-faces (McKenna et al., 2002a,b). Recently, it was further developed as a full three-dimensional model (Konopka et al.,2004a). In an earlier version of the model, deni-trification was parameterized in a way that only the loss of HNO3 is described with a
15
rate depending on the assumed size of the PSC particles (Grooß et al.,2002). For this study, we use a more realistic approach that takes into account the HNO3flux due to sedimenting large PSC particles and also considers the HNO3increase due to particle evaporation.
The calculation of growth and evaporation of large NAT particles is carried out
fol-20
lowing the procedure described in detail byCarslaw et al.(2002). The growth of each particle leads to a change of its sedimentation velocity, which is computed with a time-step of 30 min. All particles (hereafter called particle boxes, to emphasize the technical character of the term and to avoid misinterpretation and confusion) are advected hor-izontally on isentropic levels using the background wind fields. The vertical motion is
25
calculated using the sedimentation velocity only. The particle boxes are advected un-til the particles have evaporated completely. New particle boxes are nucleated every
ACPD
4, 8069–8101, 2004Denitrification and ozone loss for
2002/2003
J.-U. Grooß et al.
Title Page Abstract Introduction Conclusions References Tables Figures J I J I Back Close Full Screen / Esc
Print Version Interactive Discussion
EGU
24 h within 22 isentropic layers between 400 and 700 K north of 50◦N at locations with T<TNAT with a mean distance of 100 km, the density of particle boxes being a factor of about 4 higher than the density of the CLaMS air parcels for which the chemistry is calculated. This was done to assure that in areas where particle boxes occur, all CLaMS air parcels have the chance to interact with at least one particle box.
5
Each particle box represents a much higher number of real atmospheric particles to keep the number of simulated particle boxes computationally manageable. Similar to
Carslaw et al.(2002), a scaling factor in form of a number density is applied during the interaction between the particle boxes and the background chemistry. An effective nu-cleation rate can be calculated from the product of the number density of atmospheric
10
particles in the newly added particle boxes and the ratio of the particle boxes and the air parcels, divided by the CLaMS time step (24 h).
The interaction between the particle boxes and the background chemistry is man-aged by first determining the three nearest neighboring air parcels within the layers above and below the current position of every particle box, thus creating a polyhedron
15
containing the particle box. Nitric acid and water vapor being taken up or released during growth or evaporation, respectively, are then taken from or added to these six nearest air parcels using a distance depending weight. The impact of the interaction between particle boxes and air parcels is then determined by assigning a particle num-ber density (the above mentioned scaling factor) to each particle box to compute the
20
exchange of nitric acid and water vapor.
In this context it should be noted, that the density of the air parcels within each isen-tropic layer are not conserved during the simulation due to the properties of the mixing algorithm. This was also taken into account when calculating the mass exchange be-tween CLaMS air parcels and particle boxes by applying an appropriate correction
25
factor.
In sensitivity simulations, we changed the nucleation rate in the model to investigate its impact on the resulting denitrification. In the standard case, we use a constant ef-fective nucleation rate of 3.4·10−6cm−3h−1at all locations where T<TNAT, comparable
ACPD
4, 8069–8101, 2004Denitrification and ozone loss for
2002/2003
J.-U. Grooß et al.
Title Page Abstract Introduction Conclusions References Tables Figures J I J I Back Close Full Screen / Esc
Print Version Interactive Discussion
EGU
to the nucleation rate derived by Carslaw et al.(2002) for the winter 1999/2000, be-cause this results in the best comparison with the observations (see below). This is about a factor of 2.3 lower than the rate reported by Voigt et al. (in preparation, 20041) and a factor of 7.3 lower than the rate suggested by Larsen et al.(2004). Therefore, we performed sensitivity studies by changing the NAT nucleation rate to investigate its
5
impact on denitrification.
The mode with high particle number density was not generated by the sedimentation scheme. To achieve this mode we used the microphysics module already implemented in CLaMS (Carslaw et al., 1995; McKenna et al., 2002b), in which a particle mode with given number density (here: 0.003 cm−3) can nucleate upon cooling from liquid
10
aerosol at a certain supersaturation with respect to NAT or from sulfuric acid tetrahy-drate (SAT). This critical supersaturation of HNO3over NAT was varied from 10 to 100 and was set to 30 in the reference simulation corresponding to a temperature about 5 K below TNAT. NAT formation from SAT is possible in this scheme but is not allowed in the reference simulation. Sedimentation of this mode is not considered. Therefore
15
there are 3 possibilities to change the denitrification parameterization: A change of the rate of nucleation for the mode with low particle density, a change of the critical super-saturation to form the mode with high particle density, or a change whether or not NAT particles can form on SAT upon cooling. The SAT particles in the last case originate from previously evaporated NAT particles.
20
In the current simulation we use a horizontal resolution of 150 km in the area north of 40◦N and 400 km between the equator and 40◦N for the air parcels. The vertical model domain is between 350 and 900 K potential temperature divided into 21 levels. A simulation with higher resolution (100 km horizontal, 30 levels) was also performed to investigate some model resolution issues. Due to the high numerical costs, this
25
ACPD
4, 8069–8101, 2004Denitrification and ozone loss for
2002/2003
J.-U. Grooß et al.
Title Page Abstract Introduction Conclusions References Tables Figures J I J I Back Close Full Screen / Esc
Print Version Interactive Discussion
EGU
3. Initialization and boundary conditions
The presented CLaMS simulation was started for 17 November 2002 to ensure that it starts before the onset of PSC formation that is also the begin of denitrification. The chemical composition of the air parcels in the model domain was derived differently for the individual chemical species depending on the available data.
5
The initialization of O3 was based on the MIPAS-ENVISAT data from 16 and 17 November 2002. Here, we used the near-real-time data version of the MIPAS data provided by the European Space Agency (ESA). Data profiles for which the retrieval is potentially disturbed due to PSCs are excluded from the data set using the cloud index defined bySpang et al.(2004). From the observation locations and times trajectories
10
on 19 isentropic levels between 350 and 2000 K were started to determine the locations of the observed air masses at the synoptic time 17 November 12 UT. These data then were gridded onto a regular 2◦×6◦ latitude-longitude grid on each level. Points within 440 km distance of a grid point contributed to it with different weights taking into account its distance and its given relative accuracy. CH4 was initialized using HALOE satellite
15
and MkIV balloon data. Since HALOE observations (Russell et al.,1993) are available much less frequently than MIPAS data, a different method and a longer time interval was used. The HALOE CH4 observations of November and December 2002 were averaged into equivalent latitude bins on the different isentropic levels. Since HALOE did barely sample the vortex during this time the data were combined with vortex CH4
20
observations on 16 December 2002 obtained by MkIV (Toon et al.,1999). Correlations of CH4 with other compounds (N2O, Cly, Bry) were used as in Grooß et al. (2002), with the exception that Bry was increased by 10% to maximum mixing ratios of about 20 ppt. Total reactive nitrogen (NOy) was initialized using the correlation with N2O given byPopp et al.(2001). For air parcels with N2O mixing ratios between 1 and 33 ppb the
25
correlation was extended here on the basis of the same data (MkIV balloon profile in December 1999) using the following correlation:
[NOy]= 11.7 + 4.49 · ln [N2O] − 0.948 · (ln [N2O])2, (1) 8076
ACPD
4, 8069–8101, 2004Denitrification and ozone loss for
2002/2003
J.-U. Grooß et al.
Title Page Abstract Introduction Conclusions References Tables Figures J I J I Back Close Full Screen / Esc
Print Version Interactive Discussion
EGU
where NOyand N2O mixing ratios are given in ppb.
The sulfate background aerosol in the model is given as H2SO4equivalent gas phase mixing ratio. Its altitude dependence (given in ppb) was derived from a detailed study (Bausch et al., manuscript in preparation) to be
[H2SO4]= 1.21 · 10−8θ3− 3.67 · 10−5θ2+ 2.96 · 10−2θ− 7.97, (2)
5
for the potential temperature range 450 K≤θ≤900 K. At the lower and upper boundary of the model domain (350 and 900 K), also the chemical composition of the air parcels was prescribed derived in a similar way from the satellite data.
Similar as the initialization, the boundary conditions at upper and lower boundary of the model domain were determined. At the upper boundary (900 K), ENVISAT-MIPAS
10
data for O3and CH4were averaged over equivalent latitude bins for the simulation time every half month within 5 days. From that data, the same correlations as above were used to determine N2O, Cly, Bry, and NOy. Species not mentioned and the partitioning within the families were taken from the Mainz 2-D photochemical model (Grooß,1996). Also the lower boundary composition at 350 K was taken from that model.
15
The ozone mixing ratio needed for the radiative transfer code (Becker et al.,2000) that determines the photolysis rates has been taken from a climatology based on HALOE measurements as function of latitude, pressure and month (Russell et al., 1993; Grooß and Russell, in preparation, 20042).
4. Denitrification
20
Figure1shows the simulated NOy change due to the sedimentation of the large NAT particles averaged over equivalent latitude range 65–90◦N for the reference simulation. The unperturbed NO∗y was simulated by a passive tracer that was initialized identically
2
Grooß, J.-U. and Russell, J. M.: Technical Note: A climatology based on HALOE data, Atmos. Chem. Phys. Discuss., in preparation, 2004.
ACPD
4, 8069–8101, 2004Denitrification and ozone loss for
2002/2003
J.-U. Grooß et al.
Title Page Abstract Introduction Conclusions References Tables Figures J I J I Back Close Full Screen / Esc
Print Version Interactive Discussion
EGU
as NOy and that was then advected and mixed without chemistry and denitrification. The maximum denitrification of over 5 ppb is reached in early January. After that, no significant additional denitrification was simulated and the denitrified air masses were only advected further. Also clearly visible is the re-nitrification at lower levels caused by the evaporation of the NAT particles. The diabatic descent within the polar vortex
5
causes the downward motion of the denitrification peak. The mixing ratio increase at the re-nitrification altitudes is lower than the mixing ratio decrease at denitrification altitudes, because the total mass of sedimented HNO3 should be conserved and the pressure increases with decreasing altitude. Visible is also the very small chemical production of NOy through the reaction of N2O with O(1D) in early February above
10
600 K.
Figure 2 shows examples for simulated NOy change on 19 January for the 425 K and 450 K levels. Note that the simulated NOy redistribution is very inhomogeneous in space at that time. This is due to the temperature threshold of the process. At locations with temperatures just above TNAT, all NAT particles evaporate relatively fast,
15
which leads to strong re-nitrification, while possibly particles at close by locations with slightly lower temperatures can sediment further down.
In the following we show comparisons of the simulated denitrification with observa-tions from MkIV and the Geophysica.
4.1. Early denitrification observed by MkIV
20
On 16 December 2002, the MkIV experiment on board the OMS remote balloon gon-dola measured N2O and all major NOy compounds among many other species (Toon
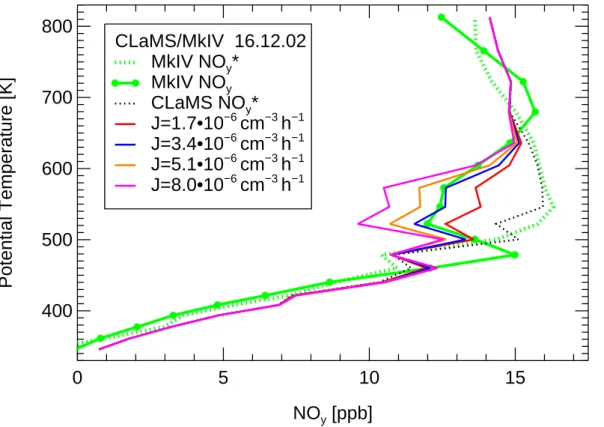
et al.,1999). At that time, already an onset of denitrification was both observed and simulated. These data are an important constraint for the denitrification parameteri-zation. Figures3 and 4 show the observations of NOy (green line) and NO∗y derived
25
from N2O (green dotted line) using the correlation mentioned above. The deviation between NOyand NO∗y from MkIV between about 500 and 650 K is very likely caused by denitrification. The colored lines show the corresponding CLaMS NOymixing ratios
ACPD
4, 8069–8101, 2004Denitrification and ozone loss for
2002/2003
J.-U. Grooß et al.
Title Page Abstract Introduction Conclusions References Tables Figures J I J I Back Close Full Screen / Esc
Print Version Interactive Discussion
EGU
for different parameterizations of denitrification. In Fig. 3 the nucleation rate of sed-imenting the NAT particles was varied from 1.7 to 8.0·10−6 cm−3 h−1. These results show clearly that an increase of the nucleation rate yields larger denitrification. For the reference simulation (marked blue in all figures unless otherwise stated) the nucle-ation rate of 3.4·10−6 cm−3 h−1yields the best agreement with observed NOy, the use
5
of a larger nucleation rate overestimates the denitrification. Additionally, the depen-dence of the denitrification on the NAT nucleation rate was investigated for the whole vortex area over the winter 2002/2003 (not shown here). The maximum difference of simulated NOymixing ratio between simulations with the nucleation rates 8.0·10−6and 3.4·10−6cm−3h−1averaged over equivalent latitudes above 65◦N was found on 15 and
10
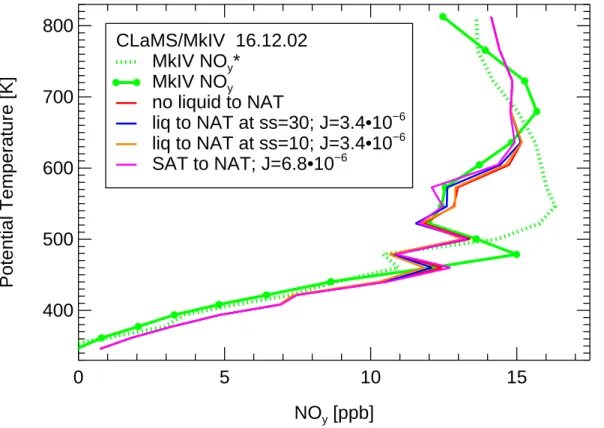
16 December (1.4 ppb at about 550 K). This indicates that the sensitivity with respect to the nucleation rate is not special for the observation location but typical for the whole vortex area. In later winter, the difference between the two simulations decreases with time, e.g. the vortex average NOy difference on 19 January peaks at 550 K to be only 0.7 ppb. In Fig.4, the conditions of formation of the mode with high NAT density are
15
varied. The red line shows a simulation in which NAT formation from liquid aerosol is suppressed, the blue and the orange line shows simulations in which the mode with high NAT density is formed at supersaturation 30 and 10, respectively. All these simu-lations with the nucleation rate 3.4·10−6 cm−3 h−1 show almost identical denitrification at the location of the MkIV observation. This is most likely because these
supersat-20
urations are not reached in the history of the observed air masses. Alternatively, the observed denitrification could be explained by using higher nucleation rates in combi-nation with hindering the growth of the NAT particles by the presence of a NAT mode with high particle density. This mode has been observed in December 2002 by Bal-loon and satellite measurements (Larsen et al.,2004;Spang et al.,2004). As shown
25
in Fig.4, this mode cannot be obtained in this case by varying the NAT supersatura-tion necessary to form NAT, but it can be reached by allowing NAT particles on SAT. The pink line shows a simulation in which the formation of NAT from SAT is allowed and the nucleation rate was doubled (6.8·10−6 cm−3 h−1). Both effects approximately
ACPD
4, 8069–8101, 2004Denitrification and ozone loss for
2002/2003
J.-U. Grooß et al.
Title Page Abstract Introduction Conclusions References Tables Figures J I J I Back Close Full Screen / Esc
Print Version Interactive Discussion
EGU
compensate. The SAT particles in the simulation originate from previously evaporated NAT particles that remained below the melting temperature of about 215 K. However, laboratory studies show show that NAT nucleation on SAT is unlikely (Iraci et al.,1995;
Koop et al.,1997). But similar results should be expected if instead of SAT other yet unknown condensation nuclei would form NAT. Although these assumptions yield a
5
quite similar denitrification as the reference simulation for the MkIV observations in December, they yield lower NOy redistribution in January and worse agreement with NOyobservations on the Geophysica that are shown in the next section. Therefore the assumption of NAT nucleation on SAT is not considered further.
On about 480 K potential temperature, the MkIV observations suggest re-nitrification
10
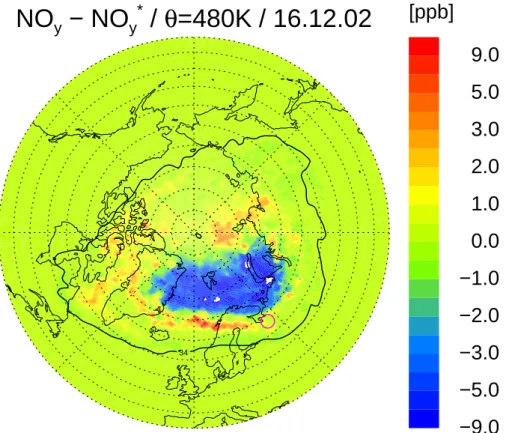
that seems not to be represented in the simulation. To investigate this deviation, we simulated the NOy redistribution with higher model resolution (100 km/30 levels). Fig-ure5 shows the simulated NOy change on the 480 K level. Here, the air in the vortex core is denitrified. Around this denitrified area, a filament of re-nitrified air is visible very close to the location of the MkIV observation (pink circle). Also the high resolution
15
simulation suggests no significant renitrification exactly at the observation location, it seems that the end of the filament was just missed. We conclude that this discrepancy between observation and model is likely a matter of model resolution or slight wind or temperature uncertainties of the meteorological analyses.
4.2. Comparison with geophysica observations
20
Between 15 January and 9 February, stratospheric in-situ measurements were ob-tained on 9 flights of the Geophysica aircraft within the scope of the VINTERSOL-EUPLEX campaign. Observations of chemically stable tracers can be used to validate the transport of the simulation. Figure 6 shows the comparison of HAGAR obser-vations (Volk et al., in preparation, 20043) and CLaMS simulation of the tracer N2O
25 3
Volk, C. M., Werner, A., Wetter, T., Ivanova, E., Wollny, A., Ulanovsky, A., Ravegnani, F., Schlager, H., Konopka, P., and Toon, G.: Ozone loss within the 2003 Arctic vortex derived from
ACPD
4, 8069–8101, 2004Denitrification and ozone loss for
2002/2003
J.-U. Grooß et al.
Title Page Abstract Introduction Conclusions References Tables Figures J I J I Back Close Full Screen / Esc
Print Version Interactive Discussion
EGU
that can be considered as chemically inert over the winter. The left panel shows the comparison along the flight of 19 January 2003. The right panel shows a scatter plot for all obtained N2O observations between 19 January and 9 February 2003 and the corresponding CLaMS observations. There is some indication that the model over-estimates N2O for mixing ratios below about 100 ppb, but in general this comparison
5
shows that the simulation is able to reproduce well the advection and mixing of the air masses. An increase of resolution to 100 km horizontal resolution and 30 vertical levels did slightly improve this comparison at the expense of high numerical costs. But the current resolution seems to be sufficient for the purpose of this study.
Between 15 January and 4 February, no PSC particles are simulated by the
sedimen-10
tation scheme which is expected because of the major warming in January. Therefore, no additional denitrification was simulated during this time period, but the denitrified air masses were advected. We compare the simulated denitrification with observations of denitrification determined from the difference of NOy measured by the SIOUX in-strument (Schlager et al., in preparation, 20044; Voigt et al., in preparation, 20041) and
15
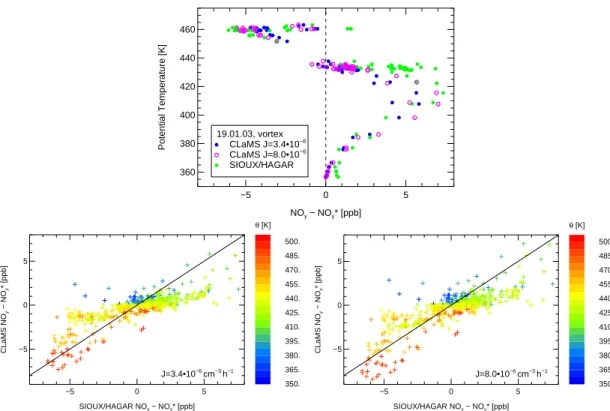
NO∗yderived from the HAGAR N2O measurements shown above without having to con-sider HNO3in the particle phase at these high temperatures. Figure7shows in the top panel the altitude dependence of vertical NOyredistribution for the parts of the flight of 19 January within the polar vortex (equivalent latitude >70◦). The shape of the denitri-fication and re-nitridenitri-fication profile is reproduced well. The absolute values are slightly
20
under-estimated for J=3.4·10−6cm−3h−1 and agree better for J=8.0·10−6 cm−3 h−1. The larger nucleation rate produces slightly higher denitrification and renitrification and the results may agree slightly better with the observations. Both, observations and the simulation do show the turnover level from denitrification to re-nitrification at about in situ observations with the Geophysica aircraft, Atmos. Chem. Phys. Discuss., in preparation, 2004.
4
Schlager, H., Voigt, C., Volk, M., Davies, S., Carslaw, K., Konopka, P., Roiger, A., and Stock, P.: Observations of denitrification and renitrification in the 2002–2003 Arctic winter stratosphere, Atmos. Chem. Phys. Discuss., in preparation, 2004.
ACPD
4, 8069–8101, 2004Denitrification and ozone loss for
2002/2003
J.-U. Grooß et al.
Title Page Abstract Introduction Conclusions References Tables Figures J I J I Back Close Full Screen / Esc
Print Version Interactive Discussion
EGU
440 K at that time. The northward part of the flight on 19 January was flown around that 440 K level. At this level CLaMS underestimates the re-nitrification. This may be caused by a too coarse vertical model resolution since a small deviation in altitude corresponds to a large deviation of NOy-NO∗yat this level.
The lower two panels of Fig.7show the comparison for all observations between 19
5
January and 9 February 2003 for both choices of the nucleation rate. The results are very similar and from this figure it cannot be deduced which nucleation rate J should be more likely. For the larger nucleation rate slightly higher denitrification and also re-nitrification is simulated and the results may agree slightly better with the observations. The reason for the similar results using the different nucleation rates is a saturation
10
effect. Since less HNO3is available in denitrified air, the threshold temperature for NAT formation is lowered and therefore additional denitrification is hindered. Therefore, the simulated vertical NOyredistribution depends significantly on the assumed particle nucleation rate most notably in early winter shortly after the onset of PSCs.
Also, the reference simulation was continued until mid-March. In March, the
denitri-15
fication is still well simulated. Figure8 shows the comparison of simulated NOy-NO∗y with derived denitrification from SIOUX and HAGAR for the flights on 8 March and 12 March for equivalent latitudes above 60◦N during the Envisat validation campaign.
5. Simulated ozone depletion
To investigate the ozone depletion in the winter 2002/2003, the simulation was
contin-20
ued until mid-March in order to include the second period of low stratospheric temper-atures in mid-February. Here we show the results with the high horizontal resolution of 100 km. Similar as for the denitrification, the chemical ozone depletion was determined by taking the difference between model ozone and a passive ozone tracer that was ini-tialized on 17 December identically as ozone and that is advected and mixed without
25
chemical change. The simulated ozone depletion averaged over the vortex as defined byNash et al.(1996) as function of time and potential temperature is shown in Fig.9.
ACPD
4, 8069–8101, 2004Denitrification and ozone loss for
2002/2003
J.-U. Grooß et al.
Title Page Abstract Introduction Conclusions References Tables Figures J I J I Back Close Full Screen / Esc
Print Version Interactive Discussion
EGU
The simulations indicate that vortex average ozone depletion reaches about 1.1 ppm in mid-March around the 460 K level. The simulated vortex average ozone column loss on 13 March between 380 K and 500 K was 46 Dobson units (21% of the partial ozone column), and between 350 K and 900 K it was 67 Dobson units (18%). To verify that the ozone depletion was simulated correctly over the winter, the simulated ozone mixing
5
ratios were compared with observations of ozone on 14 March 2003 made by MIPAS-ENVISAT. On that day, MIPAS data did have a good coverage of the polar vortex. Figure10shows the one to one comparison for MIPAS observations between 350 and 500 K potential temperature and for equivalent latitudes above 60◦N. The differences between simulation and observations can be explained by small-scale structures
be-10
low the resolution of CLaMS and the accuracy of the MIPAS observations of about 10% (Blumenstock et al.,2003). The average difference (±1σ) between simulated and observed ozone mixing ratios (CLaMS–MIPAS) is −0.07±0.25 ppm. The largest dif-ferences in the comparison occur at the edge and outside the vortex, for equivalent latitudes below 70◦N. Figure 11 shows ozone comparisons with the FOX instrument
15
(Schlager et al., in preparation, 20044) on board the Geophysica aircraft made during the Envisat validation campaign between 28 February and 16 March. Here the average difference (CLaMS-FOX) is also low −0.06±0.18 ppm. This indicates that all significant ozone loss processes in the vortex have been covered by the simulation.
The magnitude of the ozone depletion is comparable with estimates derived from
20
HALOE data using the tracer correlation method (Tilmes et al.,2003), but the altitude of the maximum ozone depletion is about 25 K higher in the simulation. Goutail et al.
(2004) report a slightly higher amount of ozone depletion, 23% of the total column derived from observations SAOZ UV-visible spectrometers and CTM passive ozone simulations. However, due to the different altitude range the results are not completely
25
comparable.
To compare with the results of Feng et al. (2004), one has to take into account that they use absorption cross section of the photolysis of Cl2O2 byBurkholder et al.
ACPD
4, 8069–8101, 2004Denitrification and ozone loss for
2002/2003
J.-U. Grooß et al.
Title Page Abstract Introduction Conclusions References Tables Figures J I J I Back Close Full Screen / Esc
Print Version Interactive Discussion
EGU Sander et al. (2003) that were used here. Therefore sensitivity simulations (150 km
resolution) were carried out with this absorption cross section which leads to more ozone depletion. In this simulation, the ozone column between 380 K and 550 K aver-aged for equivalent latitudes above 65◦N decreased by about 2.4 Dobson units by mid January and remained about constant at that value until the end of the simulations.
5
This corresponds to an increase of the column ozone depletion between 380 K and 550 K relative to the reference simulation of at most 13.5% on 11 January. At 12 March this corresponds to 6.0% more ozone depletion compared to the reference simulation.
Feng et al.(2004) show the partial ozone column loss between 345 K and 670 K aver-aged for areas above 65◦N equivalent latitude. The time development of the simulated
10
ozone loss in our simulation (350 K–670 K) is comparable until mid February. In early to mid-March, CLaMS simulates less ozone depletion, e.g. 50 Dobson units on 16 March, that is about 8 Dobson units less ozone depletion thanFeng et al. (2004). As shown above, only 2–3 Dobson units of the difference can be explained by the different Cl2O2 photolysis. One possible reason for the remaining difference may be a difference in
15
the simulated denitrification as explained below. However, in our simulation there is also no indication that the denitrification is not correctly simulated in March (compare Fig. 8). Further, the impact of denitrification on the simulated ozone depletion was investigated through an additional simulation in which the sedimentation scheme was deactivated. This was done with the lower horizontal resolution of 150 km. In general,
20
the simulated ozone depletion is very similar to the reference simulation. The largest effect of the denitrification was found towards the end of the simulation when the de-activation of active chlorine species is hindered by the denitrification. The maximum of the ozone depletion due to denitrification averaged over the vortex as defined byNash
et al. (1996) was determined to be 100 ppb at 460 K potential temperature
correspond-25
ing to 10% of the ozone depletion of the reference simulation.
Another striking feature is the simulated ozone depletion above the 600 K level. Un-like the levels below about 500 K where ozone loss is mainly caused by catalytic cycles involving chlorine and bromine compounds, no PSCs and no chlorine activation are
ACPD
4, 8069–8101, 2004Denitrification and ozone loss for
2002/2003
J.-U. Grooß et al.
Title Page Abstract Introduction Conclusions References Tables Figures J I J I Back Close Full Screen / Esc
Print Version Interactive Discussion
EGU
simulated at these altitudes. The reason for the ozone depletion above 600 K are cat-alytic cycles involving NOx. Especially in the winter 2002/2003, that was dynamically active, the time when vortex air was exposed to sunlight began earlier and was longer than in other winters. Therefore, also the typical summer ozone depletion started ear-lier. Such a behavior was also observed in the dynamically active 2002 Antarctic winter
5
(Grooß et al.,2004).
The chemical ozone depletion inside the vortex at altitudes above 600 K was also found in the comparison of a high resolution CLaMS tracer simulation and MIPAS ob-servations (Konopka et al., in preparation, 2004b5). A similar comparison as above with MIPAS data on 14 March 2003 between 500 K and 800 K yields a mean di
ffer-10
ence (CLaMS-MIPAS) of+0.30±0.45 ppm. That means the simulation slightly under-estimates the ozone depletion in that altitude range.
6. Conclusions
A Lagrangian module for single particle growth and advection was developed and in-tegrated in the Chemical Lagrangian Model of the Stratosphere (CLaMS). With this
15
model, the vertical redistribution of NOy for the winter 2002/2003 was successfully simulated. The presented simulations demonstrate that choosing a nucleation rate of J=3.4·10−6cm−3h−1 results in the best reproduction of the observed NOy in mid-December 2002. For that time period shortly after the onset of PSCs, the simulated denitrification is most sensitive to the nucleation rate in the absence of the mode with
20
high particle density. It has been also shown that the presence of the mode with high particle density (Larsen et al.,2004;Spang et al.,2004) decelerates the growth of the large NAT particles. Thus, in the presence of higher NAT particle number densities, the
5
Konopka, P., Grooß, J.-U., M ¨uller, R., et al.: Halogen- versus NOx-induced ozone loss in the Arctic middle stratosphere during the 2002/03 winter and spring, Atmos. Chem. Phys. Discuss., in preparation, 2004.
ACPD
4, 8069–8101, 2004Denitrification and ozone loss for
2002/2003
J.-U. Grooß et al.
Title Page Abstract Introduction Conclusions References Tables Figures J I J I Back Close Full Screen / Esc
Print Version Interactive Discussion
EGU
nucleation rate has to be increased to achieve similar results. Later in the winter in mid-January to early February, the simulated denitrification does not significantly depend on the nucleation rate.
Further, the simulated ozone loss over the simulation period was determined. By mid-March the vortex averaged ozone loss around 460 K was about 1.1 ppm
compa-5
rable to other ozone loss estimates. A sensitivity simulation showed that 10% of the ozone loss can be attributed to denitrification. At higher altitudes above 600 K also significant ozone loss was determined. This loss was caused by NOx-catalyzed ozone loss cycles in vortex air masses with large exposure to sunlight.
Acknowledgements. The authors thank B. Luo and T. Deshler for fruitful discussions. The
Eu-10
ropean Centre for Medium-Range Weather Forecasts (ECMWF) provided meteorological anal-yses and forecasts during campaign that were very helpful for flight planning. The European Space Agency (ESA) provided the ENVISAT-MIPAS data. We thank R. Spang for extracting the MIPAS data and providing the cloud index data. We also thank N. Thomas for her excel-lent programming support. This work was funded by the EU within the VINTERSOL-EUPLEX
15
project.
References
Becker, G., Grooß, J.-U., McKenna, D. S., and M ¨uller, R.: Stratospheric photolysis frequencies: Impact of an improved numerical solution of the radiative transfer equation, J. Atmos. Chem., 37, 217–229, 2000. 8077
20
Blumenstock, T., Griesfeller, A., Hase, F., Schneider, M., Boyd, I., Caliesi, Y., Godin, S., Koop-mann, R., Lambert, J.-C., Soebijanta, V., Swart, D., Raffalski, U., Schets, H., De Muer, D., Stebel, K., Steinbrecht, W., and Stubi, R.: Comparison of MIPAS O3profiles with
ground-based measurements, in: Proceedings of Envisat validation workshop 3–13 December 2002, ESA-SP-531, Frascati, Italy, 2003. 8083
25
Burkholder, J. B., Orlando, J. J., and Howard, C. J.: Ultraviolet absorption cross section of Cl2O2between 210 and 410 nm, J. Phys. Chem., 94, 687–695, 1990. 8083
Carslaw, K. S., Luo, B. P., and Peter, T.: An analytical expression for the composition of aqueous 8086
ACPD
4, 8069–8101, 2004Denitrification and ozone loss for
2002/2003
J.-U. Grooß et al.
Title Page Abstract Introduction Conclusions References Tables Figures J I J I Back Close Full Screen / Esc
Print Version Interactive Discussion
EGU
HNO3-H2SO4-H2O stratospheric aerosols including gas phase removal of HNO3, Geophys. Res. Lett., 22, 1877–1880, 1995. 8075
Carslaw, K. S., Kettleborough, J. A., Northway, M. J., Davies, S., Gao, R., Fahey, D. W., Baumgardner, D. G., Chipperfield, M. P., and Kleinb ¨ohl, A.: A vortex-scale simulation of the growth and sedimentation of large nitric acid hydrate particles, J. Geophys. Res., 107,
5
doi:10.1029/2001JD000467, 2002. 8071,8072,8073,8074,8075
Deshler, T., Larsen, N., Weissner, C., Schreiner, J., Mauersberger, K., Cairo, F., Adriani, A., Di Donfrancesco, G., Ovarlez, J., Ovarlez, H., Blum, U., Fricke, K. H., and D ¨ornbrack, A.: Large nitric acid particles at the top of an Arctic stratospheric cloud, J. Geophys. Res., 108, doi:10.1029/2003JD003479, 2003. 8071
10
Fahey, D. W., Kelly, K. K., Kawa, S. R., Tuck, A. F., Loewenstein, M., Chan, K. R., and Heid, L. E.: Observations of denitrification and dehydration in the winter polar stratosphere, Nature, 344, 321–324, 1990. 8071
Fahey, D. W., Gao, R. S., Carslaw, K. S., Kettleborough, J., Popp, P. J., Northway, M. J., Holecek, J. C., Ciciora, S. C., McLaughlin, R. J., Thompson, T. L., Winkler, R. H., Baumgardner, D. G.,
15
Gandrud, B., Wennberg, P. O., Dhaniyala, S., McKinley, K., Peter, T., Salawitch, R. J., Bui, T. P., Elkins, J. W., Webster, C. R., Atlas, E. L., Jost, H., Wilson, J. C., Herman, R. L., Kleinb ¨ohl, A., and von K ¨onig, M.: The detection of large HNO3-containing particles in the
winter Arctic stratosphere, Science, 291, 1026–1031, 2001. 8071
Feng, W., Chipperfield, M. P., Davies, S., Sen, B., Toon, G., Blavier, J. F., Webster, C. R., Volk,
20
C. M., Ulanovsky, A., Ravegnani, F., von der Gathen, P., Jost, H., Richard, E. C., and Claude, H.: Three-dimensional model study of the Arctic ozone loss in 2002/2003 and comparison with 1999/2000 and 2003/2004, Atmos. Chem. Phys. Discuss., 4, 5045–5074, 2004,
SRef-ID: 1680-7375/acpd/2004-4-5045. 8083,8084
Fueglistaler, S., Luo, B. P., Voigt, C., Carslaw, K. S., and Peter, T.: NAT-rock formation by
25
mother clouds: a microphysical model study, Atmos. Chem. Phys., 2, 93–98, 2002,
SRef-ID: 1680-7324/acp/2002-2-93. 8072
Goutail, F., Pommereau, J.-P., Lef `evre, F., Roozendael, M. V., Andersen, S. B., K ˚astad-Høiskar, B.-A., Dorokhov, V., Kyr ¨o, E., Chipperfield, M. P., and Feng, W.: Early unusual ozone loss during the arctic winter 2002/2003 compared to other winters, Atmos. Chem. Phys. Discuss.,
30
4, 5019–5044, 2004,
SRef-ID: 1680-7375/acpd/2004-4-5019. 8083
ACPD
4, 8069–8101, 2004Denitrification and ozone loss for
2002/2003
J.-U. Grooß et al.
Title Page Abstract Introduction Conclusions References Tables Figures J I J I Back Close Full Screen / Esc
Print Version Interactive Discussion
EGU
PhD thesis, University of Mainz, 1996. 8077
Grooß, J.-U., G ¨unther, G., Konopka, P., M ¨uller, R., McKenna, D. S., Stroh, F., Vogel, B., Engel, A., M ¨uller, M., Hoppel, K., Bevilacqua, R., Richard, E., Webster, C. R., Elkins, J. W., Hurst, D., Romashkin, P. A., and Baumgardner, D. G.: Simulation of ozone depletion in spring 2000 with the Chemical Lagrangian Model of the Stratosphere (CLaMS), J. Geophys. Res., 107,
5
8295, doi:10.1029/2001JD000456, 2002. 8073,8076
Grooß, J.-U., Konopka, P., and M ¨uller, R.: Ozone chemistry during the 2002 Antarctic vortex split, J. Atmos. Sci., in press, 2004. 8085
Hanson, D. R. and Mauersberger, K.: Laboratory studies of the nitric acid trihydrate: Implica-tions for the south polar stratosphere, Geophys. Res. Lett., 15, 855–858, 1988. 8071
10
Iraci, L. T., Middlebrook, A. M., and Tolbert, M. A.: Laboratory studies of the formation of polar stratospheric clouds: Nitric acid condensation on thin sulfuric acid films, J. Geophys. Res., 100, 20 969–20 977, 1995. 8080
Konopka, P., Steinhorst, H.-M., Grooß, J.-U., G ¨unther, G., M ¨uller, R., Elkins, J. W., Jost, H.-J., Richard, E., Schmidt, U., Toon, G., and McKen na, D. S.: Mixing and ozone loss in the 1999–
15
2000 arctic vortex: Simulations with the 3-dimensional Chemical Lagrangian Model of the Stratosphere (CLaMS), J. Geophys. Res., 109, doi:10.1029/2003JD003792, 2004a. 8073
Koop, T., Carslaw, K. S., and Peter, T.: Thermodynamic stability and phase transitions of PSC particles, Geophys. Res. Lett., 24, 2199–2202, 1997. 8080
Larsen, N., Knudsen, B. M., Svendsen, S. H., Deshler, T., Rosen, J. M., Kivi, R., Weisser, C.,
20
Schreiner, J., Mauersberger, K., Cairo, F., Ovarlez, J., Oelhaf, H., and Spang, R.: Formation of solid particles in synoptic-scale Arctic PSCs in early winter 2002/2003, Atmos. Chem. Phys., 4, 2001–2013, 2004,
SRef-ID: 1680-7324/acp/2004-4-2001. 8071,8072,8075,8079,8085
Luo, B., Voigt, C., Fueglistaler, S., and Peter, T.: Extreme NAT supersaturations
25
in mountain wave ice PSCs: A clue to NAT formation, J. Geophys. Res., 108, doi:10.1029/2002JD003104, 2003. 8072
Mann, G. W., Davies, S., Carslaw, K. S., Chipperfield, M. P., and Kettleborough, J.: Polar vortex concentricity as a controlling factor in Arctic denitrification, J. Geophys. Res., 107, doi:10.1029/2002JD002102, 2002. 8072
30
Mann, G. W., Davies, S., Carslaw, K. S., and Chipperfield, M. P.: Factors controlling Arctic denitrification in cold winters of the 1990s, Atmos. Chem. Phys., 3, 403–416, 2003,
SRef-ID: 1680-7324/acp/2003-3-403. 8072,8073
ACPD
4, 8069–8101, 2004Denitrification and ozone loss for
2002/2003
J.-U. Grooß et al.
Title Page Abstract Introduction Conclusions References Tables Figures J I J I Back Close Full Screen / Esc
Print Version Interactive Discussion
EGU
McKenna, D. S., Konopka, P., Grooß, J.-U., G ¨unther, G., M ¨uller, R., Spang, R., Offermann, D., and Orsolini, Y.: A new Chemical Lagrangian Model of the Stratosphere (CLaMS): Part I For-mulation of advection and mixing, J. Geophys. Res., 107, 4309, doi:10.1029/2000JD000114, 2002a. 8073
McKenna, D. S., Grooß, J.-U., G ¨unther, G., Konopka, P., M ¨uller, R., Carver, G., and
5
Sasano, Y.: A new Chemical Lagrangian Model of the Stratosphere (CLaMS): Part II Formulation of chemistry-scheme and initialisation, J. Geophys. Res., 107, 4256, doi:10.1029/2000JD000113, 2002b. 8073,8075
Nash, E. R., Newman, P. A., Rosenfield, J. E., and Schoeberl, M. R.: An objective determination of the polar vortex using Ertel’s potential vorticity, J. Geophys. Res., 101, 9471–9478, 1996.
10
8082,8084,8099
Naujokat, B. and Grunow, K., The stratospheric arctic winter 2002/03: Balloon flight planning by trajectory calculation, in: Proceedings of the 16th ESA Symposium on European Rocket and Balloon Programmes and Related Research, ESA SP-530, 421–425, St. Gallen, 2003.
8071
15
Popp, P. J., Northway, M. J., Holecek, J. C., Gao, R. S., Fahey, D. W., Elkins, J. W., Hurst, D. F., Romashkin, P. A., Toon, G. C., Sen, B., Schauffler, S. M., Salawitch, R. J., Webster, C. R., Herman, R. L., Jost, H., Bui, T. B., Newman, P. A., and Lait, L. R.: Severe and extensive denitrification in the 1999–2000 Arctic winter stratosphere, Geophys. Res. Lett., 28, 2875– 2878, 2001. 8076
20
Russell, J. M., Gordley, L. L., Park, J. H., Drayson, S. R., Tuck, A. F., Harries, J. E., Cicerone, R. J., Crutzen, P. J., and Frederick, J. E.: The Halogen Occultation Experiment, J. Geophys. Res., 98, 10 777–10 797, 1993. 8076
Sander, S. P., Friedl, R. R., Golden, D. M., Kurylo, M. J., Huie, R. E., Orkin, V., Moortgat, G. K., Ravishankara, A. R., Kolb, C. E., Molina, M. J., and Finlayson-Pitts, B. J.: Chemical
25
kinetics and photochemical data for use in atmospheric studies, Evaluation number 14, JPL Publication 02–25, 2003. 8084
Spang, R., Remedios, J. J., Kramer, L. J., Poole, L. R., Fromm, M. D., M ¨uller, M., Baumgarten, G., and Konopka, P.: Polar stratospheric cloud observations by MIPAS on ENVISAT: Detec-tion method, validataion and analysis of the Northern hemisphere winter 2002/2003, Atmos.
30
Chem. Phys. Discuss., 4, 6283–6319, 2004,
SRef-ID: 1680-7375/acpd/2004-4-6283. 8071,8076,8079,8085
nu-ACPD
4, 8069–8101, 2004Denitrification and ozone loss for
2002/2003
J.-U. Grooß et al.
Title Page Abstract Introduction Conclusions References Tables Figures J I J I Back Close Full Screen / Esc
Print Version Interactive Discussion
EGU
cleation of solid Polar Stratospheric Cloud particles, J. Phys. Chem. A, 106, 10 238–10 246, 2002. 8072
Tilmes, S., M ¨uller, R., Grooß, J.-U., H ¨opfner, M., Toon, G. C., and Russell, J. M.: Very early chlorine activation and ozone loss in the Arctic winter 2002–2003, Geophys. Res. Lett., 30, 2201, doi:10.1029/2003GL018079, 2003. 8071,8083
5
Toon, G. C., Blavier, J.-F., Sen, B., Margitan, J. J., Webster, C. R., May, R. D., Fahey, D., Gao, R., Del Negro, L., Proffitt, M., Elkins, J. W., Romashkin, P. A., Hurst, D. F., Oltmans, S., Atlas, E., Schauffler, S., Flocke, F., Bui, T. P., Stimpfle, R. M., Bonne, G. P., Voss, P. B., and Cohen, R. C.: Comparison of MkIV balloon and ER-2 aircraft measurements of atmospheric trace gases, J. Geophys. Res., 104, 26 779–26 790, 1999. 8076,8078
10
Voigt, C., Larsen, N., Deshler, T., Kr ¨oger, C., Schreiner, J., Mauersberger, K., Luo, B., Adriani, A., Cairo, F., Di Donfrances co, G., Ovarlez, J., Ovarlez, H., D ¨ornbrack, A., Knudsen, B., and Rosen, J.: In situ mountain-wave polar stratospheric cloud measurements: Implications for nitric acid trihydrate formation, J. Geophys. Res., 108, 8331, doi:10.1029/2001JD001185, 2003. 8072
15
Waibel, A. E., Peter, T., Carslaw, K. S., Oelhaf, H., Wetzel, G., Crutzen, P. J., P ¨oschl, U., Tsias, A., Reimer, E., and Fischer, H.: Arctic ozone loss due to denitrification, Science, 283, 2064–2069, 1999. 8071
ACPD
4, 8069–8101, 2004Denitrification and ozone loss for
2002/2003
J.-U. Grooß et al.
Title Page Abstract Introduction Conclusions References Tables Figures J I J I Back Close Full Screen / Esc
Print Version Interactive Discussion EGU 350 400 450 500 550 600 650 700 Potential Temperature [K]
NO
y− NO
y*, EQLAT > 65
oNO
y− NO
y*, EQLAT > 65
o 350 400 450 500 550 600 650 700 Potential Temperature [K] 01.12.02 01.01.03 01.02.03 −5.5 −4.7 −3.9 −3.1 −2.3 −1.5 −0.7 0.1 0.9 1.7 2.5 [ppb] 01.12.02 01.01.03 01.02.03Fig. 1. Simulated redistribution of NOy as function of time and potential temperature. Shown is the average over equivalent latitude range 65–90◦N for the period 17 November 2002 to 10 February 2003. The zero contour is displayed as a black line.
ACPD
4, 8069–8101, 2004Denitrification and ozone loss for
2002/2003
J.-U. Grooß et al.
Title Page Abstract Introduction Conclusions References Tables Figures J I J I Back Close Full Screen / Esc
Print Version Interactive Discussion EGU NOy−NOy* / θ=450K / 19.01.03 −9.0 −5.0 −3.0 −2.0 −1.0 0.0 1.0 2.0 3.0 5.0 9.0 [ppb] 32 32 32 NOy−NOy* / θ=425K / 19.01.03 −9.0 −5.0 −3.0 −2.0 −1.0 0.0 1.0 2.0 3.0 5.0 9.0 [ppb] 23.3 23.3 23.3
Fig. 2. Simulated redistribution of NOyon 19 January 2003 for the potential temperature levels 450 K (top) and 425 K (bottom). The pink line indicates the Geophysica flight path (transformed to synoptic 12:00 UT locations). The black line marks the vortex edge.
ACPD
4, 8069–8101, 2004Denitrification and ozone loss for
2002/2003
J.-U. Grooß et al.
Title Page Abstract Introduction Conclusions References Tables Figures J I J I Back Close Full Screen / Esc
Print Version Interactive Discussion EGU
0
5
10
15
NO
y[ppb]
400
500
600
700
800
Potential Temperature [K]
CLaMS/MkIV 16.12.02
MkIV NO
y*
MkIV NO
yCLaMS NO
y*
J=1.7•10
−6cm
−3h
−1J=3.4•10
−6cm
−3h
−1J=5.1•10
−6cm
−3h
−1J=8.0•10
−6cm
−3h
−1Fig. 3. NOyobservation and simulations. Shown are MkIV observation of NOy(green line) and NO∗yderived from N2O (dotted green line) as well as CLaMS simulations for NO∗y(black dotted line) and NOy (colored lines) with different nucleation rates J for the mode with low particle density as indicated in the legend.
ACPD
4, 8069–8101, 2004Denitrification and ozone loss for
2002/2003
J.-U. Grooß et al.
Title Page Abstract Introduction Conclusions References Tables Figures J I J I Back Close Full Screen / Esc
Print Version Interactive Discussion EGU
0
5
10
15
NO
y[ppb]
400
500
600
700
800
Potential Temperature [K]
CLaMS/MkIV 16.12.02
MkIV NO
y*
MkIV NO
yno liquid to NAT
liq to NAT at ss=30; J=3.4•10
−6liq to NAT at ss=10; J=3.4•10
−6SAT to NAT; J=6.8•10
−6Fig. 4. As Fig. 3, but for different denitrification parameterizations. The colored lines show
results of CLaMS simulations for different formation assumptions for the NAT mode with high particle density. No NAT formation from liquid aerosol (red), Formation at HNO3supersaturation over NAT of 30 (blue) and 10 (orange), and with NAT formation from SAT in combination with a doubled nucleation rate (pink).
ACPD
4, 8069–8101, 2004Denitrification and ozone loss for
2002/2003
J.-U. Grooß et al.
Title Page Abstract Introduction Conclusions References Tables Figures J I J I Back Close Full Screen / Esc
Print Version Interactive Discussion EGU
NO
y− NO
y*/
θ
=480K / 16.12.02
−9.0
−5.0
−3.0
−2.0
−1.0
0.0
1.0
2.0
3.0
5.0
9.0
[ppb]
34 34Fig. 5. Simulated redistribution of NOy on 16 December 2002 for the potential temperature level 480 K for CLaMS simulation with 100 km horizontal resolution. The pink circle indicates the MkIV observation point (transformed to synoptic 12:00 UT location). The black line marks the vortex edge.
ACPD
4, 8069–8101, 2004Denitrification and ozone loss for
2002/2003
J.-U. Grooß et al.
Title Page Abstract Introduction Conclusions References Tables Figures J I J I Back Close Full Screen / Esc
Print Version Interactive Discussion EGU 14:00 15:00 16:00 17:00 Time [UT] 50 100 150 200 250 300 N2 O [ppb] 19.01.2003 CLaMS HAGAR 50 100 150 200 250 300 HAGAR N2O [ppb] 50 100 150 200 250 300 CLaMS N 2 O [ppb] 350. 365. 380. 395. 410. 425. 440. 455. 470. 485. 500. θ [K]
Fig. 6. Comparison of CLaMS simulations with HAGAR N2O observations. Time series for the Geophysica flight on 19 January 2003 (left). The right panel shows a one to one comparison for all flights between 19 January and 9 February 2003. The potential temperature of the observation is marked as indicated by the color bar.
ACPD
4, 8069–8101, 2004Denitrification and ozone loss for
2002/2003
J.-U. Grooß et al.
Title Page Abstract Introduction Conclusions References Tables Figures J I J I Back Close Full Screen / Esc
Print Version Interactive Discussion EGU −5 0 5 NOy − NOy* [ppb] 360 380 400 420 440 460 Potential Temperature [K] 19.01.03, vortex CLaMS J=3.4•10−6 CLaMS J=8.0•10−6 SIOUX/HAGAR −5 0 5 SIOUX/HAGAR NOy − NOy* [ppb] −5 0 5 CLaMS NO y − NO y * [ppb] 350. 365. 380. 395. 410. 425. 440. 455. 470. 485. 500. θ [K] J=3.4•10−6 cm−3 h−1 −5 0 5 SIOUX/HAGAR NOy − NOy* [ppb] −5 0 5 CLaMS NO y − NO y * [ppb] 350. 365. 380. 395. 410. 425. 440. 455. 470. 485. 500. θ [K] J=8.0•10−6 cm−3 h−1
Fig. 7. Comparison of denitrification from CLaMS simulation with that derived from SIOUX and HAGAR observations. The lower panels show the altitude profile within the polar vor-tex core (equivalent latitude >70◦). Only the CLaMS data directly corresponding to the observations are shown. Blue circles correspond to the reference simulation with nucle-ation rate J=3.4·10−6
cm−3h−1 and the pink open circles the simulation with nucleation rate J=8.0·10−6cm−3h−1. The middle and bottom panels show the one to one comparison for all flights between 19 January and 9 February for these two nucleation rates. The potential temperature of the observation is marked as indicated by the color bar.
ACPD
4, 8069–8101, 2004Denitrification and ozone loss for
2002/2003
J.-U. Grooß et al.
Title Page Abstract Introduction Conclusions References Tables Figures J I J I Back Close Full Screen / Esc
Print Version Interactive Discussion EGU −6 −4 −2 0 2 4 SIOUX/HAGAR NOy − NOy* −6 −4 −2 0 2 4 CLaMS NO y − NO y * 60. 63. 66. 69. 72. 75. 78. 81. 84. 87. 90. EQLAT
08.03. − 12.03.2003
350K <
θ
< 455K
Fig. 8. Comparison of NOy-NO∗y simulated by CLaMS and derived from SIOUX and HAGAR
observations on Geophysica on 8 and 12 March 2003 for equivalent latitudes above 60◦N. The color of the symbols denotes the equivalent latitude of the observation location.
ACPD
4, 8069–8101, 2004Denitrification and ozone loss for
2002/2003
J.-U. Grooß et al.
Title Page Abstract Introduction Conclusions References Tables Figures J I J I Back Close Full Screen / Esc
Print Version Interactive Discussion EGU 400 500 600 700 800 Potential Temperature [K]
∆
O
3, Vortex avg (Nash)
∆
O
3, Vortex avg (Nash)
400 500 600 700 800 Potential Temperature [K] 01.12.02 01.01.03 01.02.03 01.03.03 −1400. −1200. −1000. −800. −600. −400. −300. −200. −100. −50. 0. [ppb] 01.12.02 01.01.03 01.02.03 01.03.03
Fig. 9. Simulated ozone loss as function of time and potential temperature. Shown is the vortex average using the vortex definition ofNash et al.(1996) for the period 17 November 2002 to 16 March 2003.
ACPD
4, 8069–8101, 2004Denitrification and ozone loss for
2002/2003
J.-U. Grooß et al.
Title Page Abstract Introduction Conclusions References Tables Figures J I J I Back Close Full Screen / Esc
Print Version Interactive Discussion EGU
Comparison CLaMS/MIPAS
1 2 3 4 MIPAS O3 1 2 3 4 CLaMS O 3 60. 63. 66. 69. 72. 75. 78. 81. 84. 87. 90. EQLAT14.03.2003
350K <
θ
< 500K
Fig. 10. Comparison of ozone mixing ratios simulated by CLaMS and observed by MIPAS for potential temperatures between 350 K and 500 K on 14 March 2003. The color of the symbols denotes the equivalent latitude of the observation location.
ACPD
4, 8069–8101, 2004Denitrification and ozone loss for
2002/2003
J.-U. Grooß et al.
Title Page Abstract Introduction Conclusions References Tables Figures J I J I Back Close Full Screen / Esc
Print Version Interactive Discussion EGU 0.0 0.5 1.0 1.5 2.0 FOX O3 [ppm] 0.0 0.5 1.0 1.5 2.0 CLaMS O 3 [ppm] 60. 63. 66. 69. 72. 75. 78. 81. 84. 87. 90. EQLAT
28.02. − 16.03.2003
350K <
θ
< 438K
Fig. 11. Comparison of ozone mixing ratios simulated by CLaMS and observed by FOX on Geophysica between 28 February and 16 March 2003, The color of the symbols denotes the equivalent latitude of the observation location.